US Dollar Outlook: USD/CHF
USD/CHF appears to be pulling back ahead of the July high (0.9051) as the Relative Strength Index (RSI) continues to move away from overbought territory, but the exchange rate may defend the rally following the US election should it track the positive slope in the 50-Day SMA (0.8692).
USD/CHF Pullback Faces Positive Slope in 50-Day SMA
Keep in mind, the USD/CHF rally from last month pushed the RSI above 70 for the first time since April, and the recent weakness in the exchange rate may turn out to be temporary as the US Job Openings and Labor Turnover Survey (JOLTS) prints at 7.744M in October versus forecasts for a 7.480M reading.
Join David Song for the Weekly Fundamental Market Outlook webinar.
David provides a market overview and takes questions in real-time. Register Here
Signs of a resilient labor market may push the Federal Reserve to the sidelines as the economy shows little indications of a looming recession, and the central bank may keep US interest rates on hold at its last meeting for 2024 as Chairman Jerome Powell and Co. insist that ‘it would likely be appropriate to move gradually toward a more neutral stance of policy over time.’
US Economic Calendar

In turn, waning expectations for a Fed rate-cut in December may keep USD/CHF afloat, and the Non-Farm Payrolls (NFP) report may also influence foreign exchange markets as the update is anticipated to show the US economy adding 200K jobs in November.
With that said, USD/CHF may stage further attempts to test the July high (0.9051) should it track the positive slope in the 50-Day SMA (0.8692), but the exchange rate may give back the rally following the US election if it fails to hold above the moving average.
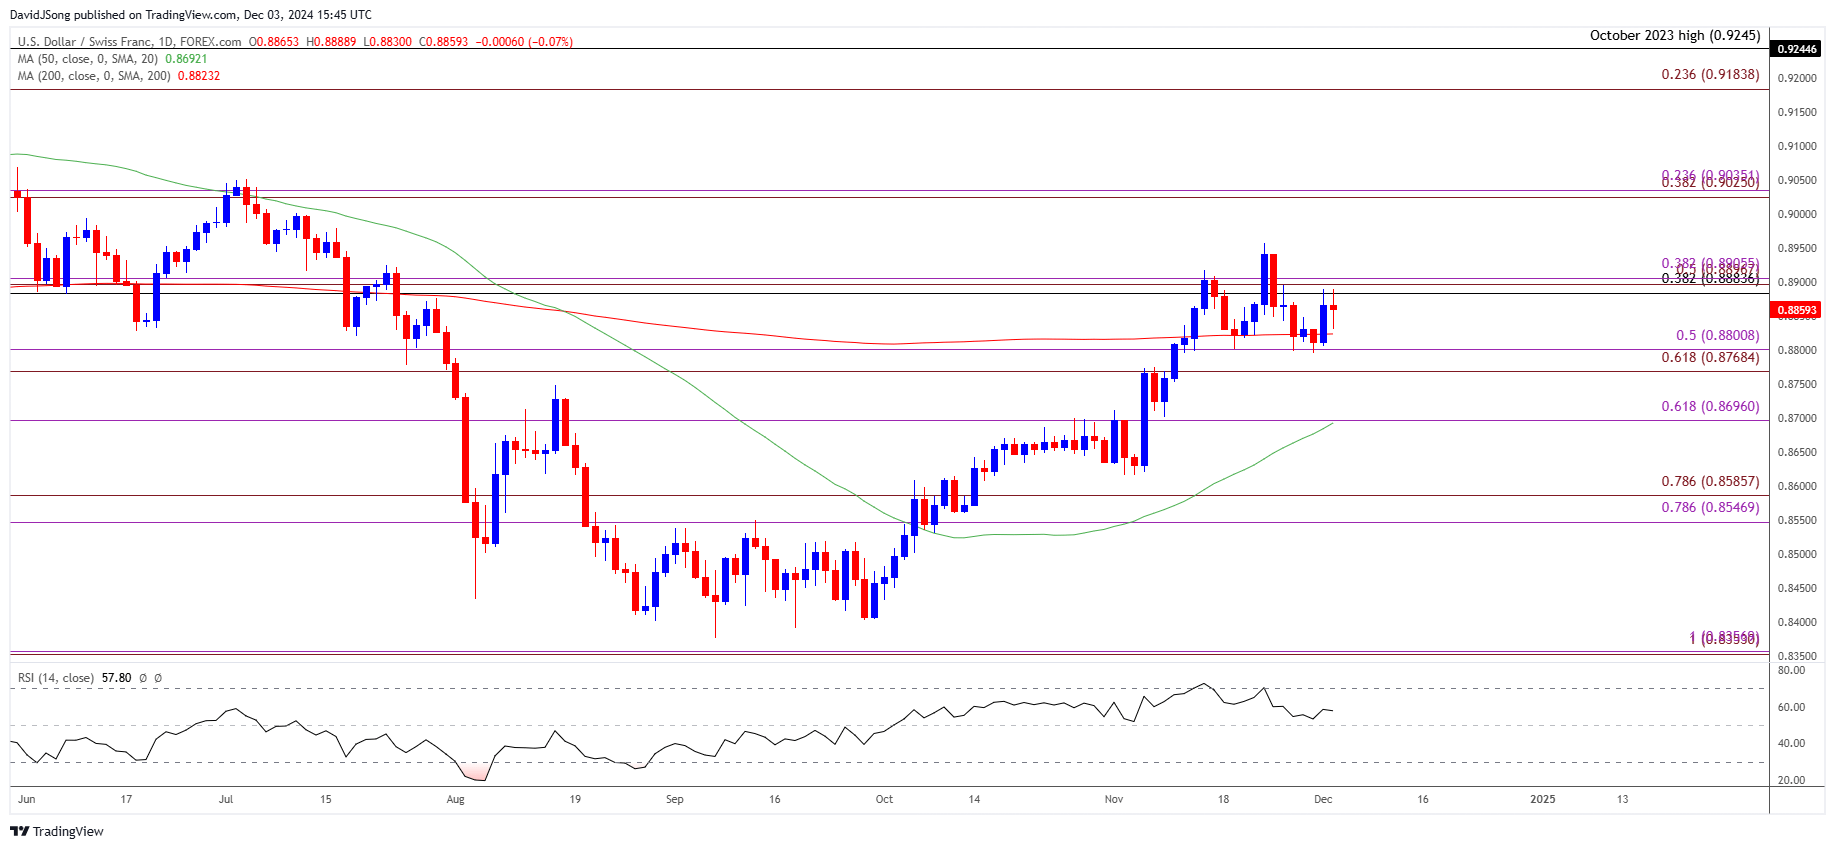
USD/CHF Price Chart – Daily

Chart Prepared by David Song, Strategist; USD/CHF Price on TradingView
- USD/CHF pares the advance from the start of the week as it struggles to trade back above the 0.8880 (38.2% Fibonacci retracement) to 0.8910 (38.2% Fibonacci extension) zone, with a break/close below the 0.8770 (61.8% Fibonacci extension) to 0.8800 (50% Fibonacci extension) region raising the scope for a move towards 0.8700 (61.8% Fibonacci extension).
- Next area of interest comes in around the November low (0.8615), but USD/CHF may extend the advance from the start of the month as it holds above the 0.8770 (61.8% Fibonacci extension) to 0.8800 (50% Fibonacci extension) region.
- Need a close above the 0.8880 (38.2% Fibonacci retracement) to 0.8910 (38.2% Fibonacci extension) zone to bring the November high (0.8958) on the radar, with a break/close above the 0.9030 (38.2% Fibonacci extension) to 0.9040 (23.6% Fibonacci extension) region opening up the July high (0.9051).
Additional Market Outlooks
USD/CAD Defends Post-US Election Rally to Eye November High
US Dollar Forecast: USD/JPY Gives Back Post-US Election Rally
US Dollar Forecast: GBP/USD Still Vulnerable to Test of May Low
NZD/USD Rebounds Ahead of 2023 Low with RBNZ Expected to Cut
--- Written by David Song, Senior Strategist
Follow on Twitter at @DavidJSong


