USD/CAD Outlook
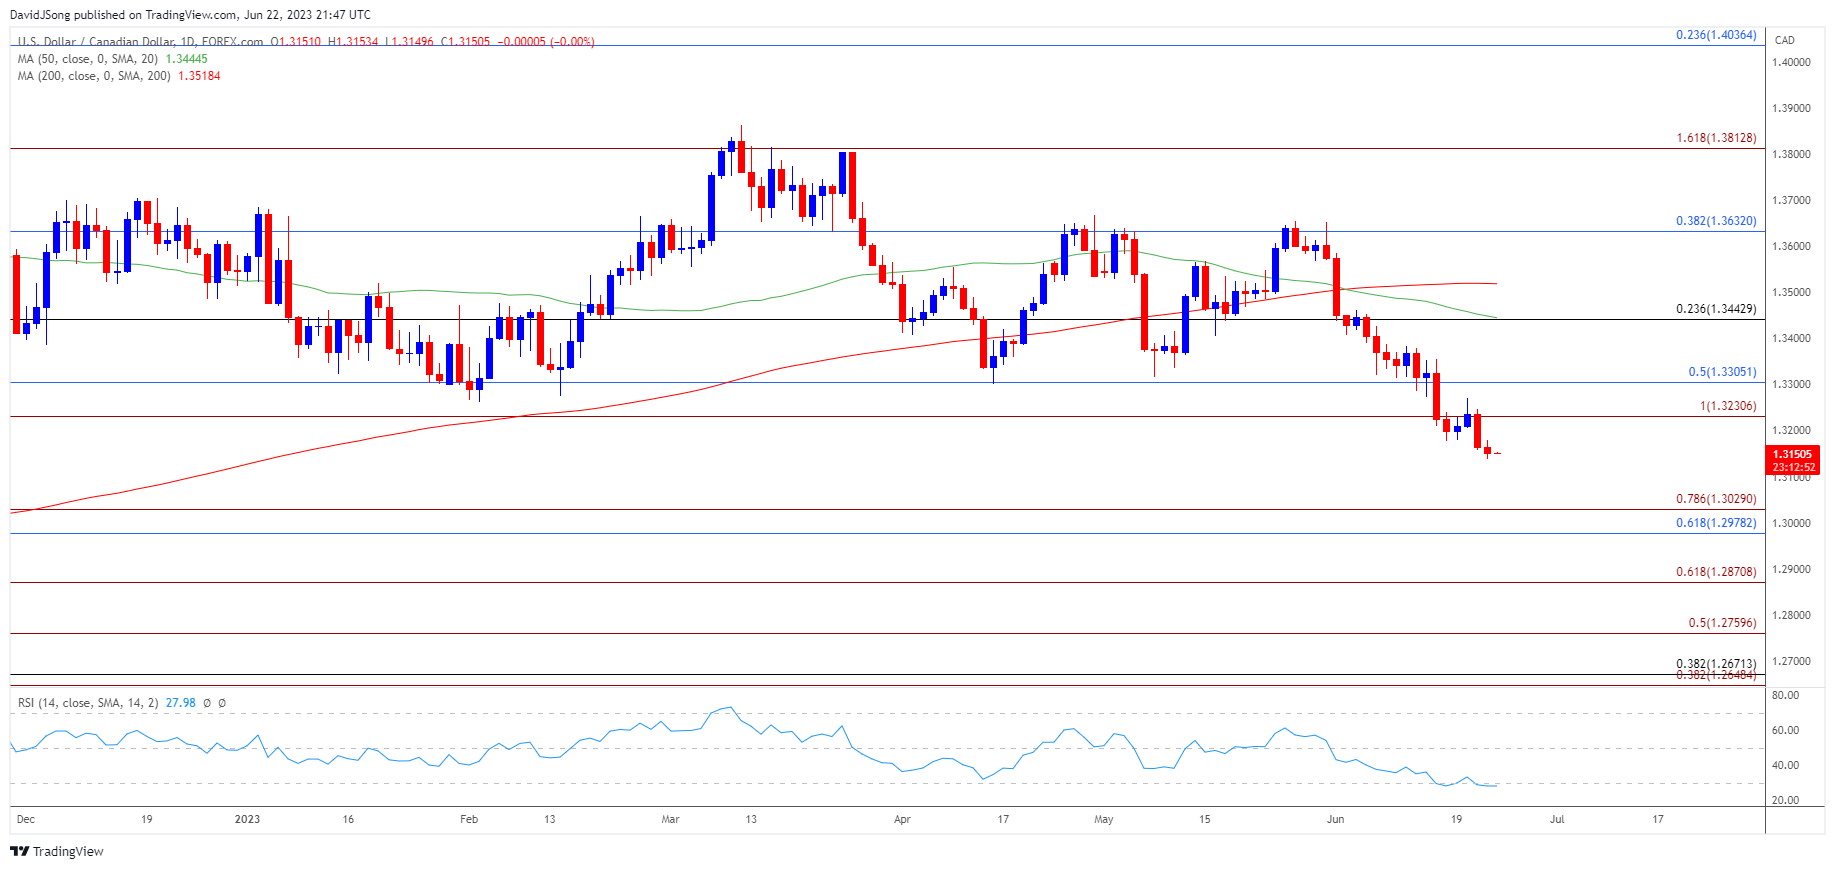
USD/CAD gives back the advance from the start of the week to trade to a fresh yearly low (1.3139), and the move back below 30 in the Relative Strength Index (RSI) may accompany a further decline in the exchange rate as the bearish momentum appears to be gathering pace.
USD/CAD Weakness Triggers Another Oversold RSI Reading
The recent decline in USD/CAD has pushed the RSI into oversold territory for the second time this month, and the exchange rate may continue to give back the advance from the September 2022 low (1.2954) as the summary of the Bank of Canada’s (BoC) June meeting reveals that ‘the rebalancing of supply and demand was likely to take longer than previously expected.’
Join David Song for the Weekly Fundamental Market Outlook webinar. Register Here

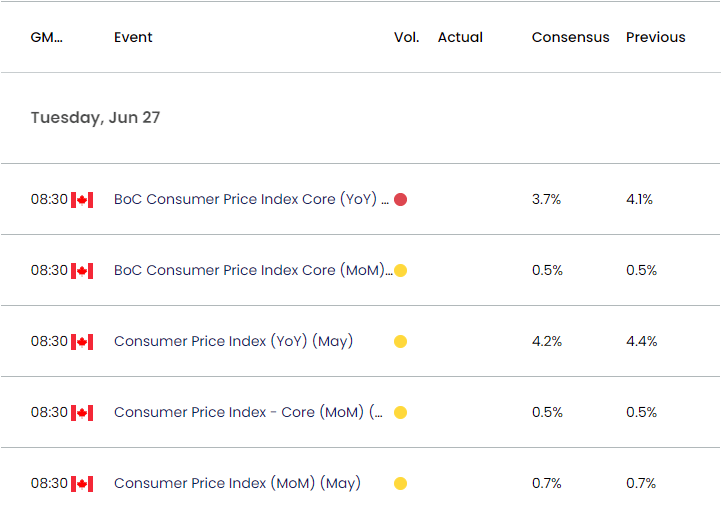
However, the update to Canada’s Consumer Price Index (CPI) may sway USD/CAD as the report is anticipated to show both the headline and core rate slowing in May, and evidence of slowing inflation may encourage the BoC to pause its hiking-cycle again as the ‘Governing Council still expected that inflation would fall to about 3% this summer.’
At the same time, a stronger-than-expected CPI print may push the BoC to pursue a more restrictive policy as ‘consumer demand was proving more robust than Governing Council had expected,’ and Governor Tiff Macklem and Co. may implement another 25bp rate hike at the next meeting on July 12 as ‘all members felt that a broad range of indicators had increased their concern that the disinflationary momentum needed to bring inflation back to the 2% target could be waning.’
With that said, developments coming out of Canada may sway USD/CAD over the coming days as the BoC keeps the door open to implement higher interest rates, but the move below 30 in the Relative Strength Index (RSI) may accompany a further decline in the exchange rate like the price action from 2021.
Canadian Dollar Price Chart – USD/CAD Daily

Chart Prepared by David Song, Strategist; USD/CAD Price on TradingView
- USD/CAD registers a fresh yearly low (1.3139) after struggling to push back above the 1.3230 (100% Fibonacci extension) to 1.3310 (50% Fibonacci retracement) region, with the recent decline in the exchange rate pushing the Relative Strength Index (RSI) into oversold territory for the second time in June.
- USD/CAD may continue to carve a series of lower highs and lows as long as the RSI sits below 30, with a break/close below the 1.2980 (61.8% Fibonacci retracement) to 1.3030 (78.6% Fibonacci extension) area bringing the September 2022 low (1.2954) on the radar.
- Next region of interest comes in around 1.2870 (61.8% Fibonacci extension), but lack of momentum to a break/close below the 1.2980 (61.8% Fibonacci retracement) to 1.3030 (78.6% Fibonacci extension) area may keep USD/CAD within a defined range, with a move above 30 in the RSI raising the scope for a move towards the 1.3230 (100% Fibonacci extension) to 1.3310 (50% Fibonacci retracement) region.
Additional Market Outlooks
USD/JPY Rate Outlook Vulnerable to RSI Divergence
GBP/USD Pulls Back to Keep RSI Out of Overbought Territory
--- Written by David Song, Strategist
Follow on Twitter at @DavidJSong


