USD/CAD, US CPI Talking Points:
- USD/CAD has put in a sizable breakout so far in August trade after running into a longer-term support trendline in July.
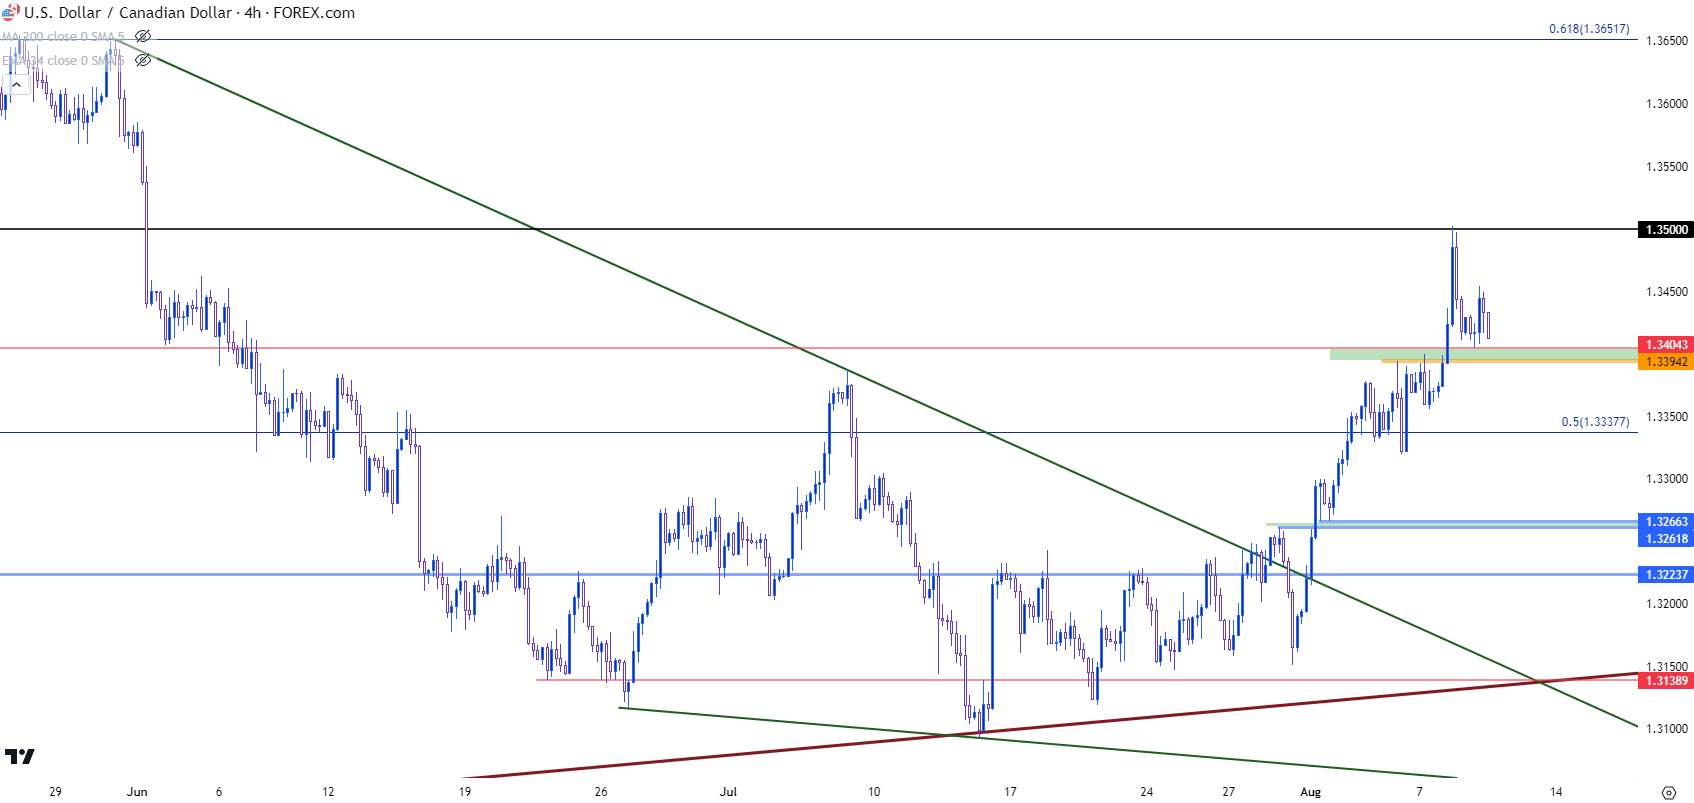
- USD/CAD tagged the 1.3500 level yesterday and has since moved back for a support test at the 1.3400 level. Tomorrow’s release of US CPI data will likely be the next major push point for the US Dollar, and this could in-turn drive USD/CAD price action.
- I’ll be discussing these themes in-depth in the weekly webinar on Tuesday at 1PM ET. It’s free for all to register: Click here to register.
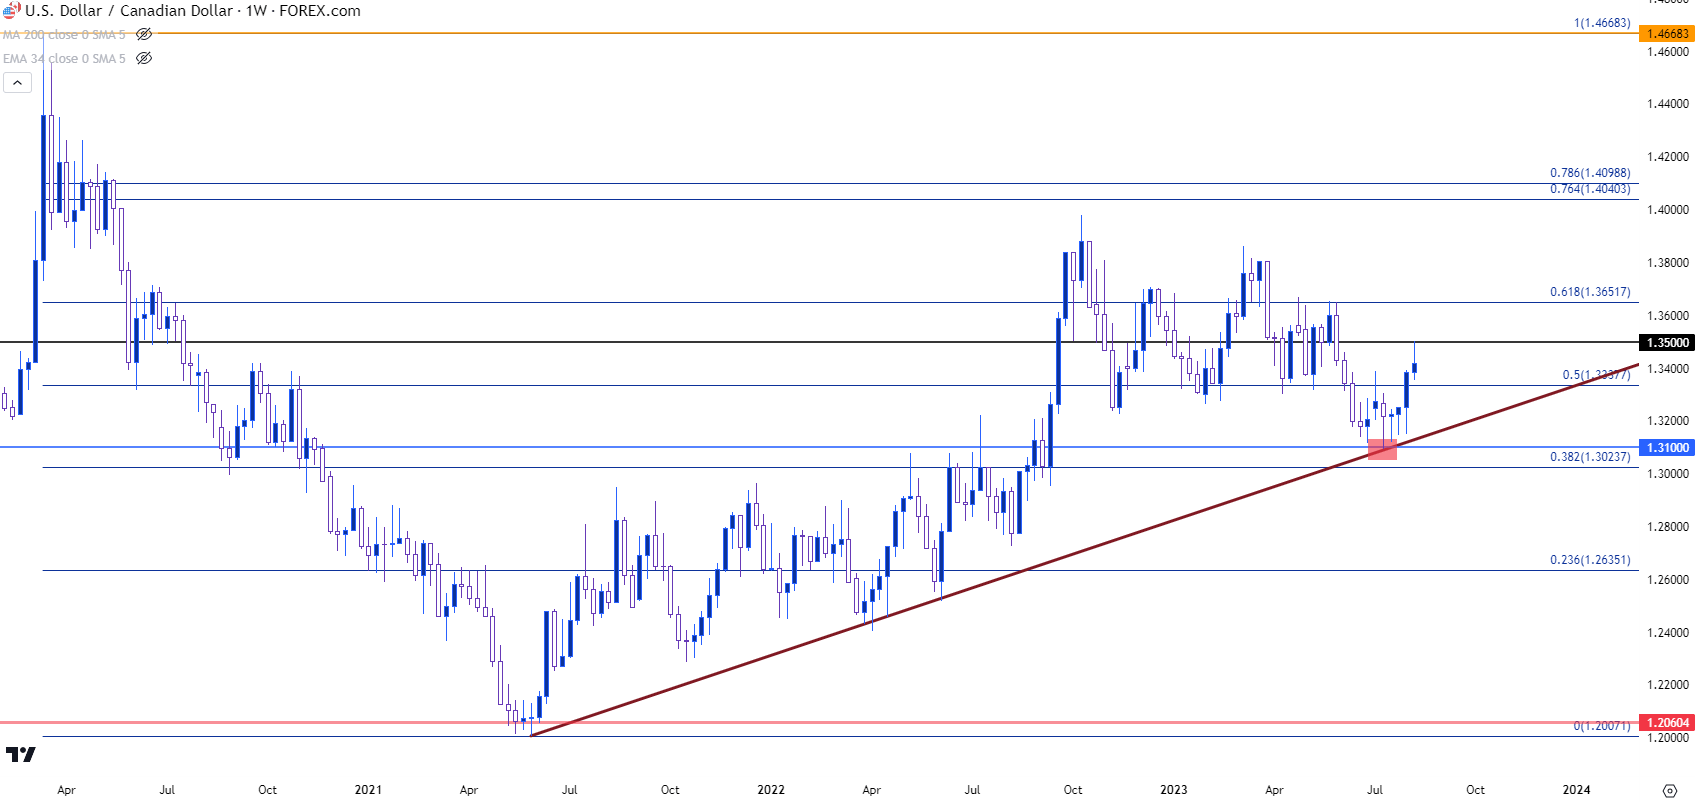
USD/CAD has just put in the first test at the 1.3500 level since the first day of June, when the pair was sliding from resistance at 1.3652 and, eventually, putting in a support break after an unexpected rate hike out of the Bank of Canada.
As expectations had built for the Fed to pause for the first time in the current hiking cycle, the surprise move by the BoC helped to dishevel the pair with the incursion of CAD-strength. USD/CAD fell to a fresh nine-month-low in the middle of June, and eventually caught another shot-in-the-arm after the release of US CPI in July. That driver is of note, as that’s what helped to bring on the trendline test at the 1.3100 handle, which was confluent with a bullish trendline at the time.
That trendline test helped to set the low as the bearish move stalled, and from the weekly chart, we can see a number of underside wicks as sellers spun their wheels yet were unable to bring on any fresh lows.
USD/CAD Weekly Price Chart

Chart prepared by James Stanley, USD/CAD on Tradingview
USD/CAD Shorter-Term
After that trendline test, bears were stalled, and that gyration looked at on the above weekly chart shows as very mixed an indecisive price action on the daily chart. As this was happening with bears unable to drive to fresh lows, a falling wedge formation had formed. Such formations are often approached with the aim of bullish reversals, and this is what started to show in early-August trade.
USD/CAD Daily Price Chart

Chart prepared by James Stanley, USD/CAD on Tradingview
USD/CAD Four-Hour
I had looked into the matter during the Tuesday webinar, highlighting a resistance level at the 1.3500 handle that had already come into help hold the highs. Given the pace of the August breakout, it seemed there was potential for pullback, especially considering the way that this week’s economic docket lined up. The big driver for US macro markets remains ahead, with the Thursday release of CPI data. And this is expected to move higher, at least on a headline CPI basis, for the first time since US headline CPI printed a fresh high last July.
I had also looked into support potential in that webinar while highlighting the 1.3400 level. That’s already come into play to allow for a 50-pip bounce, but buyers were unable to hold the move and price has pared back towards the support zone.
This highlights a couple of possible scenarios of interest: If that support holds overnight and into the CPI print, this could be a show of higher-low support which could keep the door open for bullish trend scenarios. The 1.3500 level is obvious as this has already served as resistance, but it’s the 1.3652 level above that that looms large as this was a price level that was repeatedly in the picture in varying ways from February through May. The other scenario of interest would be a deeper pullback, which can show how responsive longer-term bulls might be to support potential around the Fibonacci level at 1.3338, or perhaps as deep as that resistance-turned-support area around 1.3261(8).
USD/CAD Four-Hour Price Chart

Chart prepared by James Stanley, USD/CAD on Tradingview
--- written by James Stanley, Senior Strategist


