Canadian Dollar Outlook: USD/CAD
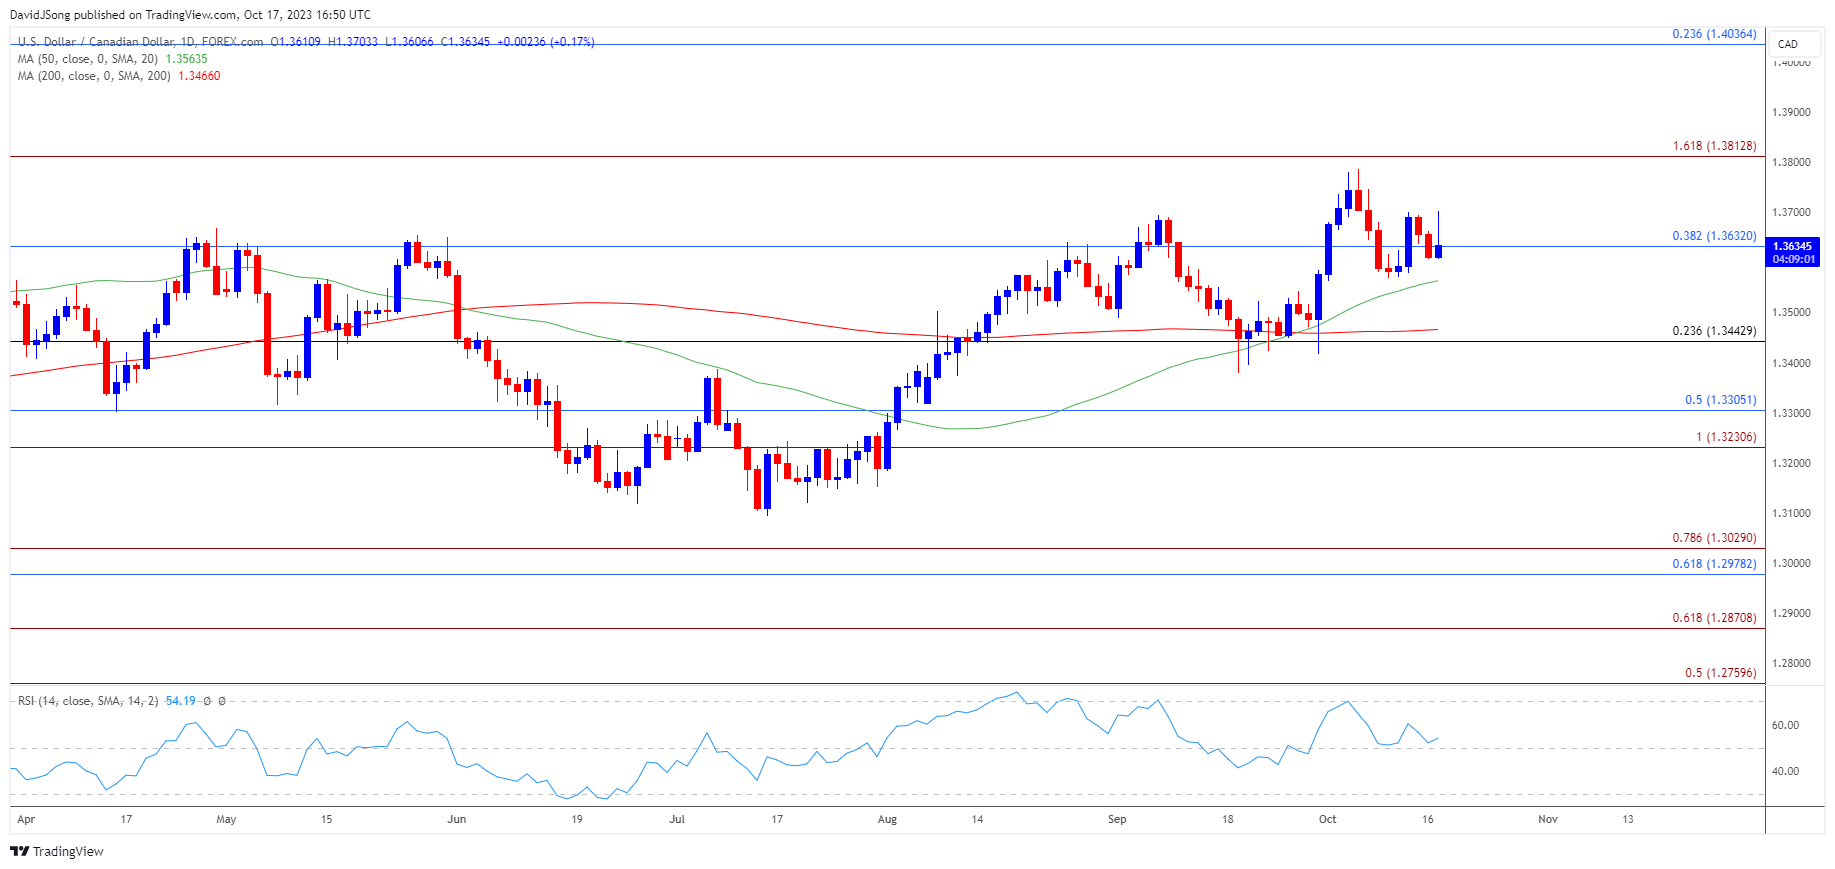
USD/CAD trades to a fresh weekly high (1.3703) as Canada’s Consumer Price Index (CPI) prints at 3.8% in September versus forecasts for a 4.0% reading, and the exchange rate may track the positive slope in the 50-Day SMA (1.3564) as it bounces back ahead of the moving average.
USD/CAD Rebounds Ahead of 50-Day SMA amid Slowdown in Canada CPI
USD/CAD seems to be confined within the monthly opening range following the failed attempt to test the yearly high (1.3862), but the Canadian Dollar may face headwinds ahead of the next Bank of Canada (BoC) meeting on October 25 as signs of slowing inflation encourages the central bank to retain the current policy.
Join David Song for the Weekly Fundamental Market Outlook webinar. David provides a market overview and takes questions in real-time. Register Here
Until then, developments coming out of the US may sway USD/CAD as the Retail Sales report shows a 0.7% rise in September, and little signs of a looming recession may fuel speculation for higher interest rates as the central bank keeps the door open to pursue a more restrictive policy.
US Economic Calendar

In turn, fresh comments from Fed Chairman Jerome Powell may keep USD/CAD afloat as ‘a majority of participants judged that one more increase in the target federal funds rate at a future meeting would likely be appropriate,’ but a change in the forward guidance for monetary policy may drag on the Greenback as the Federal Open Market Committee (FOMC) appears to be nearing the end of its hiking-cycle.
With that said, USD/CAD may trade within a defined range if it fails to clear the monthly high (1.3786), but the exchange rate may track the positive slope in the 50-Day SMA (1.3564) as it rebounds ahead of the moving average.
USD/CAD Price Chart –Daily

Chart Prepared by David Song, Strategist; USD/CAD Price on TradingView
- USD/CAD seems to be confined within the opening range for October after failing to test the yearly high (1.3862), but the exchange rate may track the positive slope in the 50-Day SMA (1.3564) as it holds above the moving average.
- Need a move above 1.3810 (161.8% Fibonacci extension) to bring the yearly high (1.3862) back on the radar, with the next area of interest coming in around the 2022 high (1.3978).
- However, failure to defend the monthly low (1.3562) may lead to a test of the moving average, with the next region of interest coming in around 1.3440 (23.6% Fibonacci retracement).
Additional Market Outlooks
Australian Dollar Forecast: AUD/USD Enclosed in Monthly Opening Range
US Dollar Forecast: EUR/USD Rebound Stalls at Former Support Zone
--- Written by David Song, Strategist
Follow on Twitter at @DavidJSong


