US Dollar Outlook: USD/CAD
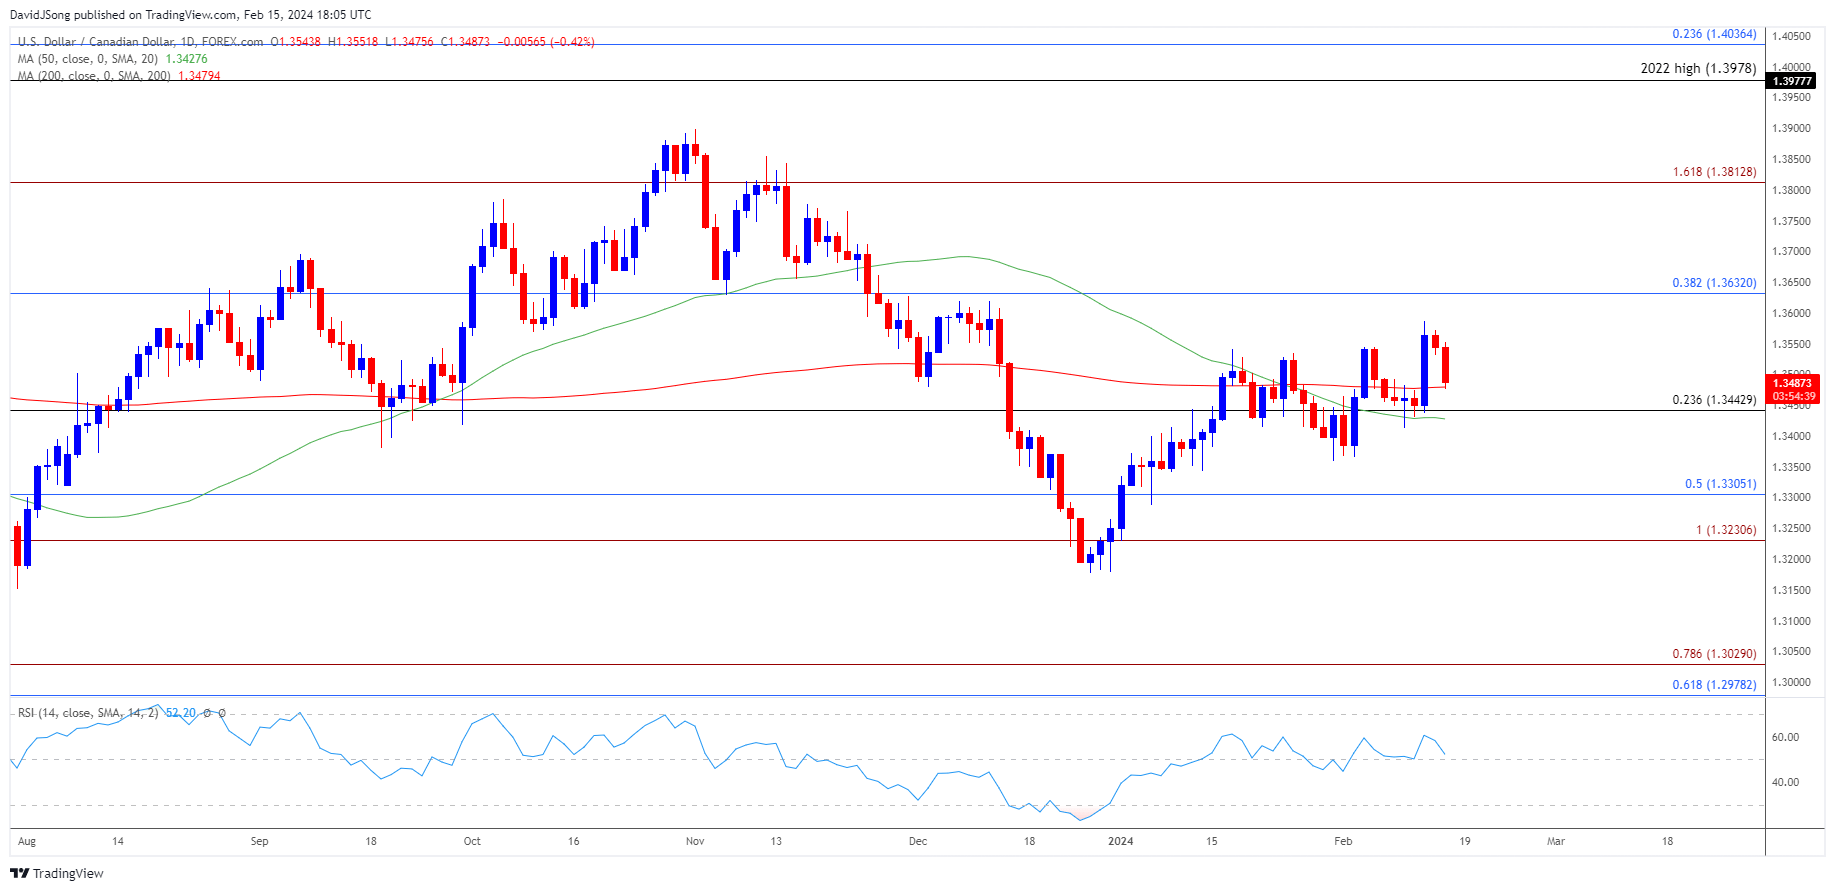
USD/CAD continues to pullback from a fresh monthly high (1.3586) amid a 0.8% decline in US Retail Sales, but the recent weakness in the exchange rate may end up short lived as it holds above the 50-Day SMA (1.3428).
USD/CAD Rate Susceptible to Flattening Slope in 50-Day SMA
Keep in mind, USD/CAD cleared the January high (1.3542) after failing to close below the moving average during the previous week, and the exchange rate may continue to trade within the broad range from the second half of 2023 as the indicator no longer reflects a negative slope.
Join David Song for the Weekly Fundamental Market Outlook webinar. David provides a market overview and takes questions in real-time. Register Here
Nevertheless, speculation surrounding monetary policy in the US and Canada may sway USD/CAD as the Federal Reserve and Bank of Canada (BoC) appear to be at the end of their hiking-cycle, and waning expectations for an imminent change in Fed policy may keep the exchange rate afloat as Chairman Jerome Powell rules out a rate cut in March.
The BoC may follow a similar path to its US counterpart as the ‘Governing Council wants to see further and sustained easing in core inflation,’ but the update to Canada’s Consumer Price Index (CPI) may push the central bank to switch gears sooner rather than later should the report show a slowdown in inflation.
Canada Economic Calendar

A downtick in both the headline and core CPI may curb the recent decline in USD/CAD as it encourages the BoC to alter the course for monetary policy, but another 3.4% reading for the core rate of inflation may generate a bullish reaction in the Canadian Dollar as it puts pressure on Governor Tiff Macklem and Co. to retain a restrictive policy.
With that said, USD/CAD may continue to trade within the broad range from the second half of 2023 as the BoC and Fed endorse a data dependent approach in managing monetary policy, and the exchange rate may stage further attempts to test the December high (1.3620) as it holds above the 50-Day SMA (1.3428).
USD/CAD Price Chart –Daily

Chart Prepared by David Song, Strategist; USD/CAD Price on TradingView
- USD/CAD cleared the January high (1.3542) after failing to close below the 50-Day SMA (1.3428), and the exchange rate may track the broad range from the second half of 2023 as the moving average no longer reflects a negative slope.
- USD/CAD may stage further attempts to test the December high (1.3620) as it holds above the moving average, with a break/close above 1.3630 (38.2% Fibonacci retracement) opening up 1.3810 (161.8% Fibonacci extension).
- However, failure to hold above 1.3440 (23.6% Fibonacci retracement) may push USD/CAD below the moving average, with a breach below the monthly low (1.3366) bringing the 1.3230 (100% Fibonacci extension) to 1.3310 (50% Fibonacci retracement) region on the radar, which sits just above the January low (1.3229).
Additional Market Outlooks
USD/JPY Post-US CPI Breakout Fails to Push RSI into Overbought Zone
US Dollar Forecast: EUR/USD Susceptible to Another Test of December Low
--- Written by David Song, Strategist
Follow on Twitter at @DavidJSong


