Canadian Dollar Outlook: USD/CAD
USD/CAD stages further attempts to trade above the 200-Day SMA (1.3450) as it carves a series of higher highs and lows, but data prints coming out of Canada may curb the recent advance in the exchange rate as the Consumer Price Index (CPI) is expected to increase in July.
USD/CAD Outlook: RSI Nearing Overbought Zone with Canada CPI on Tap
USD/CAD approaches the monthly high (1.3502) on the back of US Dollar strength, and the exchange rate may attempt to retrace the decline from the June high (1.3585) if it manages to close above the long-term moving average.
Join David Song for the Weekly Fundamental Market Outlook webinar. David provides a market overview and takes questions in real-time. Register Here
Canada Economic Calendar

However, the update to Canada’s CPI may sway USD/CAD as the headline reading is projected to increase to 3.0% in July from 2.8% per annum the month prior, and signs of persistent price growth may push the Bank of Canada (BoC) to pursue a more restrictive policy as ‘excess demand and elevated core inflation are both proving more persistent.’
As a result, Governor Tiff Macklem and Co. may vote for another 25bp rate-hike at their next meeting on September 6, but a softer-than-expected CPI print may produce headwinds for the Canadian Dollar as it encourages the BoC to pause its hiking-cycle.
Until then, speculation surrounding monetary policy in the US and Canada may influence USD/CAD as both central banks combat inflation, but it seems as though the exchange rate will stage further attempts to trade above the 200-Day SMA (1.3450) as it carves a series of higher highs and lows.
With that said, the update to Canada’s CPI may sway the near-term outlook for USD/CAD as the BoC keeps the door open to implement higher interest rates, but failure to close above the long-term moving average may undermine the recent advance in the exchange rate as the Relative Strength Index (RSI) seems to be flatten ahead of overbought territory.
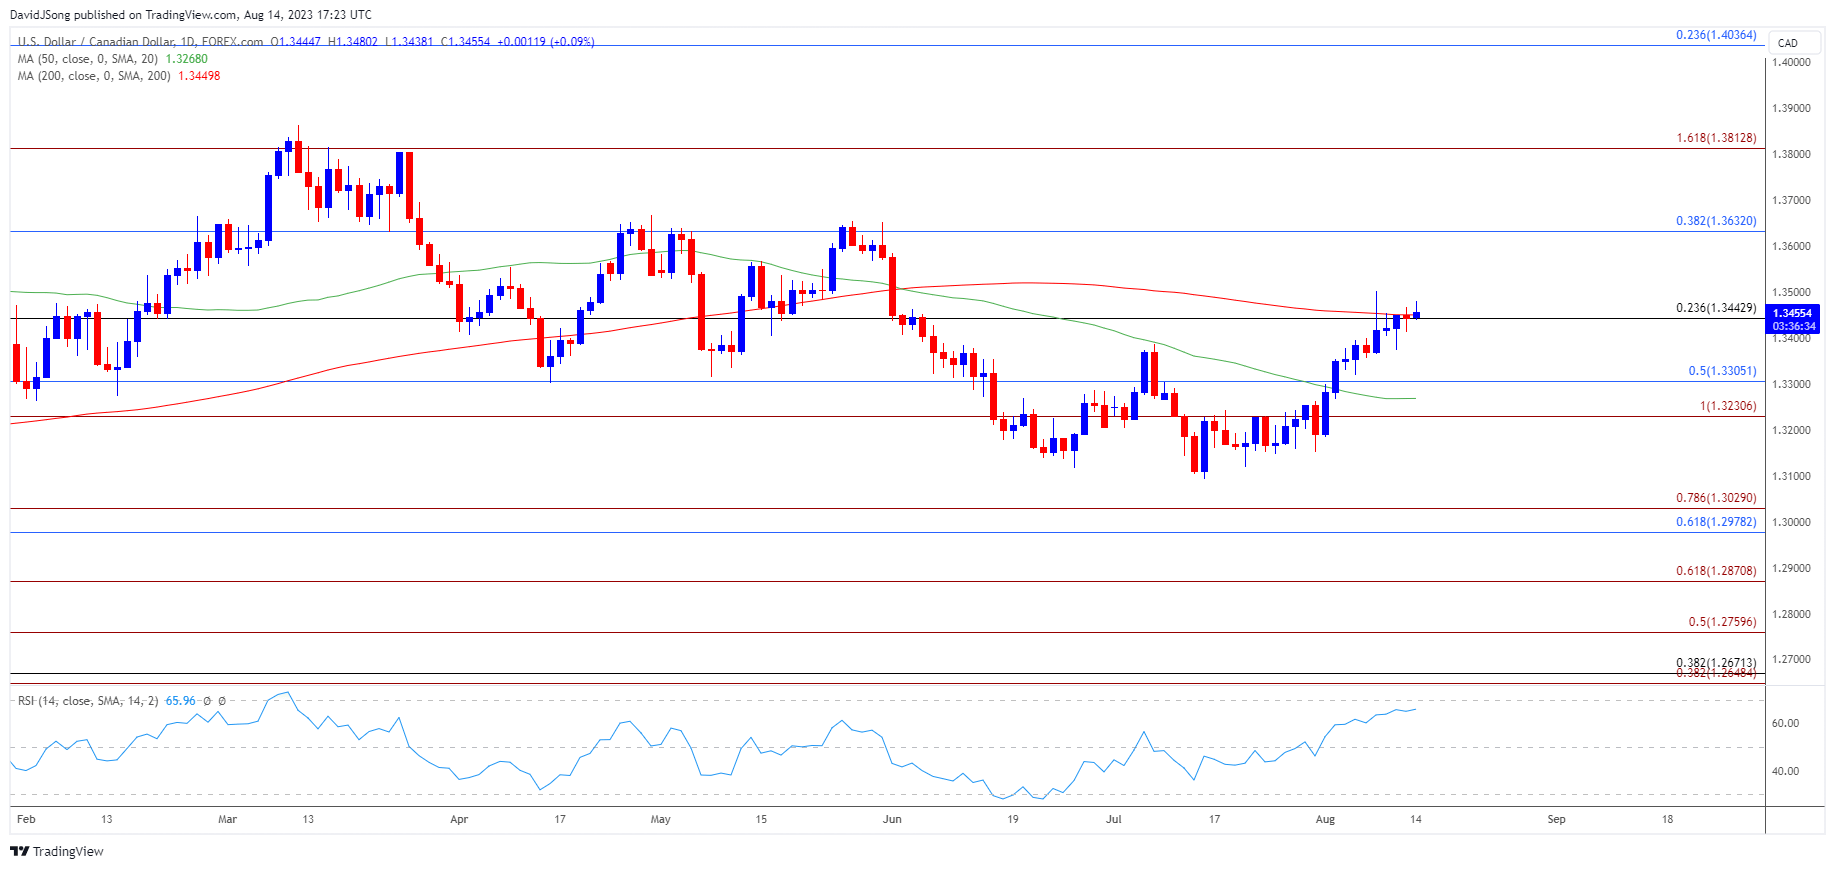
US Dollar Price Chart – USD/CAD Daily

Chart Prepared by David Song, Strategist; USD/CAD Price on TradingView
- USD/CAD approaches the monthly high (1.3502) as it attempts to trade above the 200-Day SMA (1.3450), with the recent rally in the exchange rate pushing the Relative Strength Index (RSI) towards overbought territory.
- A move above 70 in the RSI is likely to be accompanied by further rise in USD/CAD like the price action from earlier this year, with a break above the June high (1.3585) bringing 1.3630 (38.2% Fibonacci retracement) back on the radar.
- Next area of interest comes in around the May high (1.3655), but the lack of momentum to close above the long-term moving average may keep the RSI below 70, with a move/close below 1.3440 (23.6% Fibonacci retracement) bringing the 1.3230 (100% Fibonacci extension) to 1.3310 (50% Fibonacci retracement) area on the radar.
Additional Market Outlooks
USD/JPY Breaks Above Monthly Opening Range to Eye Yearly High
US Dollar Forecast: EUR/USD Clears August Opening Range
--- Written by David Song, Strategist
Follow on Twitter at @DavidJSong


