USD/CAD Outlook
USD/CAD approaches the 50-Day SMA (1.3396) following a larger-than-expected rise in the US ISM Services index, and data prints coming out of the US and Canada may continue to influence the exchange rate as both the Federal Reserve and Bank of Canada (BoC) continue to combat inflation.
USD/CAD Climbs Above Former Support to Eye 50-Day SMA
USD/CAD trades back above the former support zone around the April low (1.3301) after showing a limited reaction to the Federal Open Market Committee (FOMC) Minutes, and the exchange rate may stay afloat ahead of the BoC rate decision on July 12 as the US Non-Farm Payrolls (NFP) report is anticipated to show another rise in employment.
Join David Song for the Weekly Fundamental Market Outlook webinar. Register Here

The US economy is projected to add 225k jobs in June while the Unemployment Rate is expected to narrow to 3.6% from 3.7% the month prior, and a positive development may generate a bullish reaction in the Greenback as it raises the Fed’s scope to pursue a more restrictive policy.
It seems as though the Federal Open Market Committee (FOMC) will take further steps to combat inflation as ‘almost all participants noted that in their economic projections that they judged that additional increases in the target federal funds rate during 2023 would be appropriate,’ and the central bank may continue to strike a hawkish forward guidance at the next rate decision on July 26 as Chairman Jerome Powell and Co. forecast a steeper path for US interest rates.

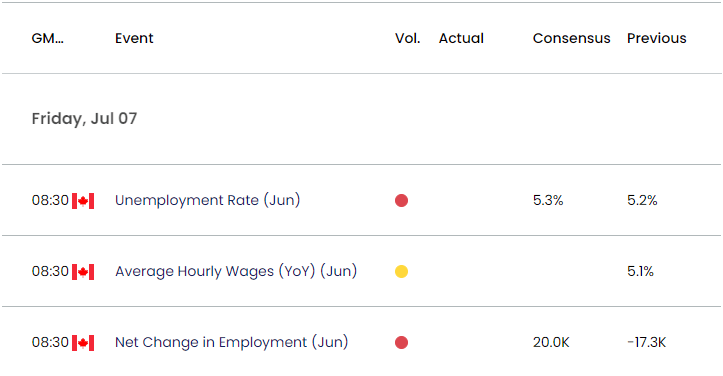
Until then, market participants may prepare for the BoC meeting as Canada’s Employment report is anticipated to show a rebound in job growth, and a material improvement in the labor market may encourage Governor Tiff Macklem and Co. to implement higher interest rates as the ‘rebalancing of supply and demand was likely to take longer than previously expected.’
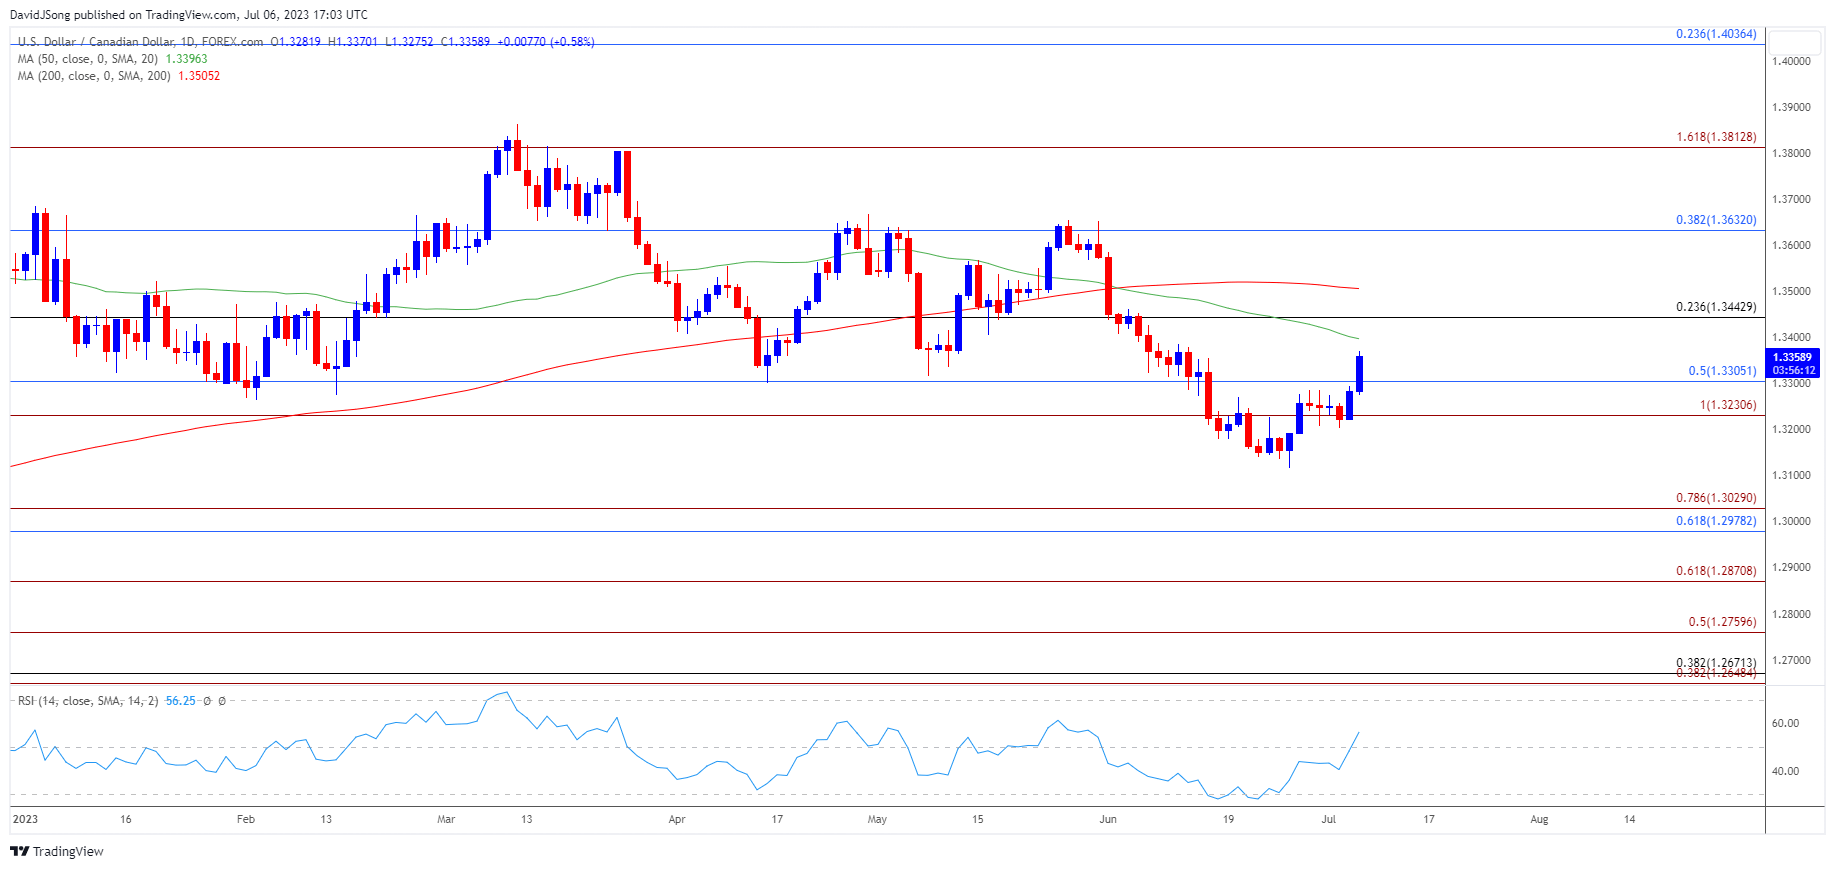
With that said, data prints coming out of the US and Canada may influence USD/CAD as both the FOMC and BoC continue to combat inflation, but the exchange rate may attempt to test the 50-Day SMA (1.3396) as it trades back above the former support zone around the April low (1.3301).
Canadian Dollar Price Chart – USD/CAD Daily

Chart Prepared by David Song, Strategist; USD/CAD Price on TradingView
- USD/CAD carves a series of higher highs and lows as it extends the rebound from the weekly low (1.3203), with the exchange rate approaching the 50-Day SMA (1.3396) as it climbs above the former-support zone around the 1.3230 (100% Fibonacci extension) to 1.3310 (50% Fibonacci retracement) region.
- A move above the moving average may push USD/CAD towards 1.3440 (23.6% Fibonacci retracement), with a break above the June high (1.3585) opening up 1.3630 (38.2% Fibonacci retracement).
- However, USD/CAD may respond to the negative slope in the moving average as it failed to defend the February low (1.3263) during the previous month, with a move below the 1.3230 (100% Fibonacci extension) to 1.3310 (50% Fibonacci retracement) region raising the scope for a test of the June low (1.3117).
Additional Market Outlooks
Gold Price Stalls Again at Former Support Zone
EUR/USD Outlook: Pay Attention to July Opening Range
--- Written by David Song, Strategist
Follow on Twitter at @DavidJSong


