USD/CAD, Canadian Dollar Talking Points:
- Tomorrow brings employment reports out of both the US and Canada at 8:30 AM ET. This can make for especially volatile conditions in the USD/CAD pair around that time, and caution is warranted.
- USD/CAD has posed a bullish breakout this week, rising out of a falling wedge pattern that had built last month. Today saw sellers attempting to push a pullback, but support has since held at a key Fibonacci level, setting the table for tomorrow’s data outlay.
- I’ll be discussing these themes in-depth in the weekly webinar on Tuesday at 1PM ET. It’s free for all to register: Click here to register.
It was a brisk two days in USD/CAD as the pair continued its bullish breakout from the falling wedge pattern.
I had started to highlight that formation in the webinar ahead of the FOMC rate decision. At the time, we only had a stall in the bearish trend in USD/CAD, but that stall had held for more than a month as can be seen on the below weekly chart of the pair. There were multiple tests below 1.3150 but sellers were unable to close the deal, and this allowed for trendline support to come into the picture to help give a boost to bulls.
I’ve added a blue box on the below chart that shows seven consecutive weeks of support holding at that area, which allowed for the falling wedge formation to build.
USD/CAD Weekly Price Chart
 Chart prepared by James Stanley, USD/CAD on Tradingview
USD/CAD: False Break After BoC
It was the month of June that the Bank of Canada caught the world by surprise. Markets weren’t expecting a hike from the BoC but that’s what we got. And at the same time, US markets were preparing for the Fed to skip any hikes at the June meeting for the first time since this rising rate cycle had begun.
This created discontinuity in the pair, as hawkishness needed to get priced around the BoC (and into the CAD) and dovishness around the Fed (and into the USD) based on Central Bank expectations.
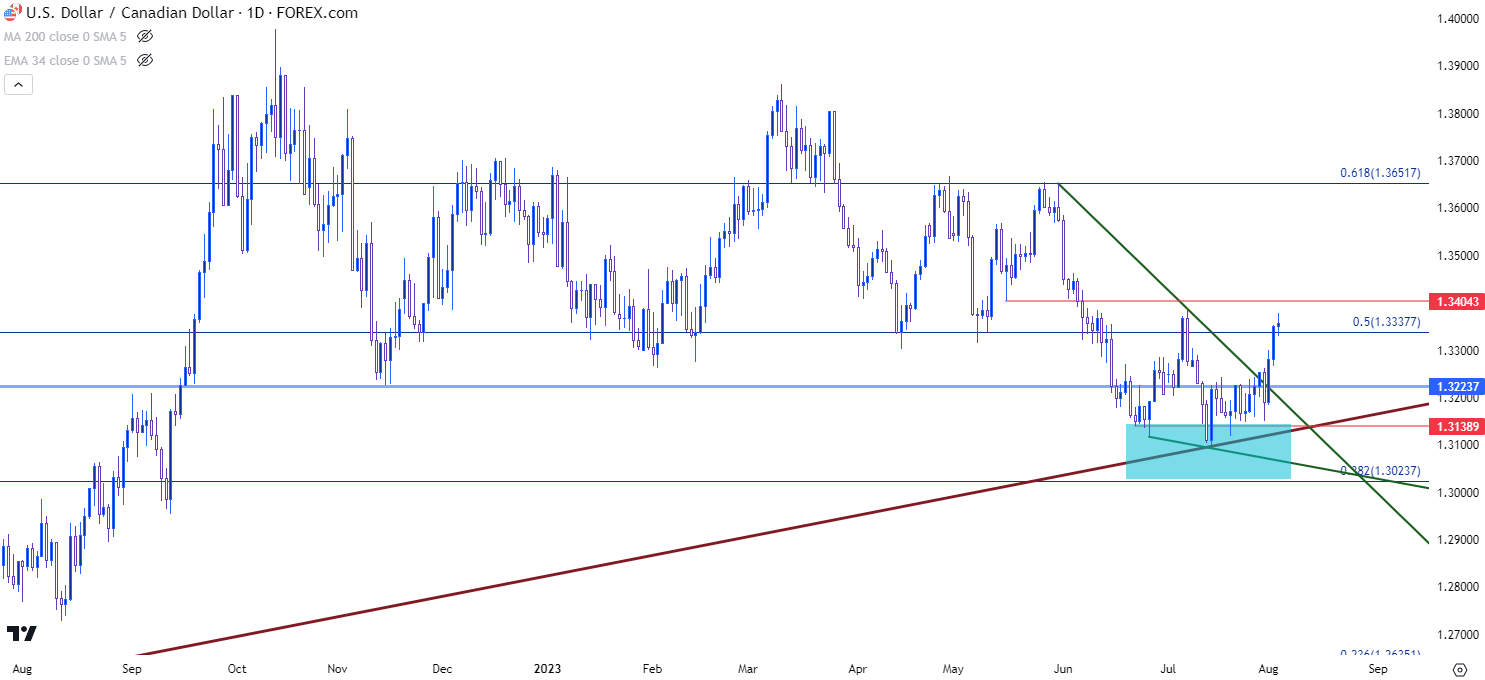
This led to a bearish breach of the range in USD/CAD that had held for a few months prior, and sellers went on the attack, eventually taking out supports at 1.3338, 1.3223 and eventually finding support around 1.3139. And that’s around the time that the trend began to stall.
It was after US CPI in July that sellers took another shot but this time, they ran into a bullish trendline, shown in maroon on the below and above chart. That trendline helped to set the low and prices quickly pulled back but were still unable to make much ground higher.
The stall at support with an assist from the longer-term trendline is what helped the falling wedge to build, and as we’ve seen a bit of USD-strength enter the picture this has helped the pair to continue to reverse out of that formation.
USD/CAD Daily Price Chart
 Chart prepared by James Stanley, USD/CAD on Tradingview
USD/CAD Short-Term Ahead of NFP, CAD Jobs
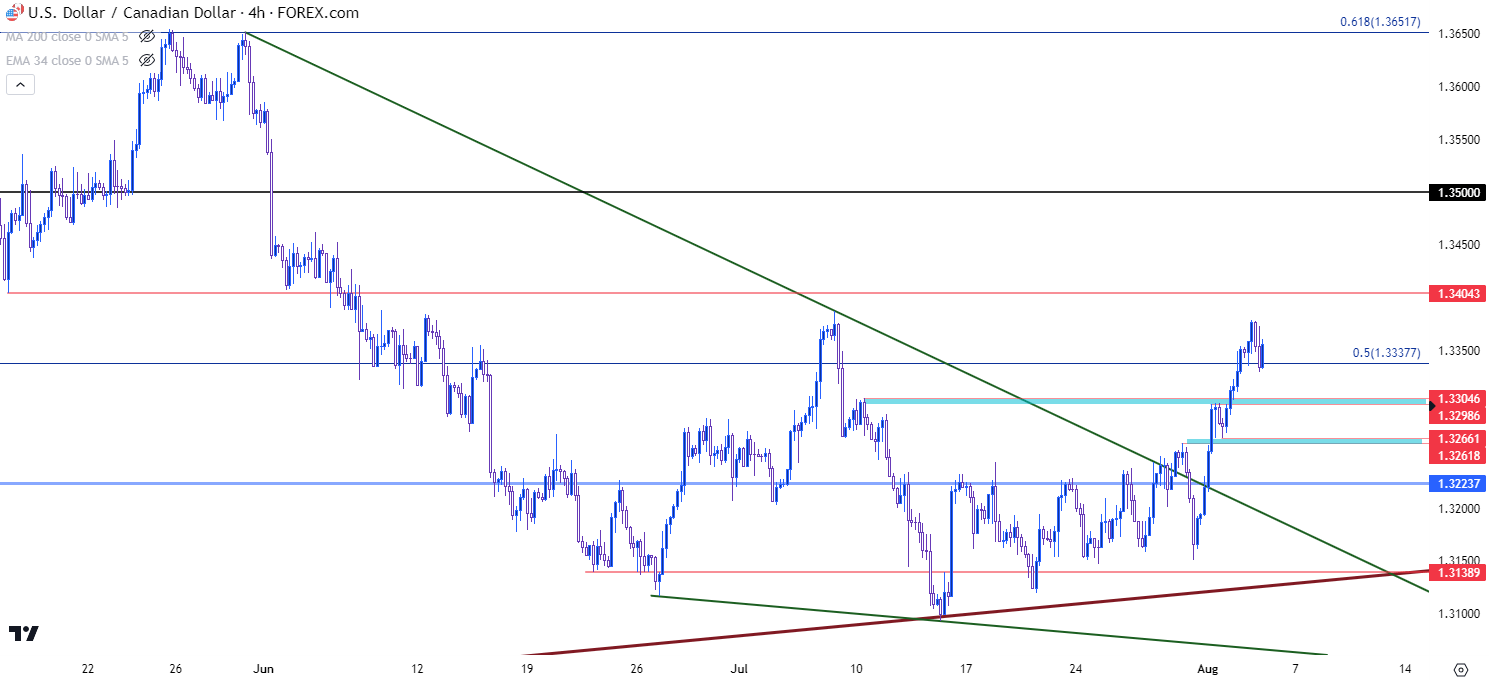
At this point, from a short-term basis, USD/CAD has shown bullish breakout after resolving that falling wedge formation, but there hasn’t yet been much for pullback in this move. The familiar level at 1.3338 has come back into the picture, however, with an assist as short-term support.
Given the fact that we’re going to have two high-impact prints releasing at 8:30 AM ET tomorrow morning, we should entertain a wider outlay of possible scenarios, and in USD/CAD, this could be ample opportunity for bulls to show their hands if a pullback does develop. I’m tracking three support zones on the below chart, around the 1.3300 handle followed by a spot around 1.3262 and then the final at that 1.3224 level.
If tomorrow’s daily close is below that latter level, the prospect of bullish reversal won’t look as attractive as the weekly bar would be left with an exposed upper wick. If bulls can hold the line, however, there could remain bullish continuation potential with next resistance at 1.3404, followed by 1.3500 and then another familiar price, around the Fibonacci level at 1.3652.
USD/CAD Four-Hour Price Chart

Chart prepared by James Stanley, USD/CAD on Tradingview
--- written by James Stanley, Senior Strategist


