USD/CAD Talking points:
- The next two days bring headline risk for USD/CAD, with Chair Powell’s testimony in front of the Senate today and the House Financial Services Committee tomorrow. Also on tomorrow’s economic calendar is the Bank of Canada’s March rate decision at 10 AM ET.
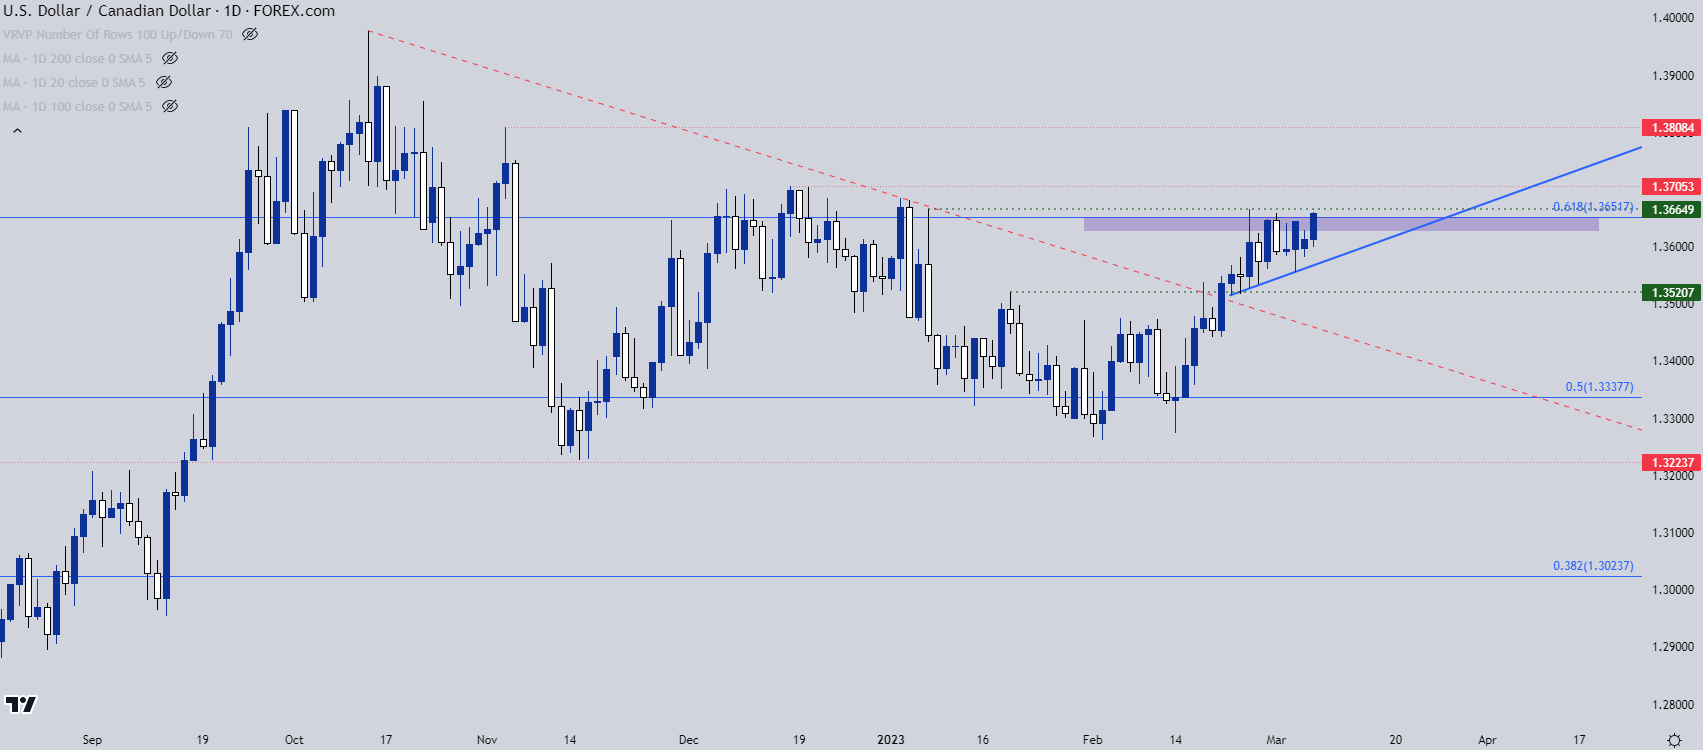
- USD/CAD price action is currently showing an ascending triangle formation with resistance at a key Fibonacci level.
- I’ll be addressing each of these markets in next week’s price action webinar, set for Tuesday at 1PM ET. If you’d like to sign up, this link will allow for registration.
USD/CAD is testing a breakout at a key level and the economic calendar for the next two days is loaded with headline risk. Chair Powell testifies in front of the Senate Finance Committee today as part of the Fed’s twice-annual Humphrey Hawkins testimony. Tomorrow he’ll testify in front of the House Financial Services Committee, and this will begin at 10 AM ET, right at the same time as the Bank of Canada’s March rate decision.
Price action has been of interest in the USD/CAD pair as Canadian Dollar weakness helps the pair to retain a bullish bias, as taken from an ascending triangle formation on the daily chart. Resistance is at a key area, around 1.3652 which is the 61.8% Fibonacci retracement of the 2021-2022 major move. That price held the high over the past two weeks and buyers are already testing it again this week.
USD/CAD Weekly Price Chart
 Chart prepared by James Stanley, USD/CAD on Tradingview
From the daily chart below, we can get better view of the ascending triangle. Such formations are often approached with the aim of bullish breakouts, hypothesizing that the behavior that’s brought bulls in at higher lows can eventually lead to a break above horizontal resistance.
The current two-month-high in the pair plots just above that Fibonacci level, at 1.3665, and a breach of that level opens the door for a move up to next resistance at 1.3705 after which 1.3808 comes into view. A breach of the bullish trendline negates the formation and exposes support around the 1.3521 level that had come into play in mid-February.
USD/CAD Daily Price Chart
 Chart prepared by James Stanley, USD/CAD on Tradingview
--- written by James Stanley, Senior Strategist
Follow James on Twitter @JStanleyFX


