
US Dollar Talking Points:
- The US Dollar continued to show strength for this week even as the currency encountered multiple items of resistance, setting a fresh two-month-high along the way.
- The more notable observation has been how bulls have responded to support, similar to what had shown in the prior week around the CPI print. For this week, it was defense of support at prior resistance of 102.85-103.00 that helped the USD to retain strength. The focus shifts to the Jackson Hole Economic Symposium for next week.
- I’ll be discussing these themes in-depth in the weekly webinar on Tuesday at 1PM ET. It’s free for all to register: Click here to register.
It was another week of strength in the US Dollar as the currency continued its breakout from the longer-term falling wedge pattern. The big driver for this week was the retail sales report that was issued on Tuesday, and this showed at a 3.17% annualized number against a 1.5% expectation. That further pushed up projections for GDP as the GDPNow model from the Atlanta Fed is showing a 5.8% estimate. This is far beyond the prior forecast and further illustrates strength in the American economy – and this is something that the Fed may not be able to ignore as they prepare for the September rate decision.
Before we get to that, however, we have a major even on the calendar for next week and that’s the Jackson Hole Economic Symposium. The ‘who’s who’ of global central bankers will descend upon Jackson Hole, Wyoming to discuss issues in global central banking. Last year this event loomed large as equity rallies in the summer were brought to heel when Chair Powell made a hawkish proclamation on Friday, August 26th that the Fed was not yet done with rate hikes.
A year later and it seems that they still may not be done with rate hikes. But that hasn’t stopped market participants from riding the hope trade, as can be seen in the equity rally off of the March lows which was largely pushed by the hope that the Fed may soften their stance as US regional banks started to show pressure.
The US Dollar had set a high at 105.88 before that theme began to price in and as markets began to price in possible cuts from the Fed, the US Dollar dropped as stocks surged. As US economic data has retained strength, we’ve started to see USD bulls come back into the picture over the past month and that can be seen clearly on the below chart after the DXY bottomed a month ago.
US Dollar - DXY Daily Price Chart (indicative only, not available on Forex.com platforms)
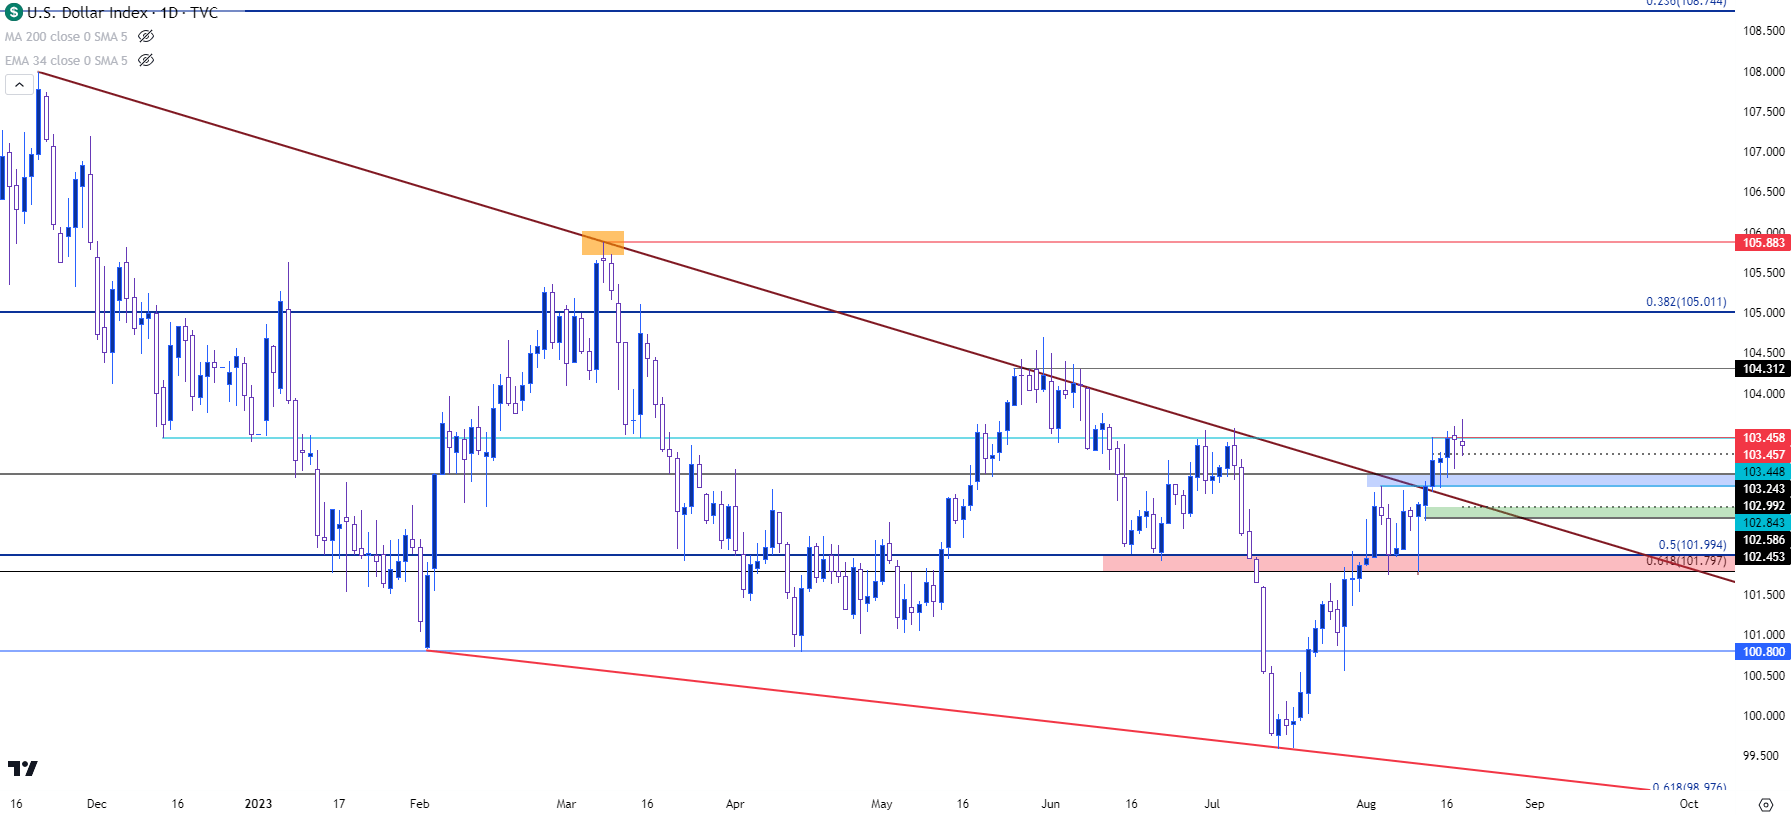
Chart prepared by James Stanley; data derived from Tradingview
USD Shorter-Term
Probably the more impressive part of the rally so far has been how bulls have defended support in the DXY of late. Earlier in the month, there was the support response after below-expectation CPI prints, which is pretty much the opposite of what one would’ve expected. This took place at 101.80-102.00 and I had talked about it in the article published that day.
But then this week showed another such instance, as the fresh breakout began to pullback in the early-portion of this week, but bulls again showed a strong response to support in the 102.85-103.00 area, which has helped to keep the bullish breakout running with a fresh two-month-high printing on Friday morning.
Higher-low support has held around 103.25 so the door remains open for bulls, but there’s also the chance for a deeper pullback before the bigger picture bullish trend is ready for resumption. From the four-hour chart below we can see a rising wedge formation coming into play as the pace of higher-lows has been a bit more brisk than what’s shown at higher-highs.
This keeps support potential at 102.85-103.00 in the picture, and if prices can force a deeper pullback in the early portion of next week, there’s even a claim for deeper support potential around the 102.45-102.59 area, which is confluent with the bearish trendline that’s held multiple inflection so far this year in the DXY.
US Dollar - DXY Four-Hour Price Chart (indicative only, not available on Forex.com platforms)
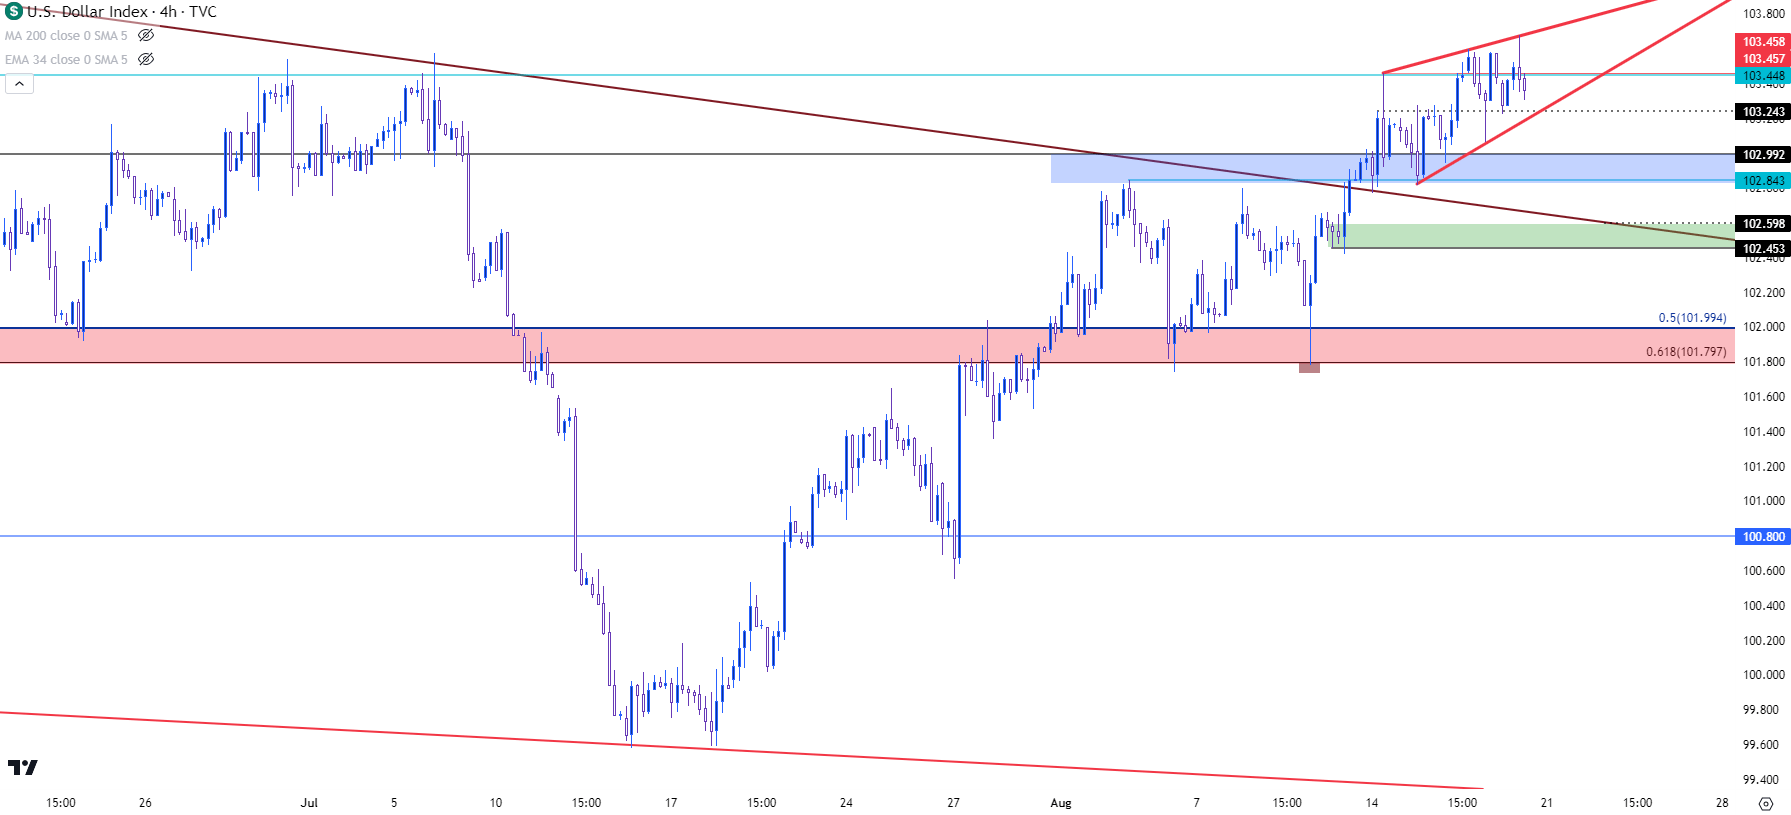
Chart prepared by James Stanley; data derived from Tradingview
EUR/USD
The Euro is a whopping 57.6% of the DXY quote so going along with that recent theme of strength in the US Dollar has been a general show of weakness in the Euro. The shift there started to take hole in July after EUR/USD reversed from the Fibonacci level at 1.1275. EUR/USD has sold off each week since and more recently the 1.0943 Fibonacci level, which is the 50% mark of the same move from which the 61.8% level showed at 1.1275, has acted as a hindrance to bearish continuation scenarios.
But Friday finally showed a support test at the 1.0845 level that I’ve been talking about and as we approach the close of the week, that level remains as the weekly low. While this does keep the pair in a bearish spot as denoted by a lower-low to go along with recent lower-highs, the fact that sellers remained so tepid over the past week is notable, and this urges caution from chasing as that support at 1.0845 has come into play.
For next week, the big question is whether sellers can hold resistance below 1.0943 or, perhaps more to the point, below the 1.1000 psychological level.
While the answer to that quandary will likely take a toll on directional themes in the USD, for USD bulls there may be more amenable pastures elsewhere, such as the USD/CAD breakout that’s continued to run. And for USD bears, there may be a more accommodating backdrop showing in GBP/USD for those themes to play out.
EUR/USD Daily Price Chart
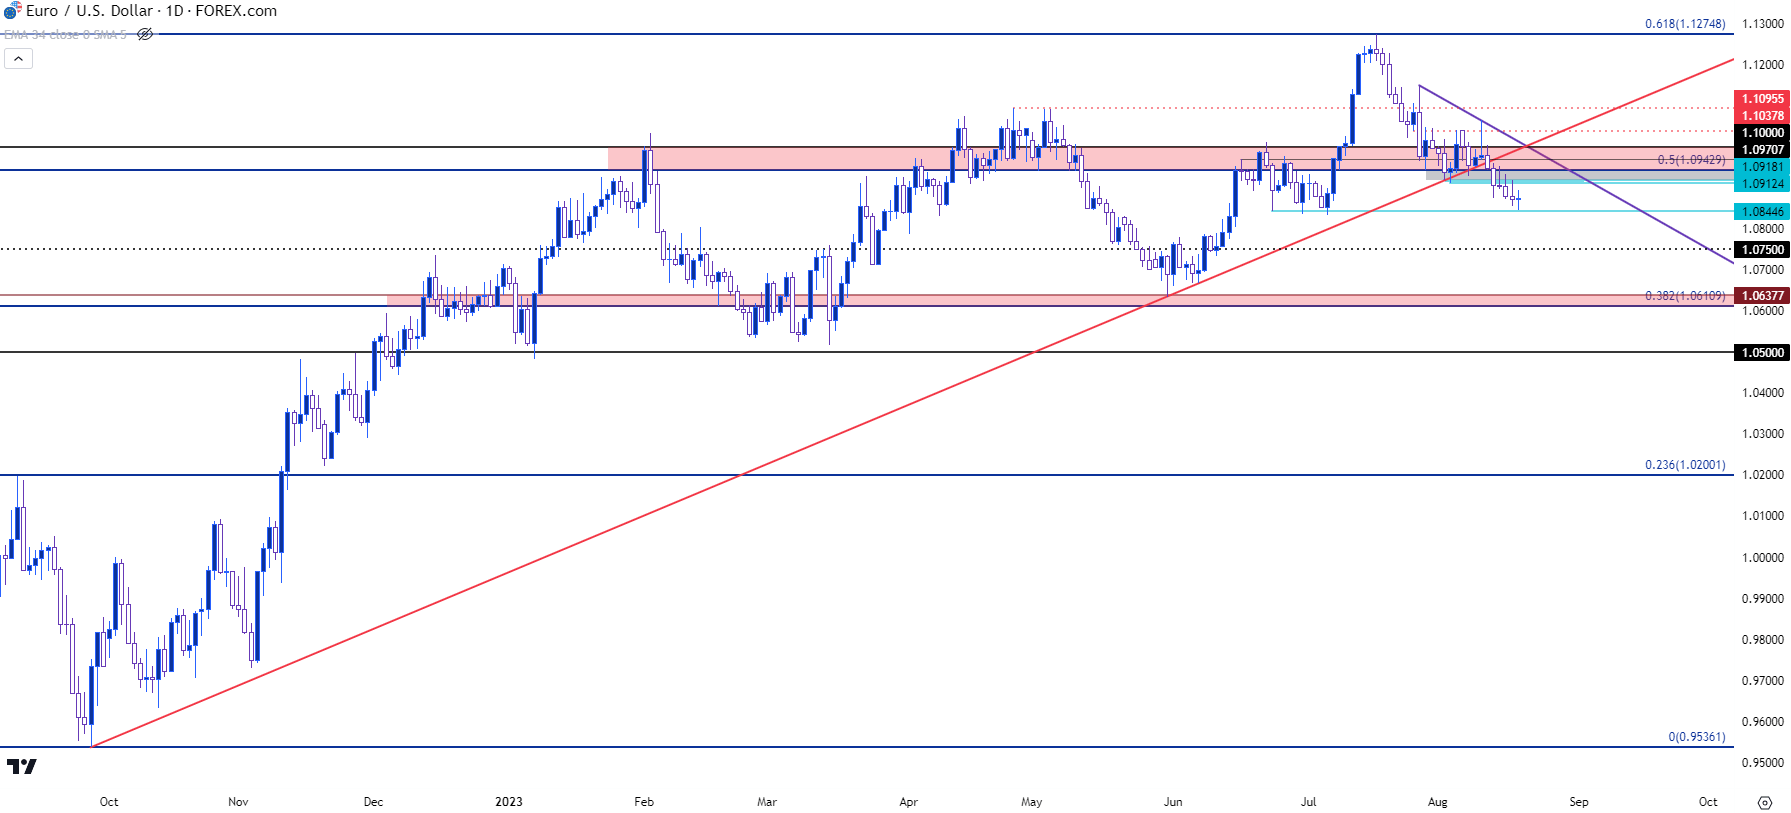
Chart prepared by James Stanley, EUR/USD on Tradingview
GBP/USD
The US Dollar had a strong week, but GBP had a stronger outing as evidenced by the bullish weekly bar in the GBP/USD pair. I had talked about this in the Tuesday webinar, sharing the opinion that GBP/USD was one of the more attractive majors for scenarios of USD-weakness; and even though we didn’t get the USD weakness we did see a greater show of strength from the British Pound.
The 1.2667 level remains key and despite being tested through on Monday, bears couldn’t complete a daily close below that level and price remained above that spot for the rest of the week. As this was happening, a falling wedge formation formed and there was even an attempt to push out of that in the latter portion of the week. This could keep the pair as one of the more enticing major markets for bearish scenarios in the US Dollar.
For resistance potential, the 1.2800 and 1.2850 levels sit nearby overhead, but it’s the 1.3000 psychological level that looms large, after which the 1.3150 swing comes into the picture as it’s the current two-year-high in GBP/USD.
GBP/USD Daily Price Chart
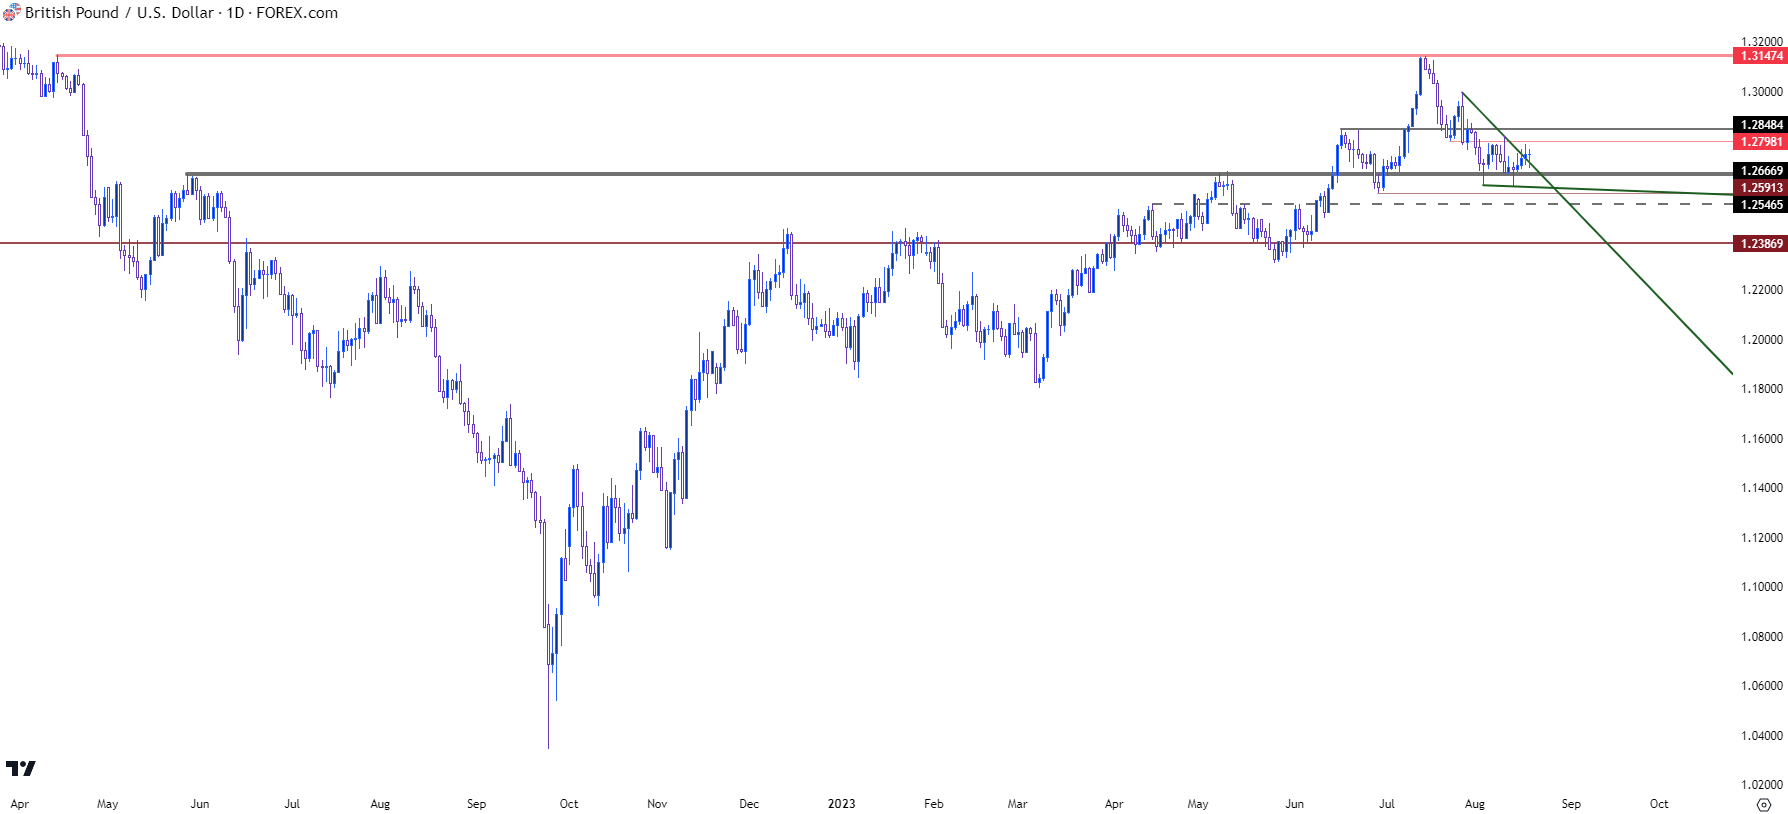
Chart prepared by James Stanley, GBP/USD on Tradingview
USD/CAD
While GBP/USD may be one of the more attractive setups for scenarios of USD-weakness, the opposite can be said about USD/CAD for themes of USD-strength. I wrote about the pair on Wednesday as I highlighted bullish continuation potential and USD/CAD put on a strong showing after that by holding support at a prior spot of resistance at 1.3500, and then extending the move up to the next spot of resistance at 1.3568.
The move has been grinding over the past week and that highlights overbought concerns; but there’s no sign of bulls relenting just yet so support potential can remain at that 1.3500 level to allow for bullish continuation scenarios. The next spot of resistance overhead is the Fibonacci level at 1.3652, which was the last spot of resistance in late-May just before the breakdown began to show in June.
USD/CAD Four-Hour Price Chart
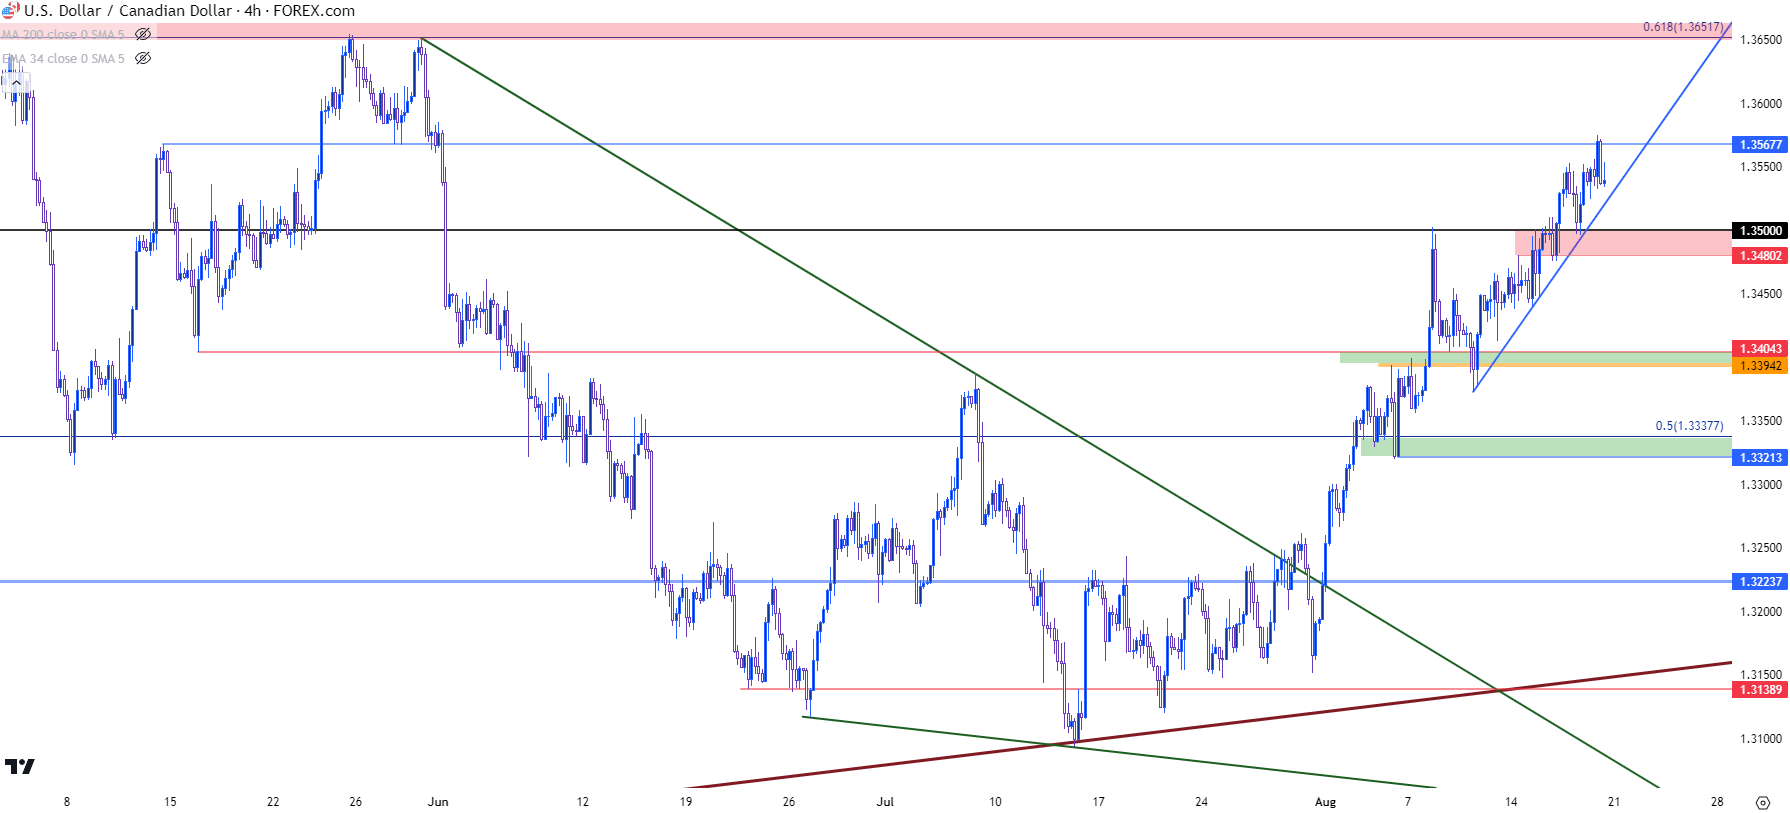
Chart prepared by James Stanley, USD/CAD on Tradingview
--- written by James Stanley, Senior Strategist


