
US Dollar Talking Points:
- The US Dollar has put in a breakout of the falling wedge formation and the fact that this happened after last week’s CPI report printed below expectations makes the move all the more interesting. This is also the opposite theme of what I had talked about in July just after the US Dollar broke down to a fresh yearly low. The question now is one of continuation and for that to happen bulls need to show higher-low support to allow for the breakout to turn into a workable trend.
- In the webinar, I had remarked that GBP/USD holding a key spot of support could make that one of the more compelling backdrops for scenarios of USD-weakness, while USD/CHF could be one of the more compelling scenarios for USD-strength.
- I’ll be discussing these themes in-depth in the weekly webinar on Tuesday at 1PM ET. It’s free for all to register: Click here to register.
The US Dollar put in a strong breakout last week that extended into this week as bulls pushed beyond the resistance side of a falling wedge pattern. Follow through resistance has since shown at 103.45 and that’s held the highs so far, but much as I had looked at last month after the breakdown to fresh yearly lows, the big question is whether the break can turn into a trend. And for that, we’ll need to see bulls come in to support higher-lows or else price can push right back into that prior spot of consolidation while showing the topside move as a false breakout to the upside.
At this point, support has shown in an area of prior resistance, running from 102.85 up to the 103 handle.
US Dollar - DXY Daily Price Chart (indicative only, not available on Forex.com platforms)
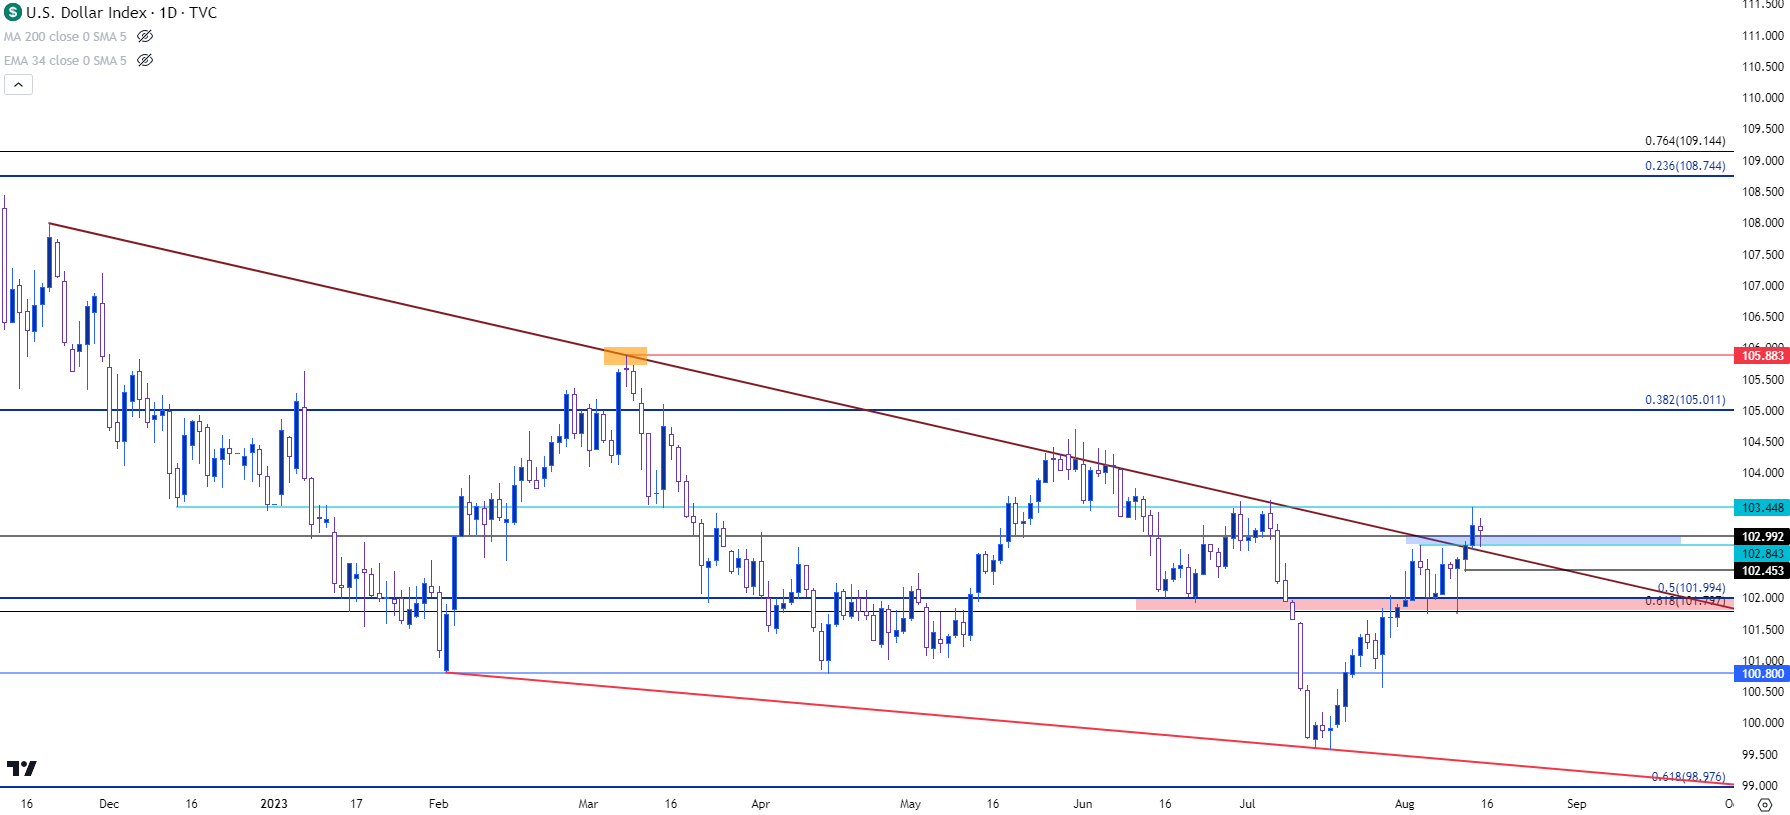
Chart prepared by James Stanley; data derived from Tradingview
USD Sentiment Shift
The CPI report that came out last Thursday would seemingly be supportive of USD bears as both core and headline CPI printed below the expectation.
When that happened in July – that triggered an aggressive downside breakout in the US Dollar. But, when it happened last Thursday the selling was relegated to about 90 seconds – until support came into play at 101.80. That then led to strength for the rest of the day, allowing for a hammer formation to build. And then on Friday, price began to test the trendline that sits atop the falling wedge and this is a trendline that’s held numerous tests, including about two weeks’ worth of tests in May and June when there was not a single daily close above that level.
When it came into play in July, it was a brief touch before sellers went on the attack and that eventually led to the breakdown move after CPI in July. But Friday saw bulls push the first daily close above that trendline since it came into the picture and yesterday saw brisk continuation beyond that level, furthering the breakout and opening the door to bullish trend potential.
From today’s daily chart, price has since held a key zone of support at prior resistance. The next resistance objective remains at 103.45 and after that it’s quite messy until the 105 level comes into the picture. I’m also going to add 104.31 as this was a spot that was in-play in May, although it wasn’t a clean touch there as this was around the spot on the chart that the trendline was holding the highs.
US Dollar - DXY Daily Price Chart (indicative only, not available on Forex.com platforms)
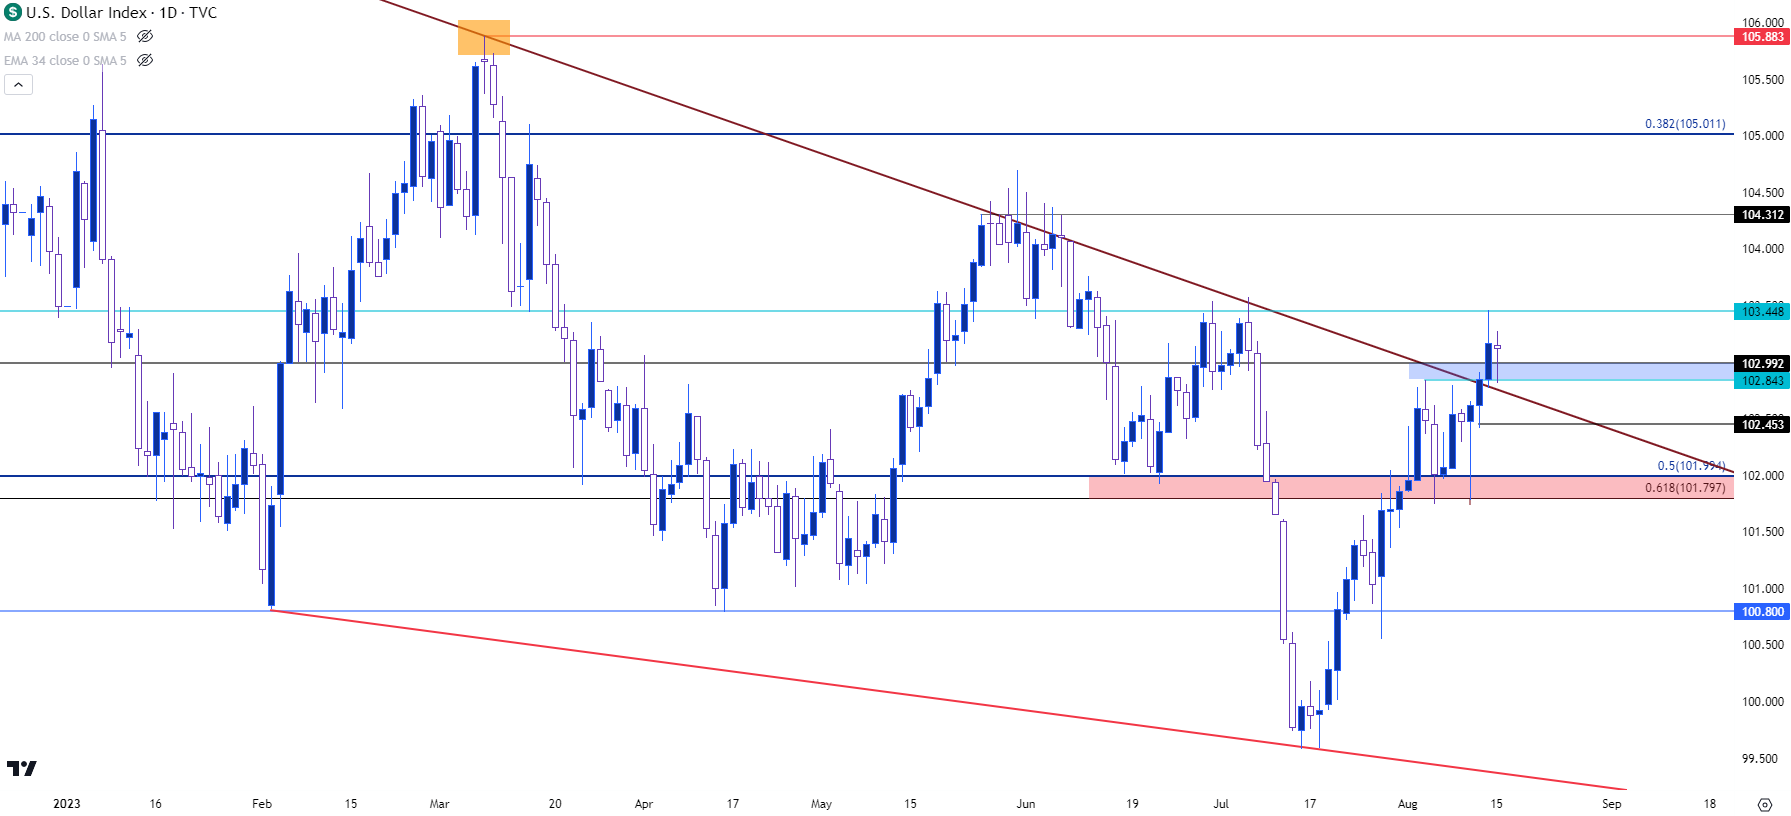
Chart prepared by James Stanley; data derived from Tradingview
EUR/USD
I had looked into the Euro and EUR/USD in-depth in yesterday’s article, and this theme still seems to have some tie with the above in the USD.
From the daily chart below, we can see EUR/USD trading below a trendline that connects last September’s low to the swing low from this May. That trendline has been in-play ever since 1.0943 started to come back into the picture and that level is key as it’s the 50% mark from the same retracement series from which the 61.8% level caught the high in July (at 1.1275).
Bears have an open door here as price is sitting very near a fresh low and there’s already been a resistance inflection at the 1.0943 level that was prior support.
EUR/USD Daily Price Chart
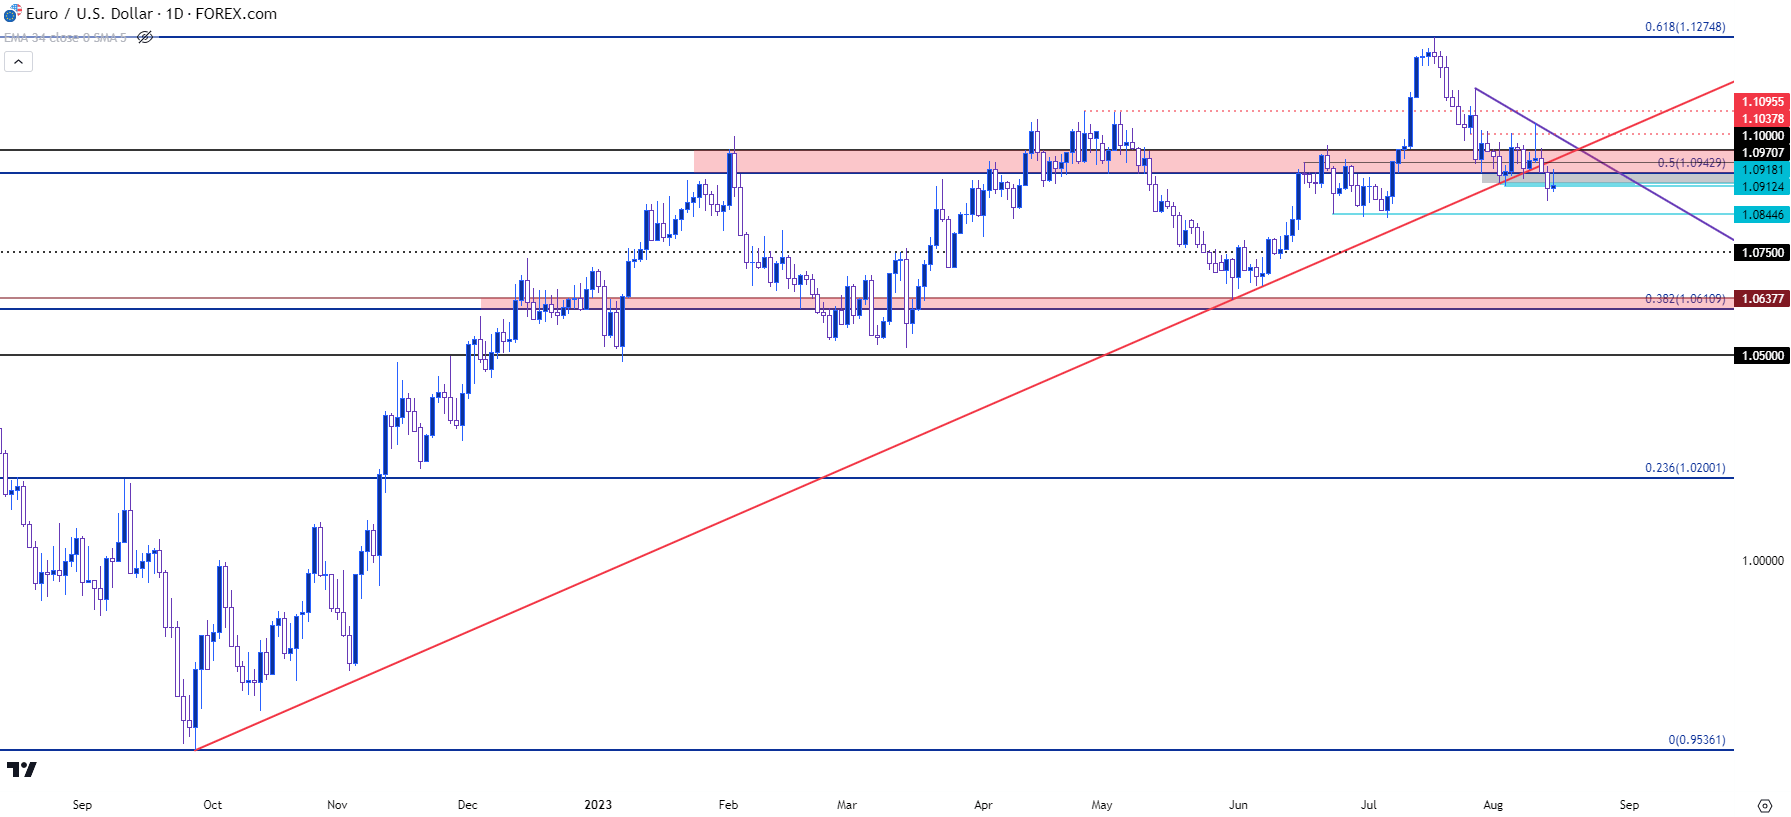
Chart prepared by James Stanley, EUR/USD on Tradingview
EUR/USD Shorter-Term
The complication on a shorter-term basis would be the fact that bears have an open door but haven’t yet walked through it. This doesn’t necessarily preclude bearish continuation or bearish trends, but it does urge caution from pushing until more evidence is seen. From the four-hour chart below we can see a resistance hold at 1.0943 which keeps that door open. But, if bears fail to push a fresh low below 1.0875, then there’s potential for a deeper pullback and this highlights resistance potential around 1.0971 and then the 1.1000 psychological level.
EUR/USD Four-Hour Price Chart
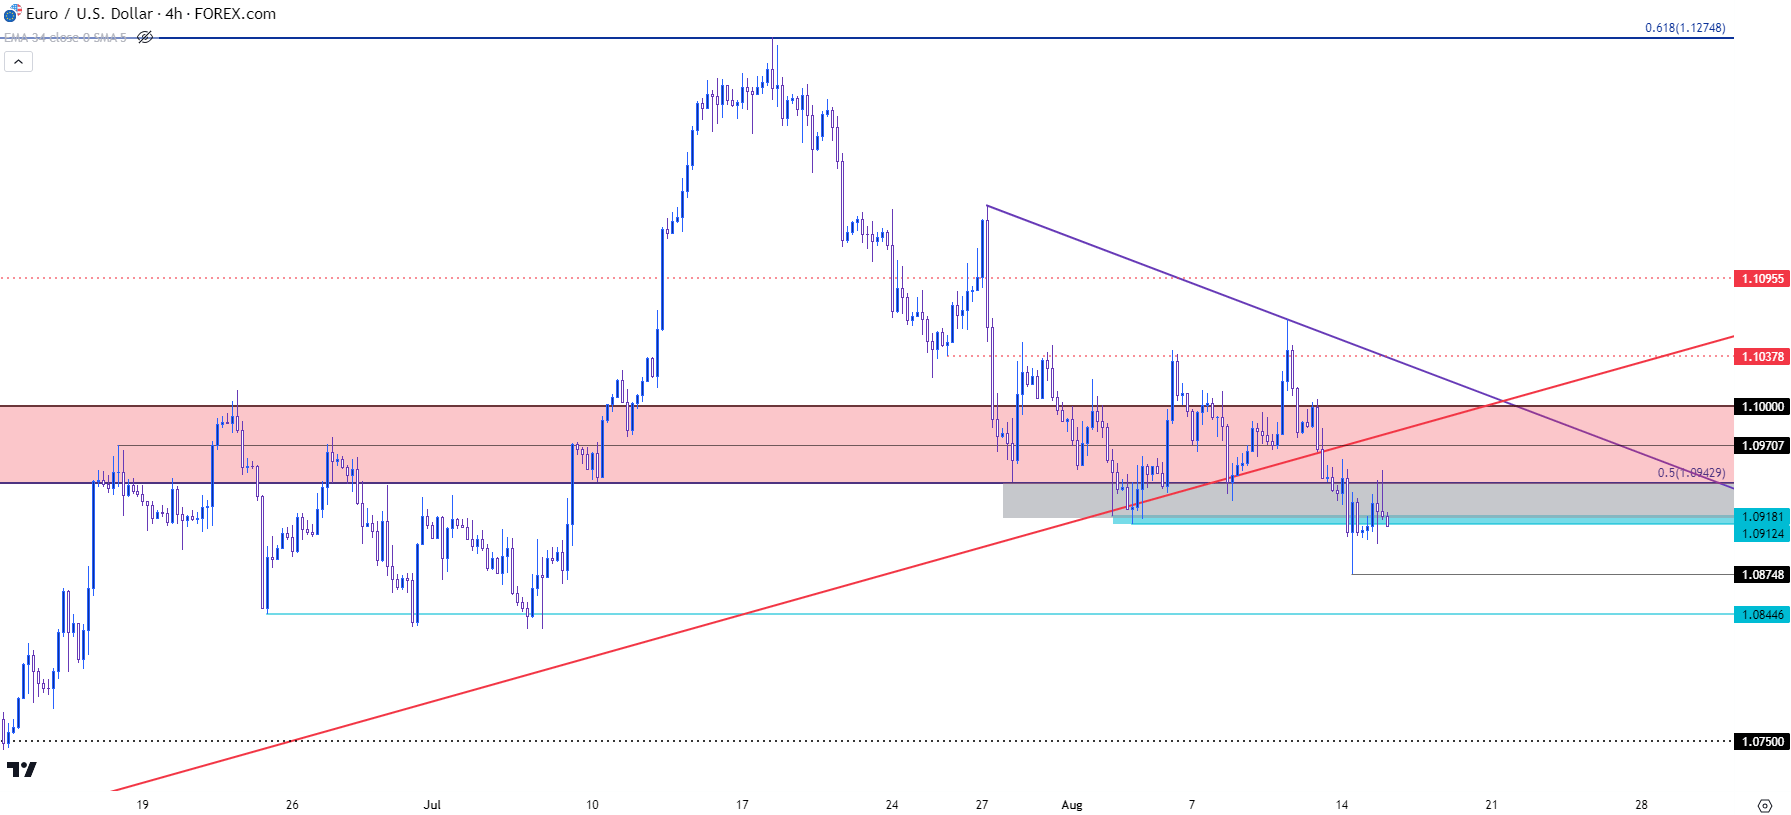
Chart prepared by James Stanley, EUR/USD on Tradingview
GBP/USD
Cable is still holding support at that 1.2667 level that I had looked at last week and given the fundamental backdrop of the UK against the US, this would seem an area where there could be an argument for bullish scenarios in the pair. Inflation remains well-elevated in the UK, beyond what’s showing in the US at the moment, and this combined with the support hold at a key spot can keep GBP/USD as one of the more attractive backdrops for scenarios of USD-weakness.
GBP/USD Daily Price Chart
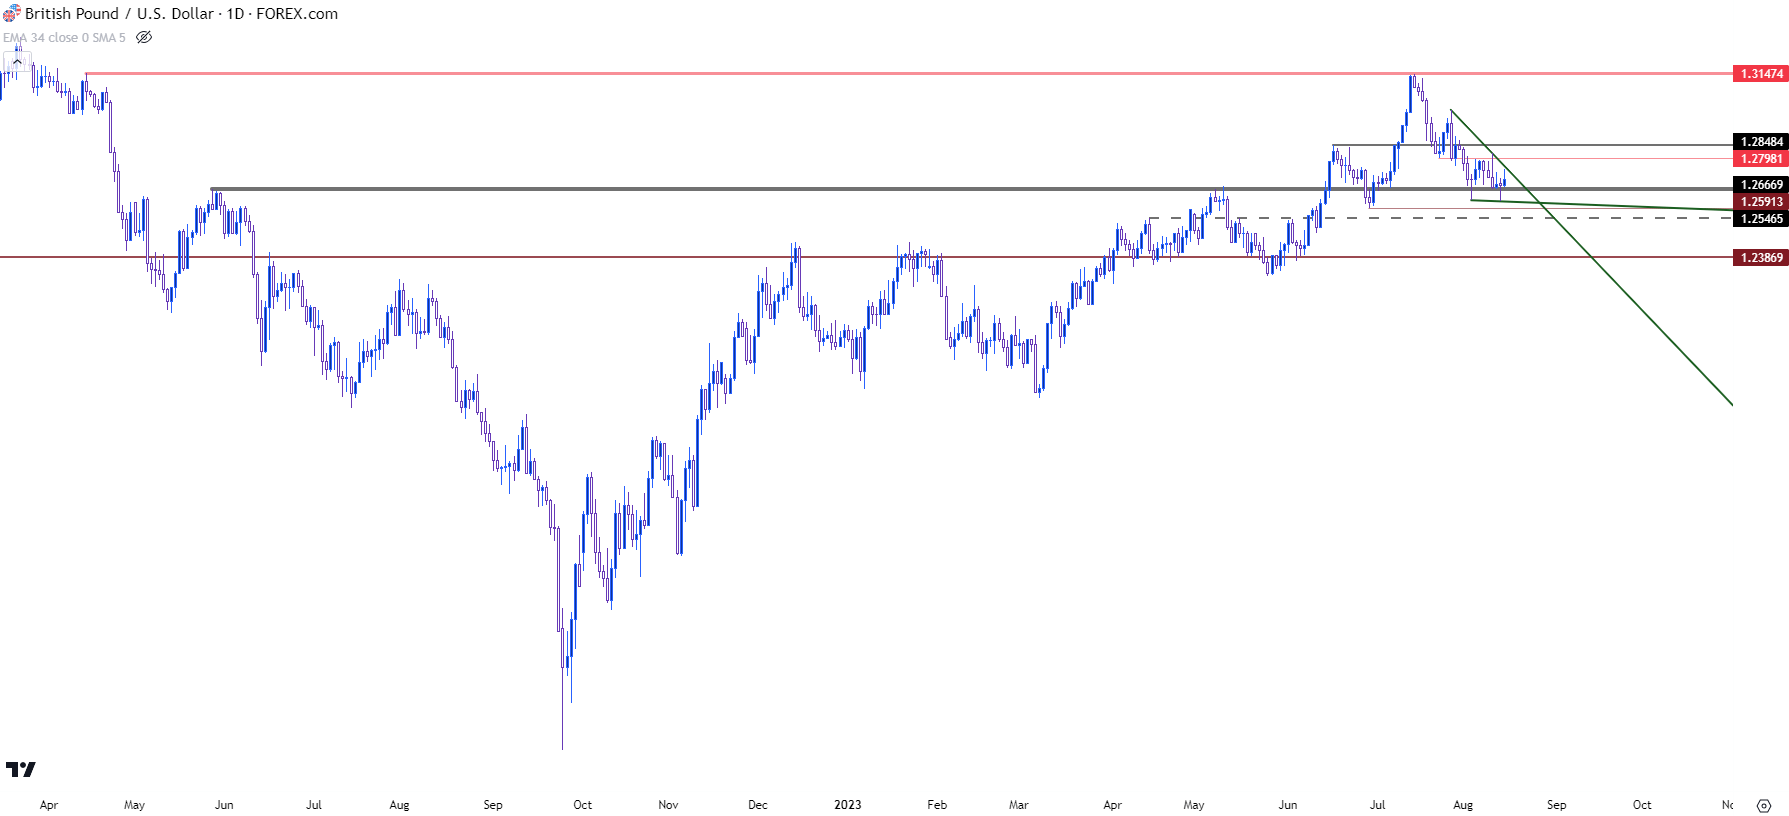
Chart prepared by James Stanley, GBP/USD on Tradingview
USD/CHF
On the other end of the spectrum, we have USD/CHF, and this may be one of the more enticing backdrops for USD-bulls. From a longer-term perspective there’s been limited time spent below the .9000 handle in the pair as we can see from the monthly chart below. Also, for emphasis, I’ve added a swing level at .8778 that I’ll touch on in the next chart.
USD/CHF Monthly Price Chart

Chart prepared by James Stanley, USD/CHF on Tradingview
USD/CHF
This is where matters get a bit more interesting on USD/CHF, as that .8778 level remains as resistance, but there’s also been a building bullish theme as denoted by the series of higher lows that have posted, and this is what helps to point to bullish potential in the pair.
Next resistance can be sought out at .8820, .8908 and then a re-test of the .9000 handle.
USD/CHF Daily Price Chart

Chart prepared by James Stanley, USD/CHF on Tradingview
USD/JPY
USD/JPY has been one of the markets that I’ve been highlighting for scenarios of USD strength and that potential remains, but the complication now is one of levels as we’re trading above the 145 handle in the pair. This was around the area that grumblings of intervention began to appear last year and it’s the price that came back into the picture in late-June to cauterize the highs.
The question now is whether we hear any similar grumblings with USD/JPY sitting above 145 and the fear is that any such indication could compel a stronger pullback in the pair. There may be some opportunity to impart strategy on a shorter-term basis and I’ll look at that on the next chart.
From the daily below, we can see price ripping up to a fresh 2023 high beyond that 145 level.
USD/JPY Daily Price Chart
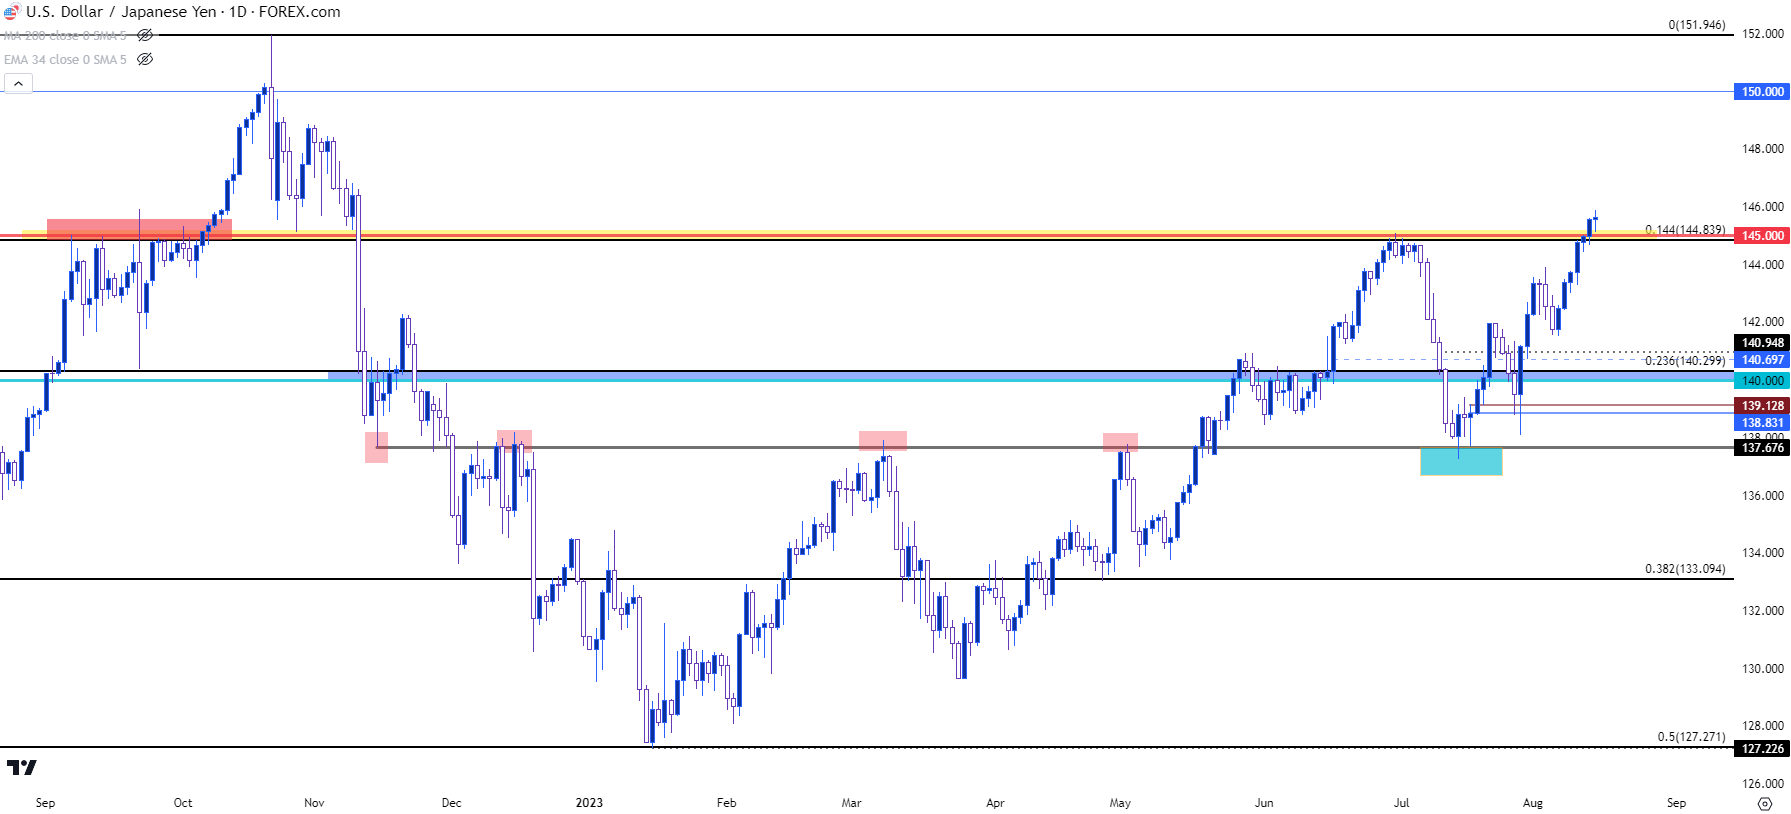
Chart prepared by James Stanley, USD/JPY on Tradingview
USD/JPY Shorter-Term
From the four-hour chart below we can see how briskly this trend has priced-in as bulls have driven to fresh 2023 highs. But, there’s a key area of resistance that hasn’t yet shown much for support, and that spans from the 145.00 resistance level down to the Fibonacci level at 144.84. A hold of support in that zone could re-open the door for bullish trend scenarios.
USD/JPY Two-Hour Price Chart
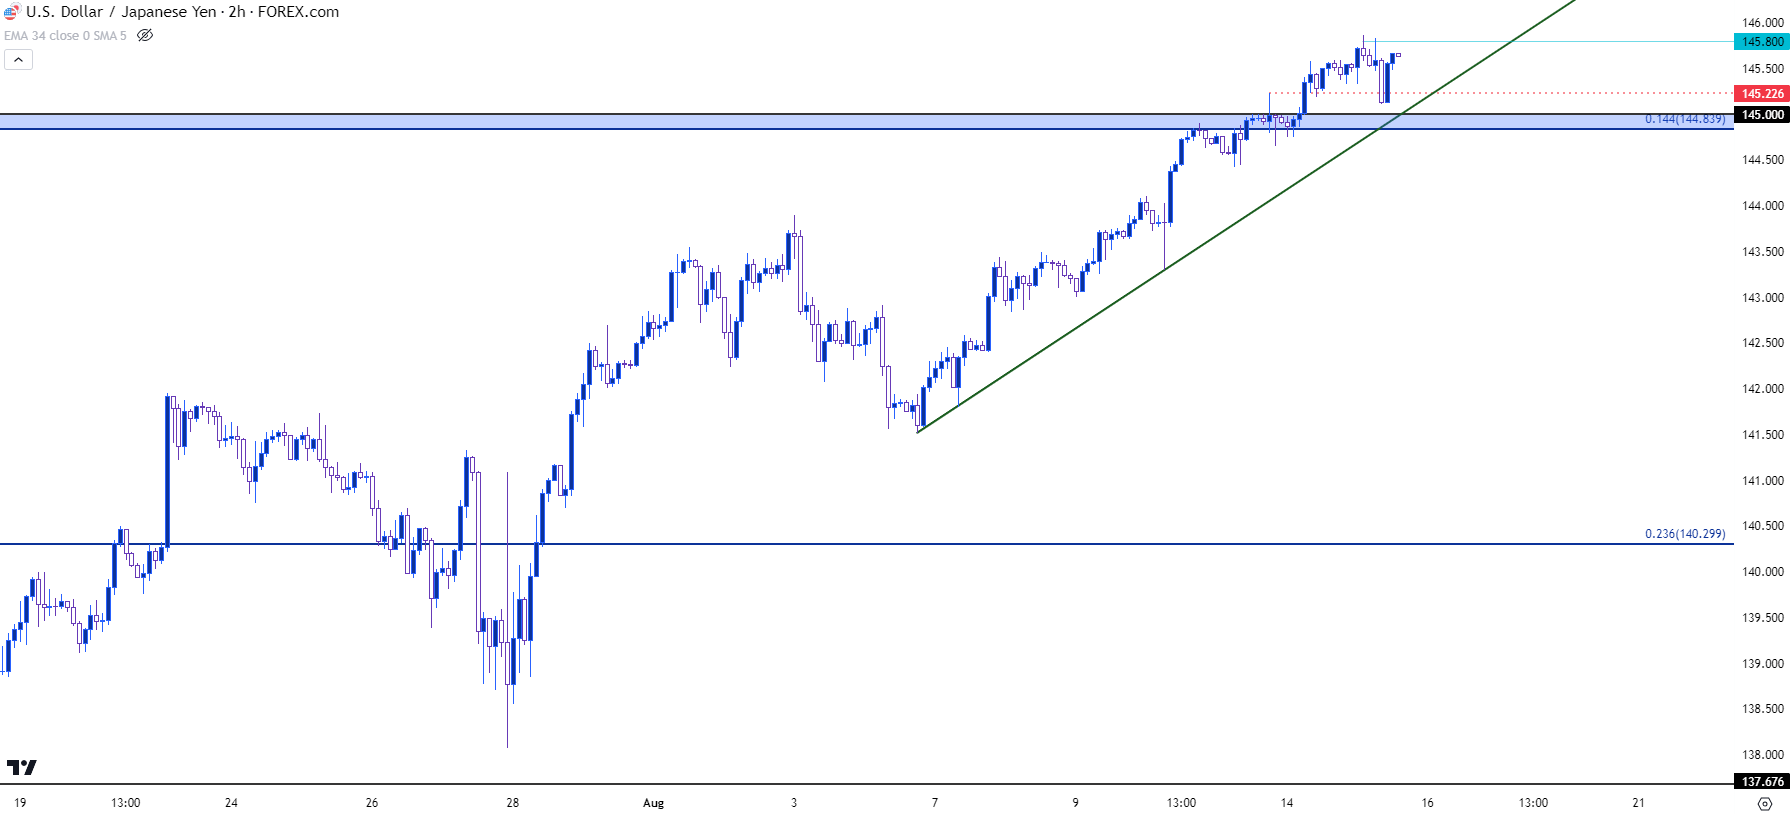
Chart prepared by James Stanley, USD/JPY on Tradingview
Gold Key Support Test
Gold has went down for another test of 1900 but, similar to the test in late-June sellers have failed to run with it. At this point, Gold prices remain grasping to a support zone that runs from 1893-1903.
Gold Daily Price Chart

Chart prepared by James Stanley, Gold on Tradingview
As I shared on the webinar, I do think there’s bearish potential for Gold as long as the Fed has to contend with inflation. And once inflation is tamed, whether that’s next year or the year after, the following Fed response could provide the motivation for bulls to finally take out that 2k level. But, until then, Gold remains in a longer-term range and fundamental forces would not appear to be behind the sails of bulls as long as inflation remains an issue for the Federal Reserve.
Gold Monthly Price Chart
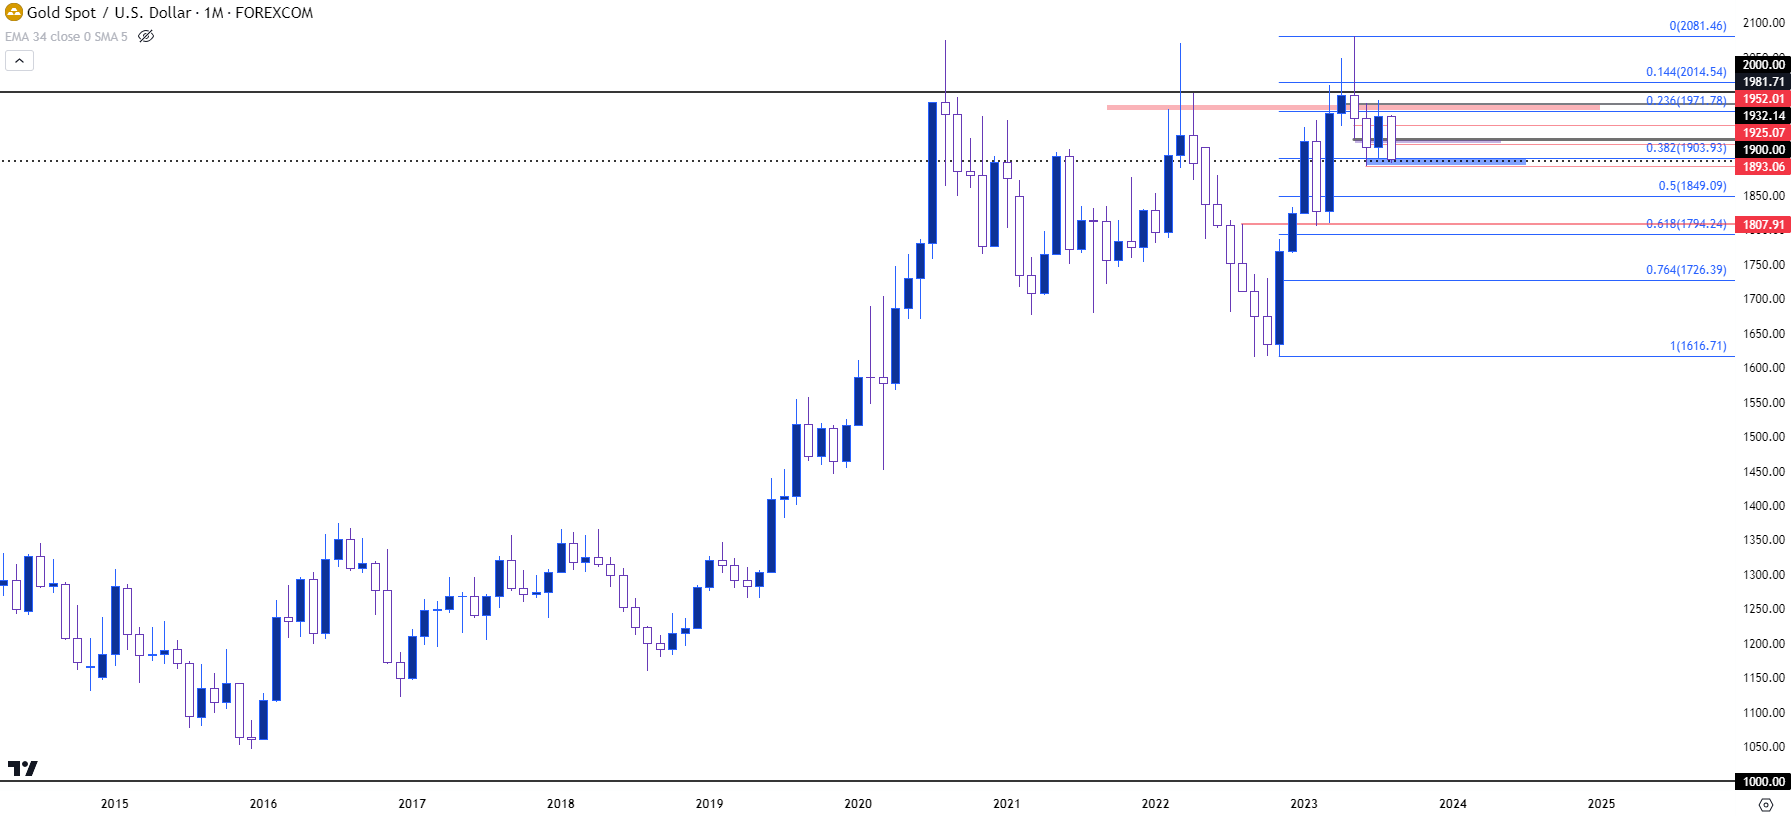
Chart prepared by James Stanley, Gold on Tradingview
Gold: Beware Bear Traps
There’ve been a few different scenarios where the door was seemingly open for bears but they couldn’t punch it home. Late-June was one of those scenarios, as price had tested below 1900 before snapping back and eventually testing above the 1980 level. But, notably, price remains well elevated beyond the support that was in-play in March at 1807 when banking worries were beginning to envelope the US economy.
From the four-hour chart below we can see that failed attempt from bears to elicit a break below 1900 earlier today. The corresponding pullback ran up to 1910 at which point sellers came back in so bears aren’t completely out of it yet, but the fact that they couldn’t run whilst at the fresh low this morning is what populates concerns of another bear trap. This could urge caution from chasing fresh breaks and, instead, tilt the focus towards resistance potential. The 1925-1932 zone remains an obvious spot of interest.
Gold Four-Hour Price Chart
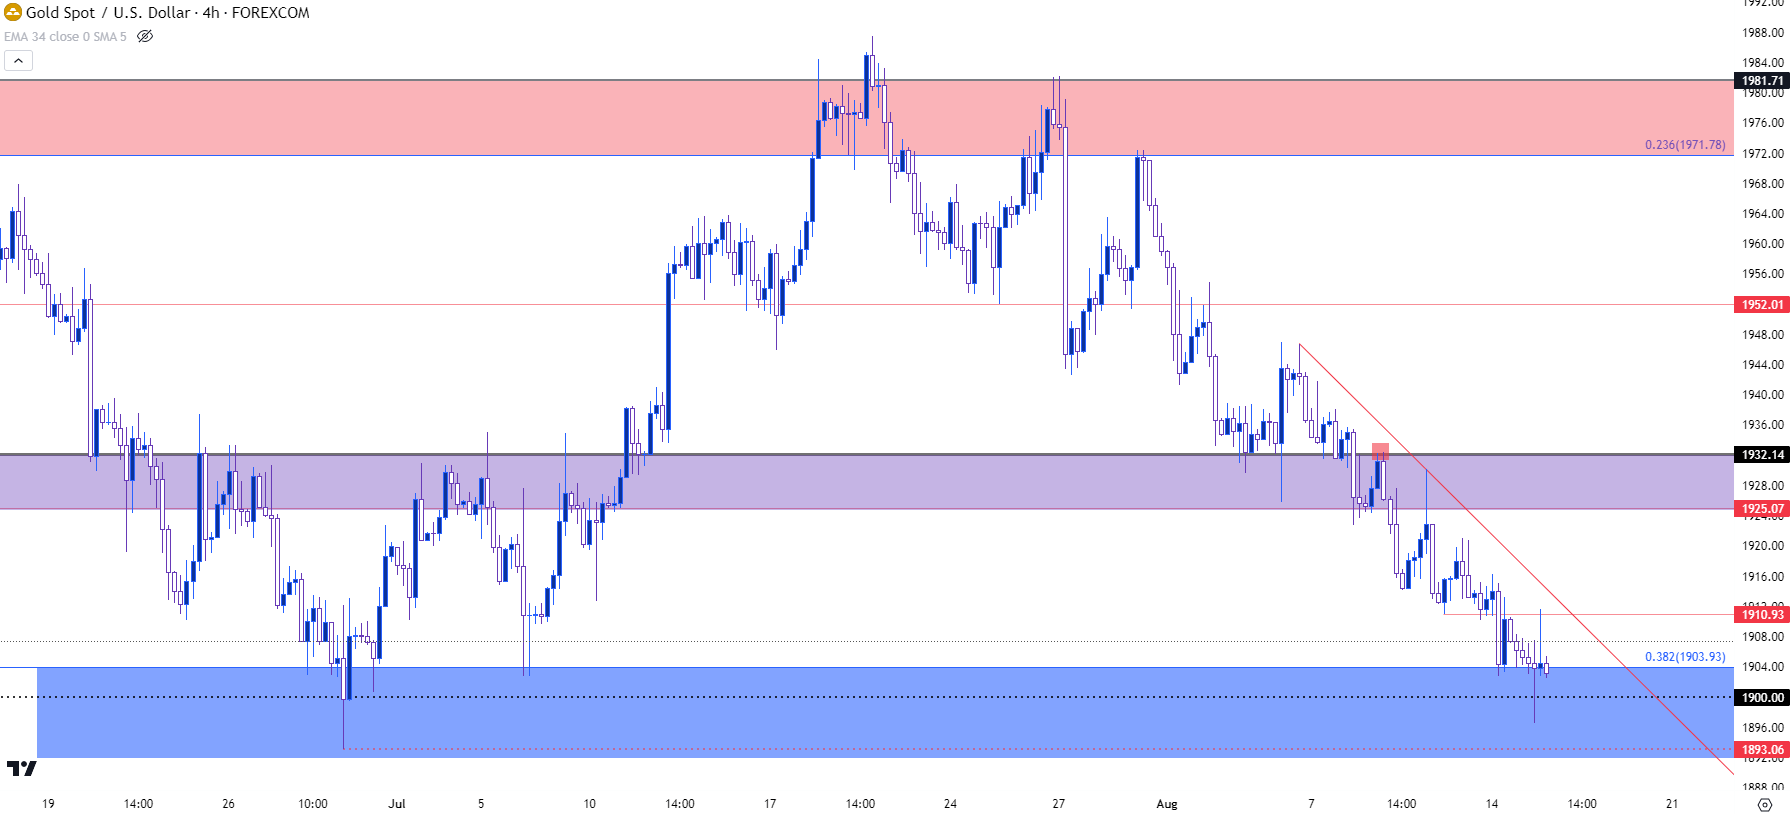
Chart prepared by James Stanley, Gold on Tradingview
--- written by James Stanley, Senior Strategist


