
US Dollar Talking Points:
- The US Dollar is holding very near a key spot of resistance, and this is the same trendline that’s held multiple runs from bulls so far this year.
- The CPI report on Thursday is likely to be the next major push point for the USD and this could have reverberations elsewhere, such as EUR/USD which is holding its own support or Gold or USD/CAD, all of which were covered in this webinar.
- We concluded the webinar by looking at US equities, with both the S&P 500 and Nasdaq 100 showing bearish near-term tendency with lower lows, the Russell 2000 and Dow Jones show a somewhat different picture, examined in the latter portion of the session.
- I’ll be discussing these themes in-depth in the weekly webinar on Tuesday at 1PM ET. It’s free for all to register: Click here to register.
It’s a quieter week on the economic calendar this week and as I shared at the beginning of this webinar, that can put more emphasis on price action and technical analysis. There is one major item, however, with the release of US CPI data for the month of July. This was a big push point last month when headline CPI came in at a flat 3.0%, which led into a quick breakdown move in the US Dollar. This caused breach of a massive support level in DXY and as I stated in the webinar the week after, the big test was whether bears came into defend lower highs in order to continue that trend.
They haven’t, and the FOMC and ECB rate decisions in July helped to further reverse that move. And as we sit in front of the next US CPI release scheduled for Thursday, the US Dollar is holding on to bullish breakout potential.
This year has so far been consolidation in the USD, shown in the form of a falling wedge, and the resistance side of that formation has been tested multiple times: There was the two weeks of grind in May and June which led to a pullback to 102, and then the next test in July was a quick touch before a reversal developed, which was later helped by that CPI print out of the US.
US Dollar - DXY Weekly Price Chart (indicative only, not available on Forex.com platforms)
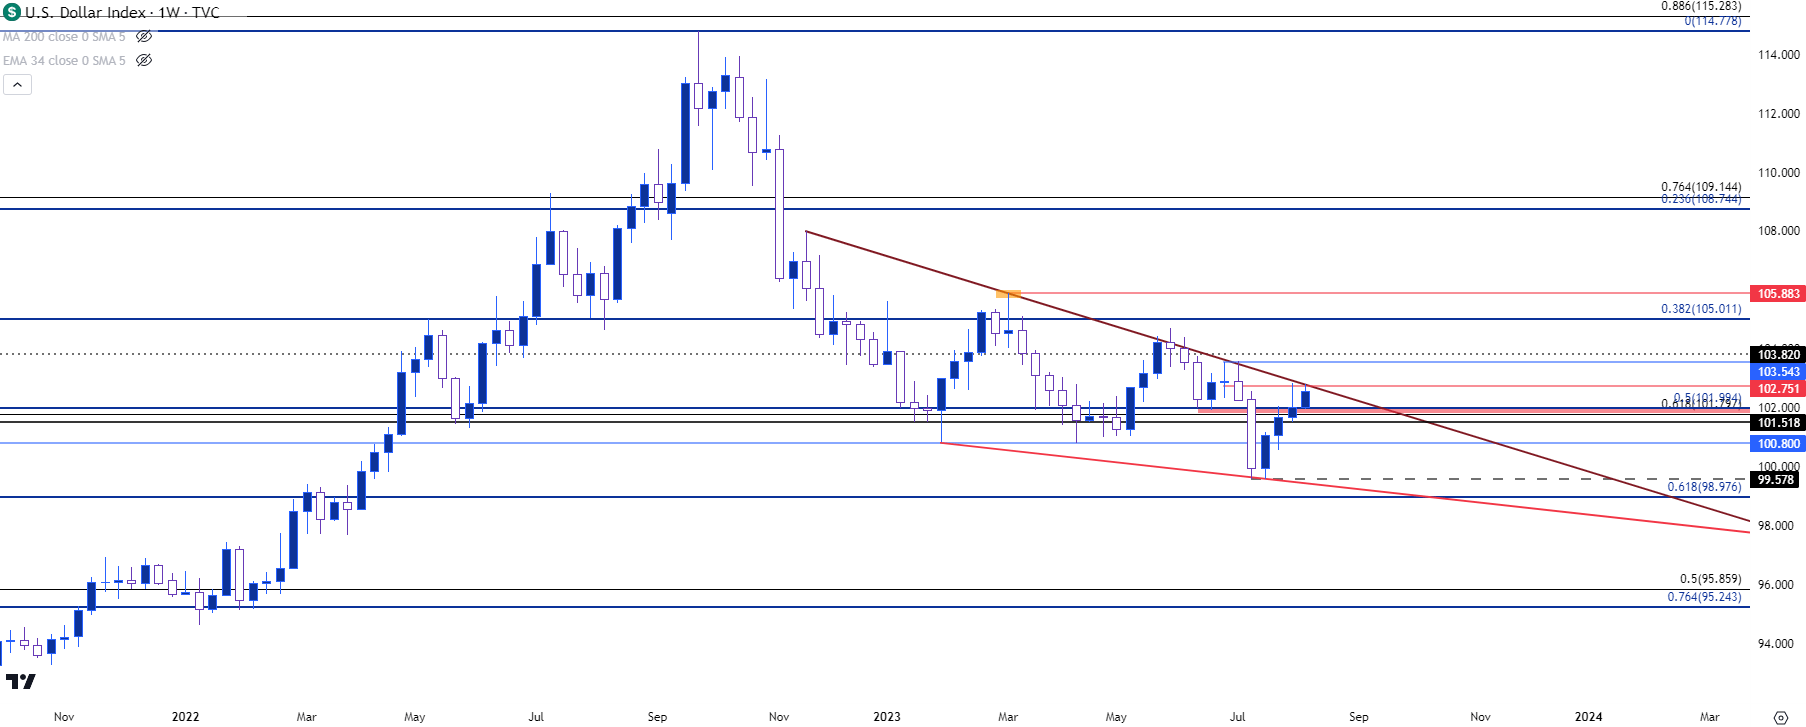
Chart prepared by James Stanley; data derived from Tradingview
USD Shorter-Term
On a shorter-term basis, that bullish structure remains clear in USD price action. I had written a report ahead of the weekend to highlight the support zone at 101.80-102, the latter of which was that June swing low.
That support zone has since held the lows and price on the daily chart is shown a non-completed morning star formation, which could keep the door open for further highs. That resistance trendline sits overhead, however, and this is the next major spot for bulls to contend with.
The CPI print on Thursday is expected to show headline CPI at 3.3% which would be the first increase in that data point since June of last year, just before it topped. If we end up with an upside surprise on that data point it may compel even greater bullish drive which could expose resistance at 103.45 or 103.82.
US Dollar - DXY Weekly Price Chart (indicative only, not available on Forex.com platforms)

Chart prepared by James Stanley; data derived from Tradingview
EUR/USD 1.0943
EUR/USD remains at a key spot of support of 1.0943. I’ve been talking about this level for a couple of weeks now and it was in the picture back in June, as well. This is the 50% mark of the same Fibonacci retracement that helped to mark the high at 1.1275, which is the 61.8% mark of the 2021-2022 major move.
EUR/USD Weekly Price Chart
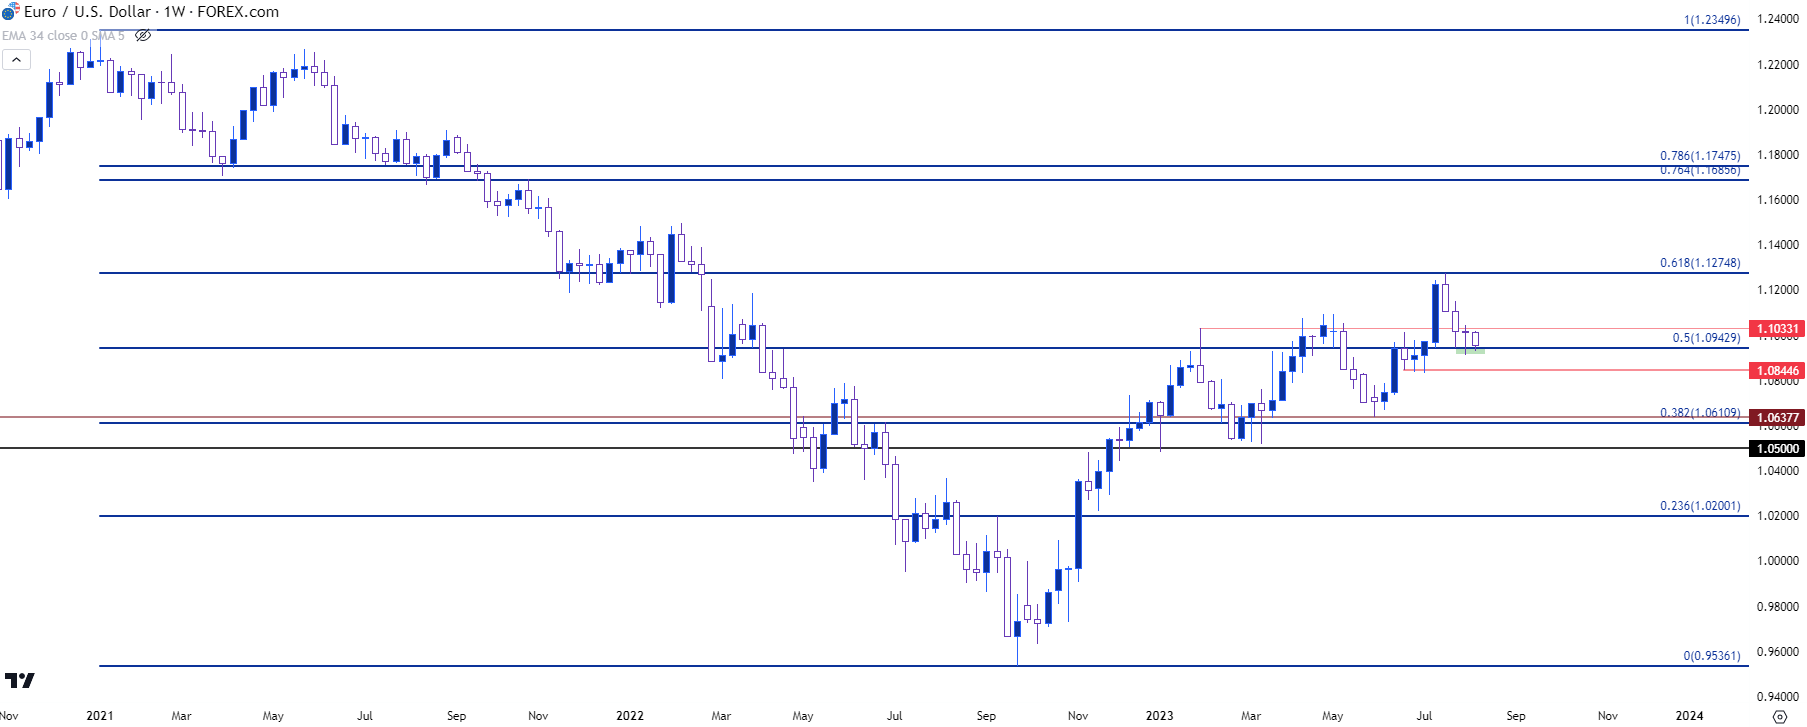
Chart prepared by James Stanley, EUR/USD on Tradingview
EUR/USD Shorter-Term
Bears have kept a brisk pace on this move, and it’s been the recent dimming in European data that’s contributed to the shake-up. There’s a bearish trendline in-play that caught another resistance test earlier today, and this keeps a descending triangle formation in play. These are often approached with the aim of bearish breakdowns and that door remains open – but bears have not been able to do much below 1.0943 yet and given the stark reaction to resistance at the 61.8% retracement, there could be residual support to play off of the 1.0943 level and this keeps the door open for a messy outlay ahead of that US CPI release on Thursday.
I’m tracking next support in the pair around the 1.0845 level that was last in-play in early-July, ahead of the CPI print that brought the false breakout to the US Dollar.
EUR/USD Four-Hour Price Chart
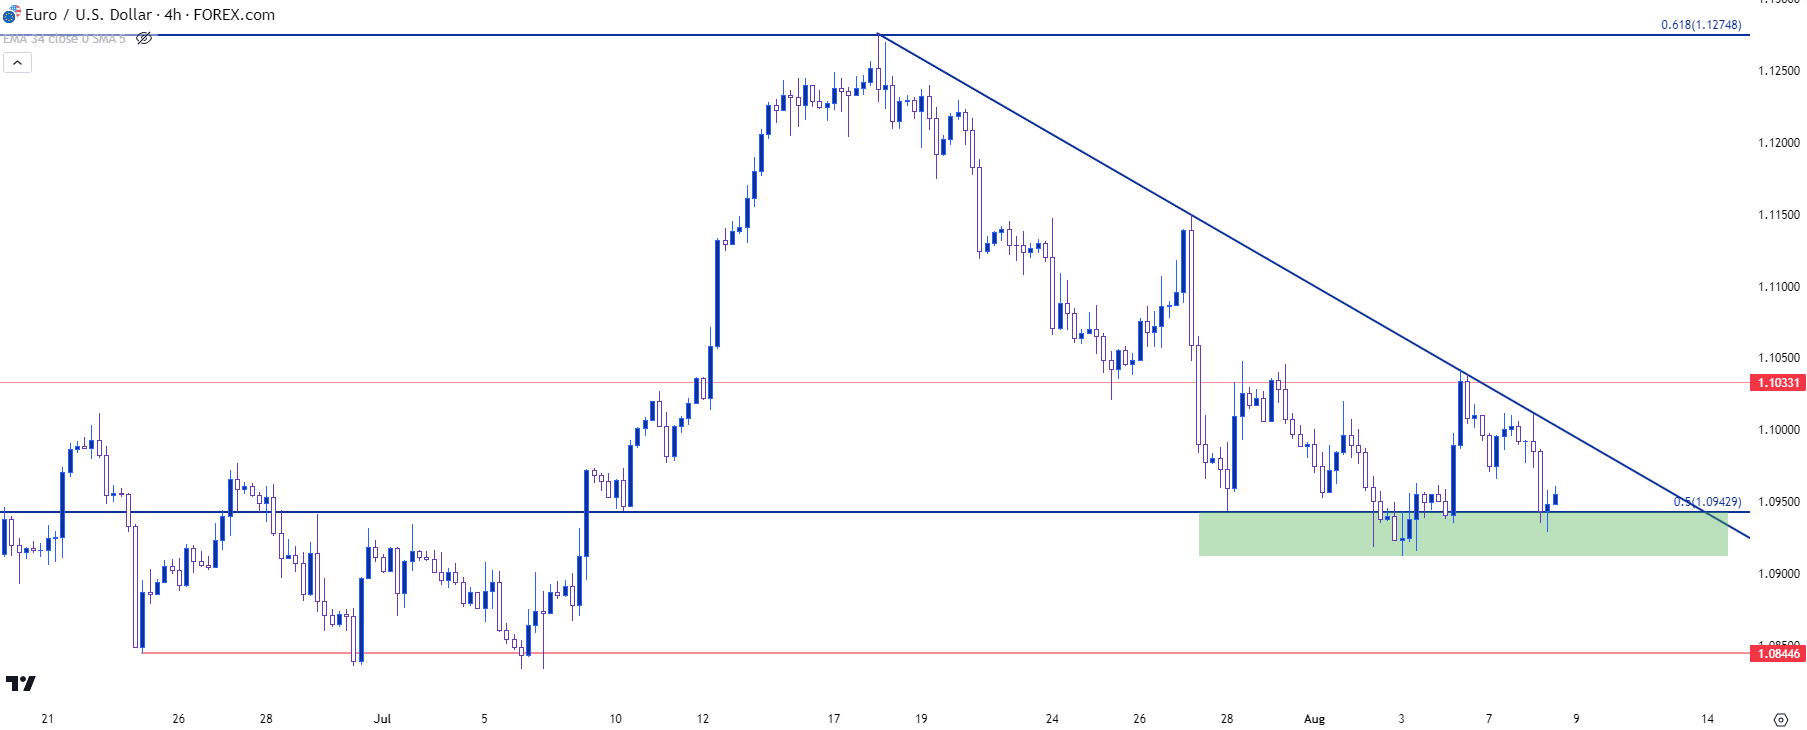
Chart prepared by James Stanley, EUR/USD on Tradingview
USD/JPY
USD/JPY is back to a key resistance level at 143.40. I had talked about this level in last week’s webinar as it’s a Fibonacci level that had started to stall a topside move. That led to the build of an evening star that completed last Thursday, and there was one day of run on Friday, but so far this week price has reversed and moved right back to that resistance level.
There’s also been a pullback to support at prior short-term resistance around 142.89, giving the appearance that bulls may soon go for another breakout. The big question, of course, is whether it can hold if that does play out. Sitting overhead is the 145 level which elicited a stark reversal when it came into play in late June.
USD/JPY Daily Chart
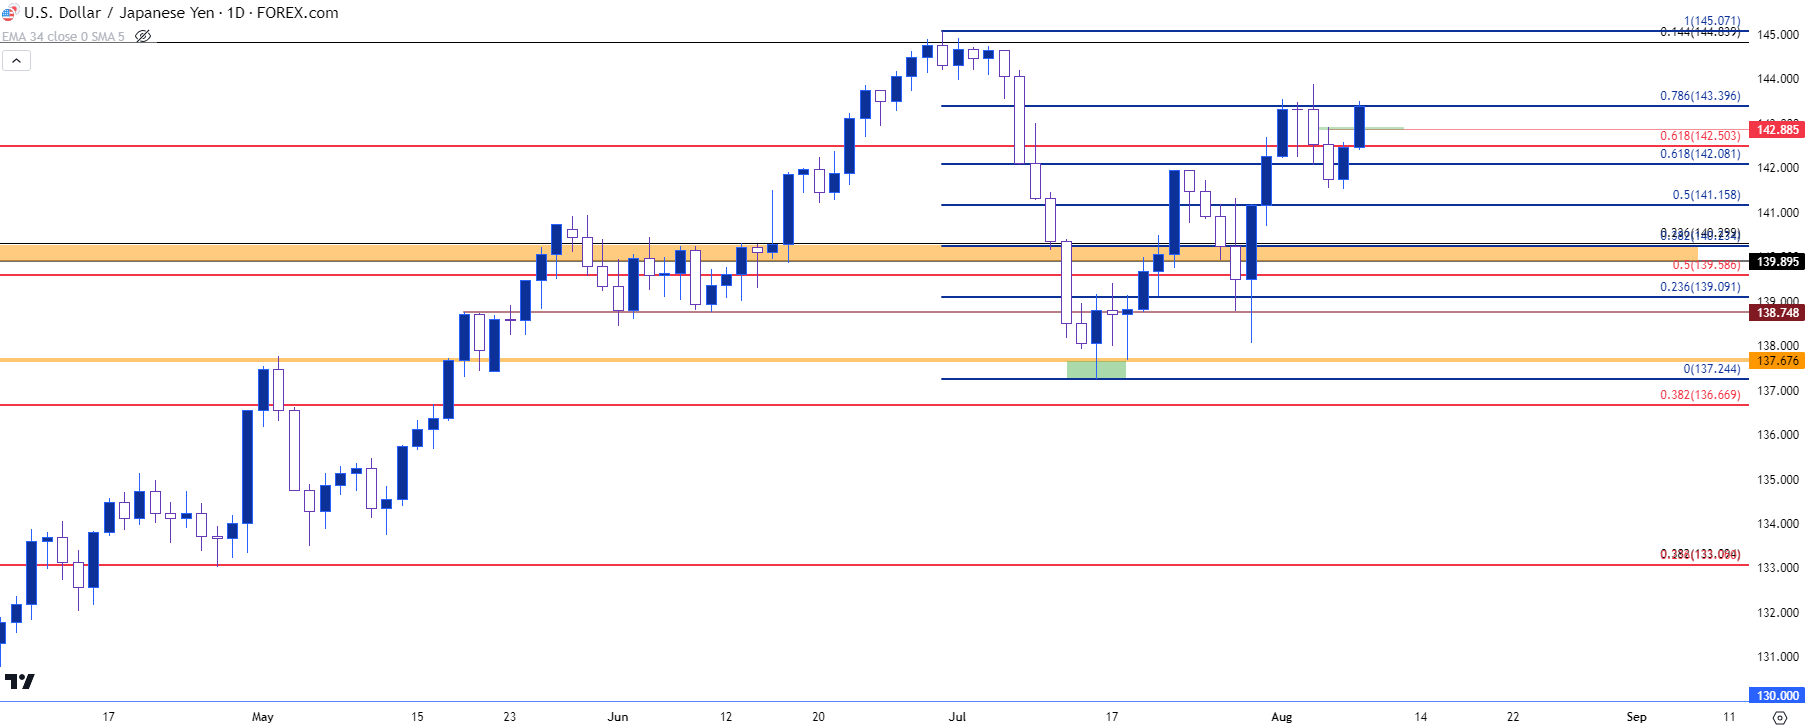
Chart prepared by James Stanley, USD/JPY on Tradingview
Spot Gold
Gold is testing support at 1925-1932. This was a zone of prior resistance as taken from previous support. The challenge here is that bears have had an open door to push a breakdown move and they haven’ t yet, the question must be asked as to why. Breakout challenges have seemed especially challenging in Gold of late as there’s been a number of bear traps, such as what was seen at the 1900 level.
The 1943 area of prior support has already come in as resistance so that might be non-ideal if it comes back into the picture as that would be quite the stretch from bulls, but, on a shorter-term basis, this can highlight resistance potential around 1932 or perhaps at 1952, which could come into play if bulls force a break beyond the 1943 level that’s already been tested.
Gold (XAU/USD) Four-Hour Price Chart
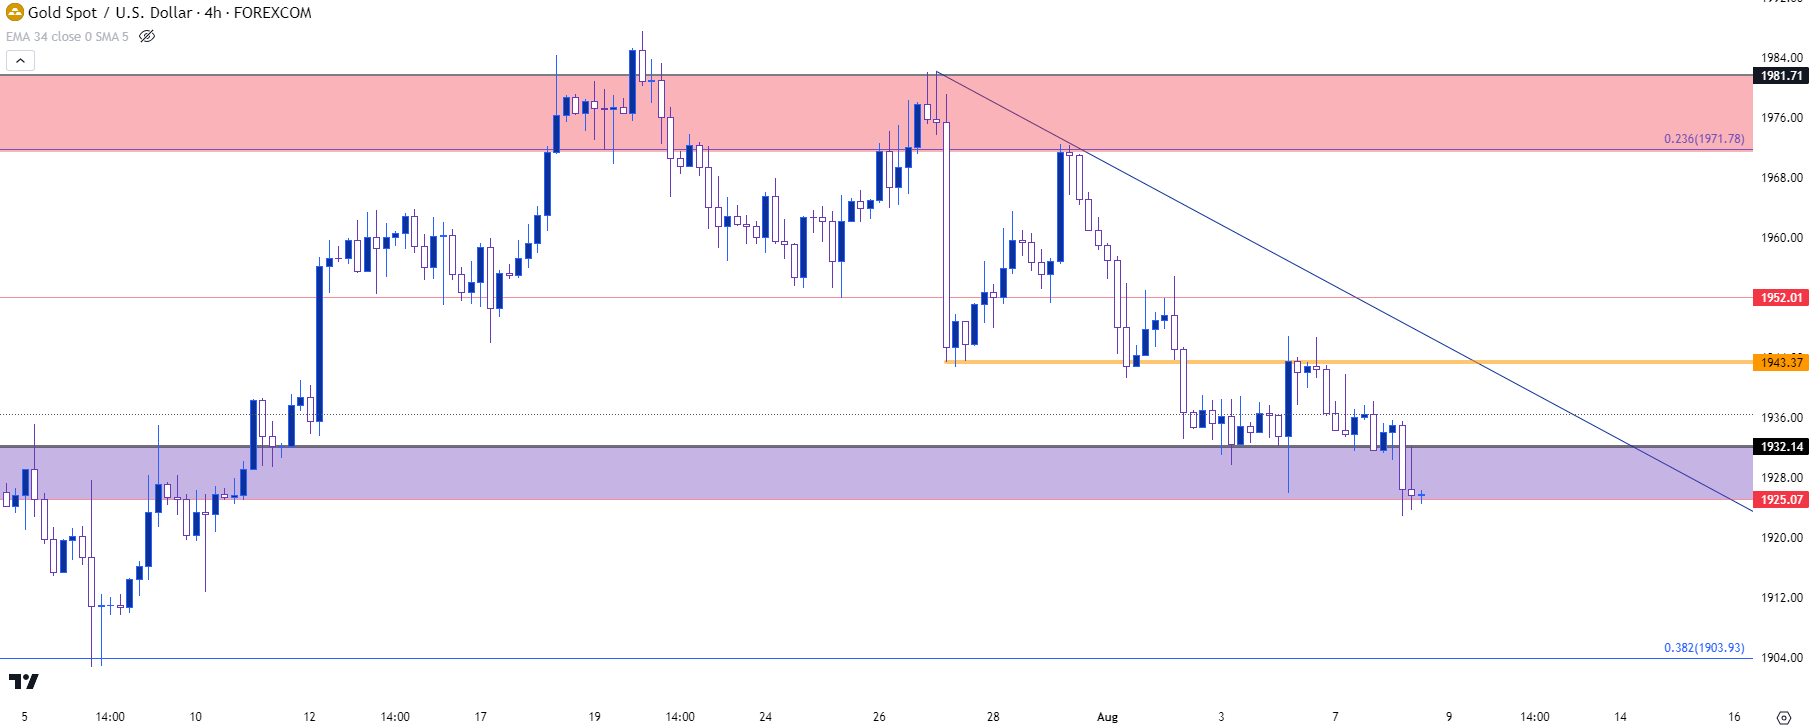
Chart prepared by James Stanley, Gold on Tradingview
GBP/USD
GBP/USD tested a key support level last week at 1.2667. That helped to hold the low on the daily bar for last Thursday, which saw a Bank of England rate decision. That daily bar finished as a doji and then strength on Friday pushed into a morning star formation but that comes with questions, as a late-session sell-off erased the upper portion of the Friday bar.
Given the inflation picture in the UK, this does present a point of interest as bearish scenarios in the USD, which would likely come along with lower inflation and FOMC expectations, could be of benefit here as inflation remains brisk in the UK and the BoE will likely need to continue to address that.
A hold of support at 1.2667 will be necessary to keep that scenario as a possibility, however, and the 1.2848 level sits overhead as a point of resistance for bulls to contend with.
GBP/USD Daily Price Chart
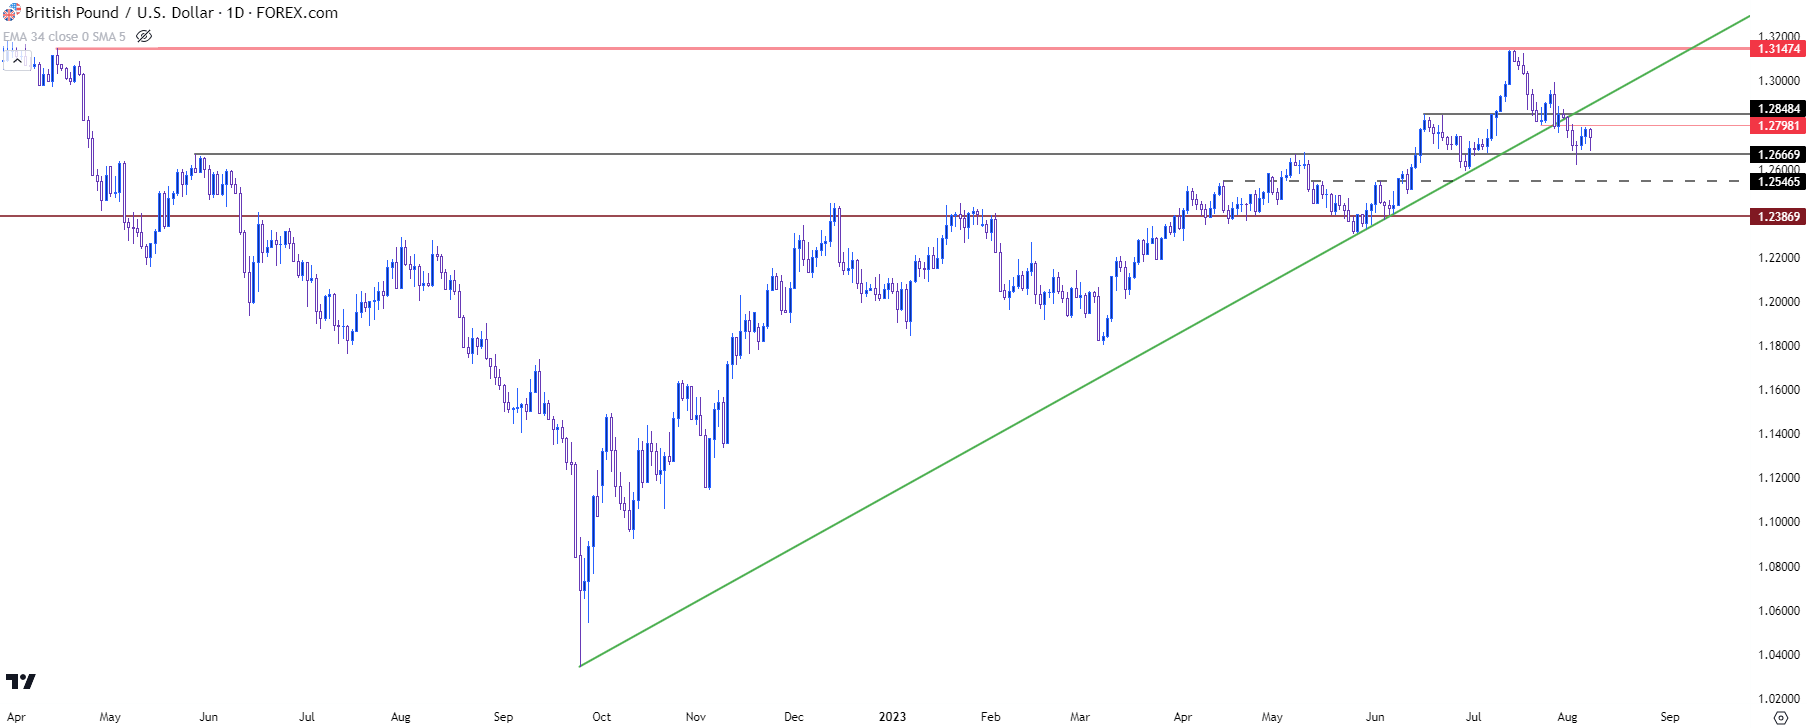
Chart prepared by James Stanley, GBP/USD on Tradingview
--- written by James Stanley, Senior Strategist


