
US Dollar Talking Points:
- The US Dollar has pushed up for a re-test of the 200-day moving average, which is confluent with a few other forms of resistance as discussed in the webinar.
- EUR/USD has started a test of its own 200DMA and AUD/USD has a recent test below it’s own. Meanwhile, GBP/USD has held in a fairy consistent range.
- I’ll be discussing these themes in-depth in the weekly webinar on Tuesday. It’s free for all to register: Click here to register.
The US Dollar continues to show strength. Last week DXY had held resistance at 102.55 and that remained for a few more days, even with a strong CPI report. But sellers couldn’t get much run with that resistance hold and as we opened into this week, bulls continued to push and helped to prod price up to the next major spot of resistance on the USD at the 103.50 level.
I had talked about that 103.50 zone last week in the webinar; and since then I’ve written and published an article on the 200-day moving average. This can be a big spot for resistance to show, particularly on a short-term basis, but the bigger question is what happens after. As in, if USD shows a pullback but then buyers push in to hold a higher-low, there will remain bullish structure that could, potentially, go into a fresh topside trend.
Of course, given that this is the US Dollar which is merely a composite of underlying currencies (the only way to value a currency is with other currencies) it would require some participation from currencies like the Euo, Yen or British Pound to allow for that trend to take-hold, and there could be some challenges to that which I’ll extrapolate on in a bit.
In the US Dollar the big spot for higher-low support to hold above is prior resistance, around 102.55. Interestingly these are both prices that can be pulled from the Fibonacci retracement around last July’s bullish move. The spot of 102.55 is the 61.8% retracement while 103.46 is the 50% mark from the same trend.
US Dollar Daily Price Chart (indicative)
 Chart prepared by James Stanley; data derived from Tradingview
EUR/USD
With the Euro playing a whopping 57.6% role in the DXY basket, a continued bullish trend in the USD will likely need at least some participation from the Euro; and as of right now EUR/USD is testing a big spot of support on the chart.
The 200-day moving average has so far helped to set the low of the day, but that’s not the only support in this region as there’s also a Fibonacci level plotted at 1.0862 that’s been in-play, as well.
For trends, the big question is whether sellers hurry back into the pair in the event that a bounce develops off of this support zone. Where this happens could also be key, as sellers coming in to defend the 1.0900 handle would look more bearish than if they had waited for resistance to show up at 1.0943-1.0960. The 1.1000 handle caught another inflection last week, so that would appear to be the point of invalidation for bearish trend potential in the pair.
EUR/USD Daily Price Chart
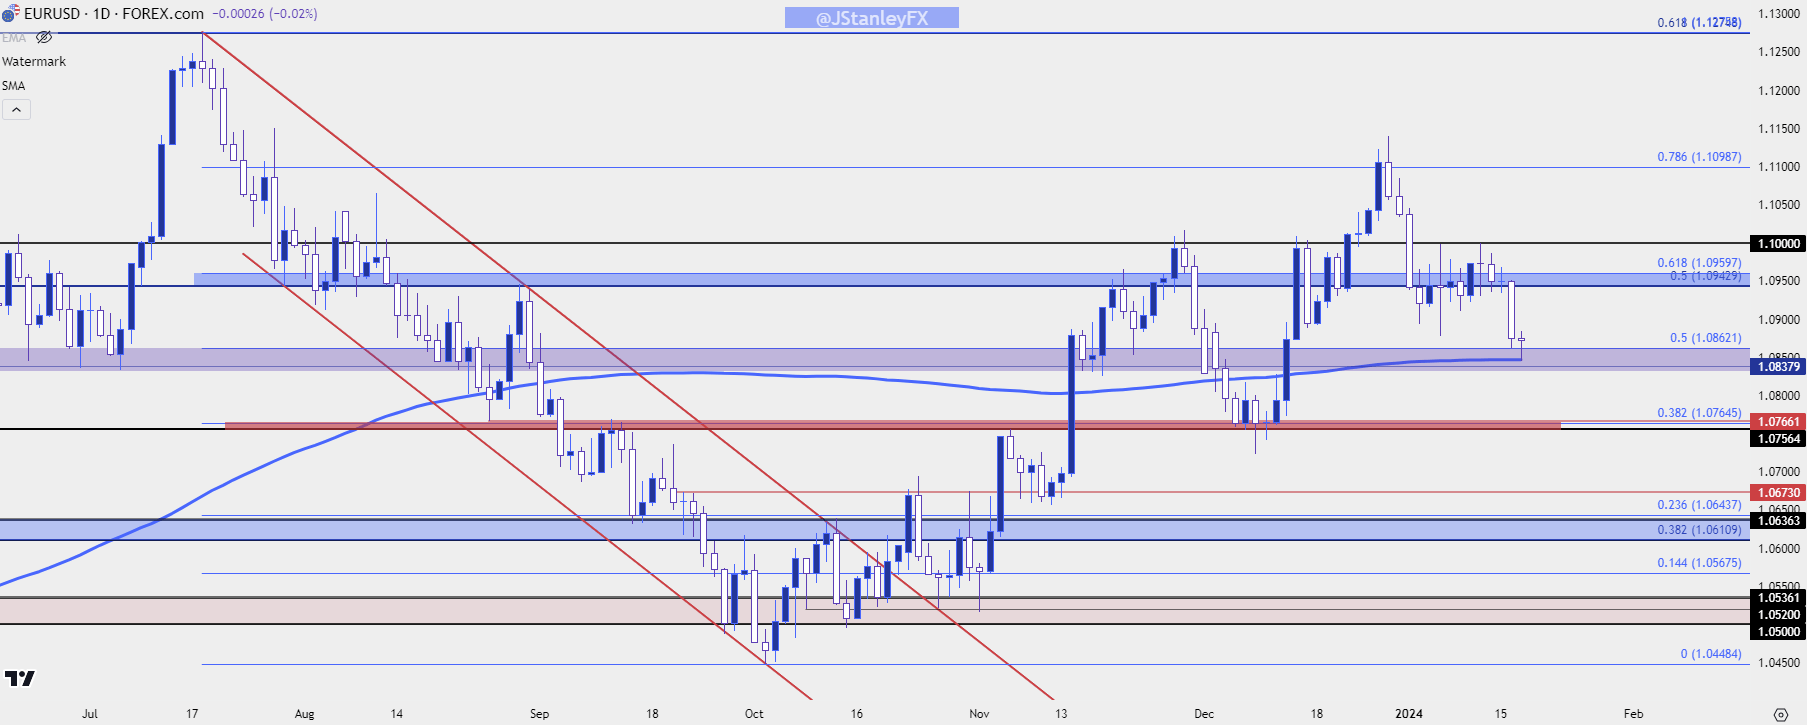 Chart prepared by James Stanley, EUR/USD on Tradingview
USD/JPY
I said it last week and I said it again this week, but USD/JPY is trading like an amplified version of the US Dollar. As USD strength has showed up so far in 2024 trade, USD/JPY strength has been a notable theme. In the webinar, I also did a quick comparison between DXY and USD/JPY since lows were set on December 28th in each market. While DXY has shown a move of as much as 3.06%, USD/JPY has rallied by as much as 5.9% over that same span of time.
This can work both ways, however, as a show of USD-weakness could again serve to frighten carry traders, like what showed in Q4 of the past two years after CPI reports were released in November.
The 150 level could possibly bring about some change as this could also lead to some verbal intervention or intervention-like commentary from Japanese Finance Ministry officials. This was in the equation over each of those past two cycles and there’s little reason to think that Japanese officials have suddenly warmed to the idea of USD/JPY trending above 150.00.
USD/JPY Daily Price Chart
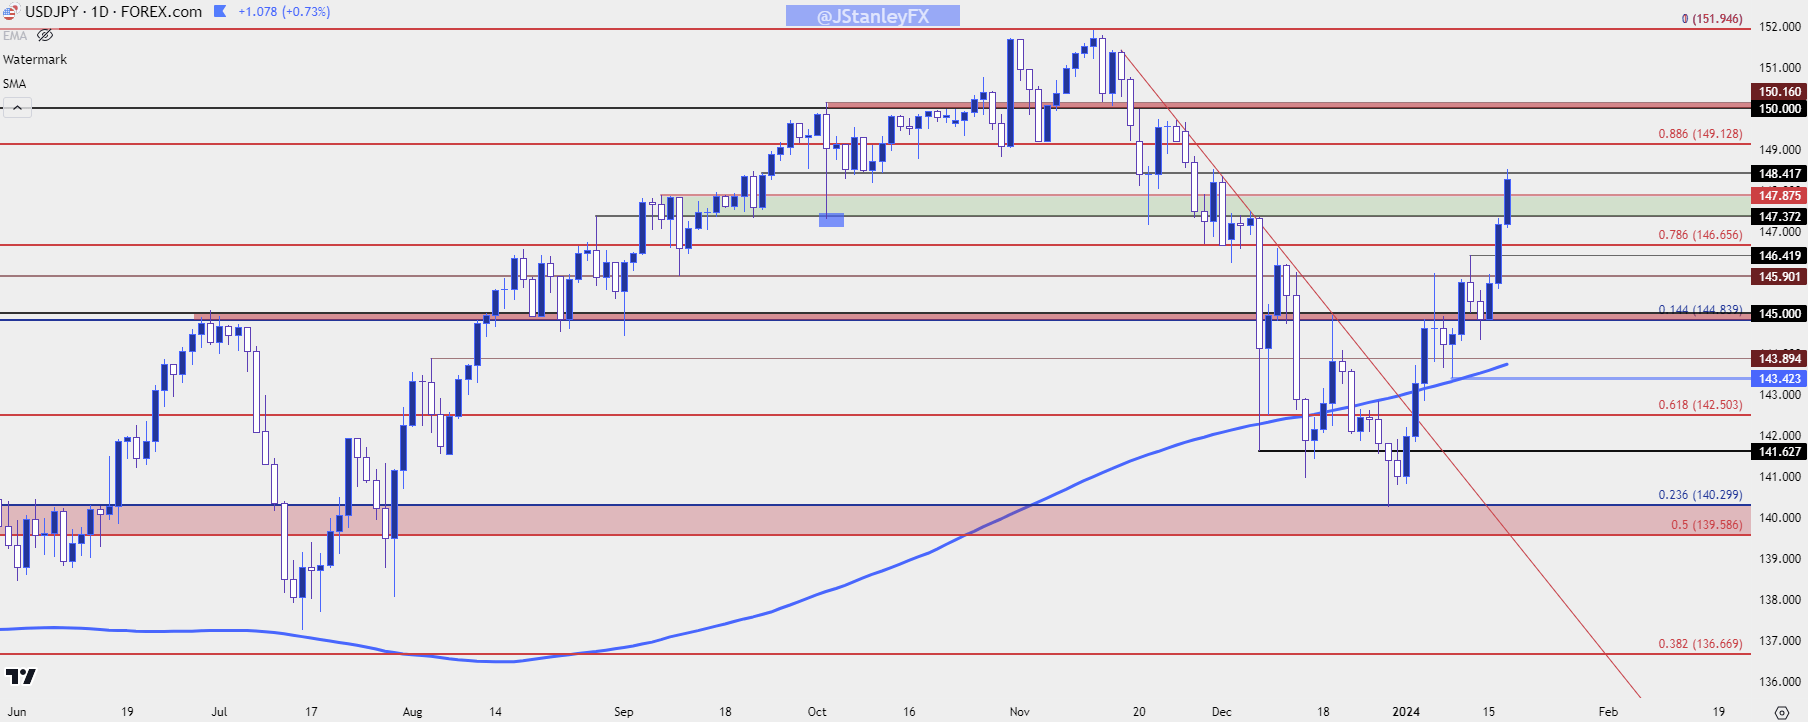 Chart prepared by James Stanley, USD/JPY on Tradingview
GBP/USD
GBP/USD remains in a range that’s been consistent over the past month and change. I had investigated this last week with focus on resistance. There are three different Fibonacci levels within tight proximity, ranging from 1.2720 up to 1.2758.
This zone came into play in late-November and almost two months later, bulls haven’t been able to break much ground beyond that. As looked at last week, however, there’s also been a proclivity for bulls to show up around support, leading to what’s been a consistent range. This can keep the door open for continued mean-reversion and that resistance zone remains in-play.
As for deeper support, there is a spot of interest around 1.2548, which is a prior price swing that’s confluent with the pair’s 200-day moving average.
GBP/USD Daily Price Chart
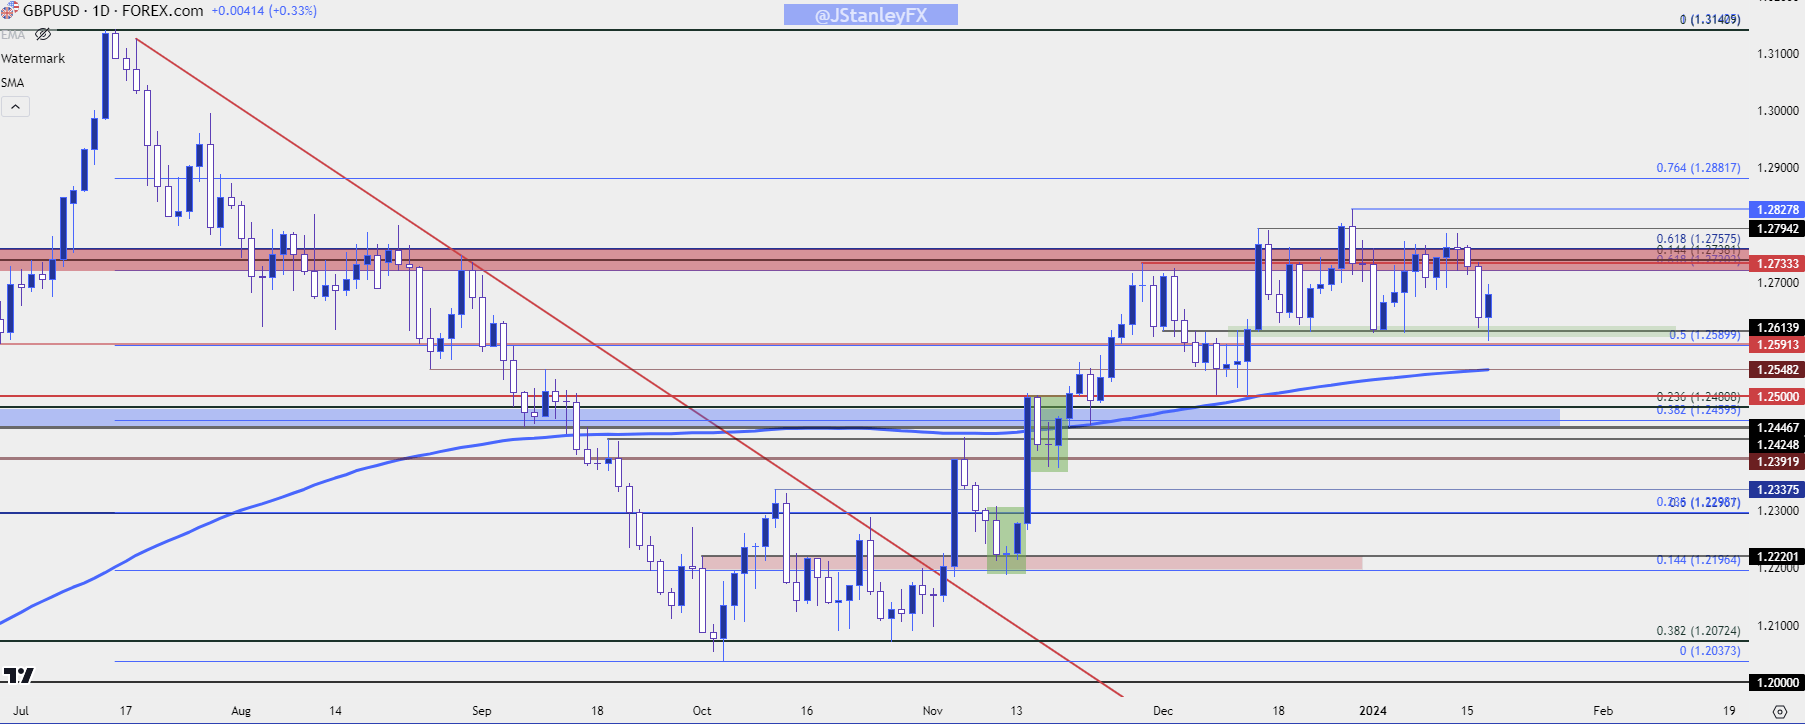 Chart prepared by James Stanley, GBP/USD on Tradingview
AUD/USD
I wrote about AUD/USD as a big spot of support was nearing. At the time the pair had already started to test its 200-day moving average and has since pushed below that. But as I shared in the article it was that area around the .6500 handle that remained compelling. The 61.8% Fibonacci retracement of the recent bullish move plots there, and a prior resistance swing around .6523 helps to mark the topside of that zone.
This could be an interesting setup for those looking to play a pullback in the DXY from that 103.50 resistance.
AUD/USD Weekly Chart
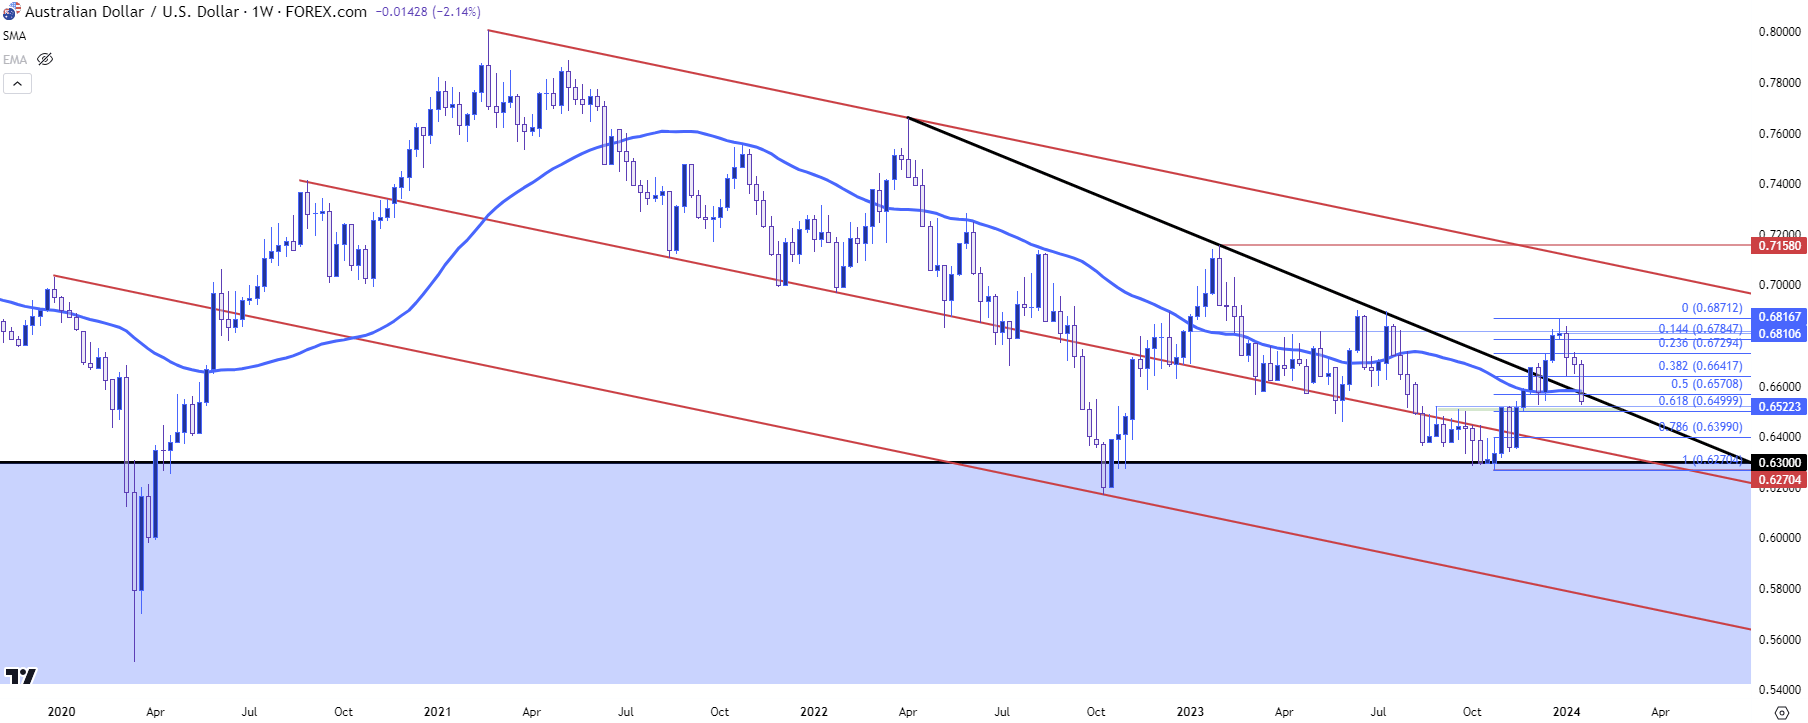 Chart prepared by James Stanley, AUD/USD on Tradingview
Gold Nearing $2k Re-Test
I remain of the mind that Gold has held its range and that the sustained breakout above $2k is going to have to wait for the Fed to formally flip with monetary policy. But, with that said, bulls have held the line well so far this year, even with longer-term Treasury rates perking back up.
Gold Weekly Price Chart
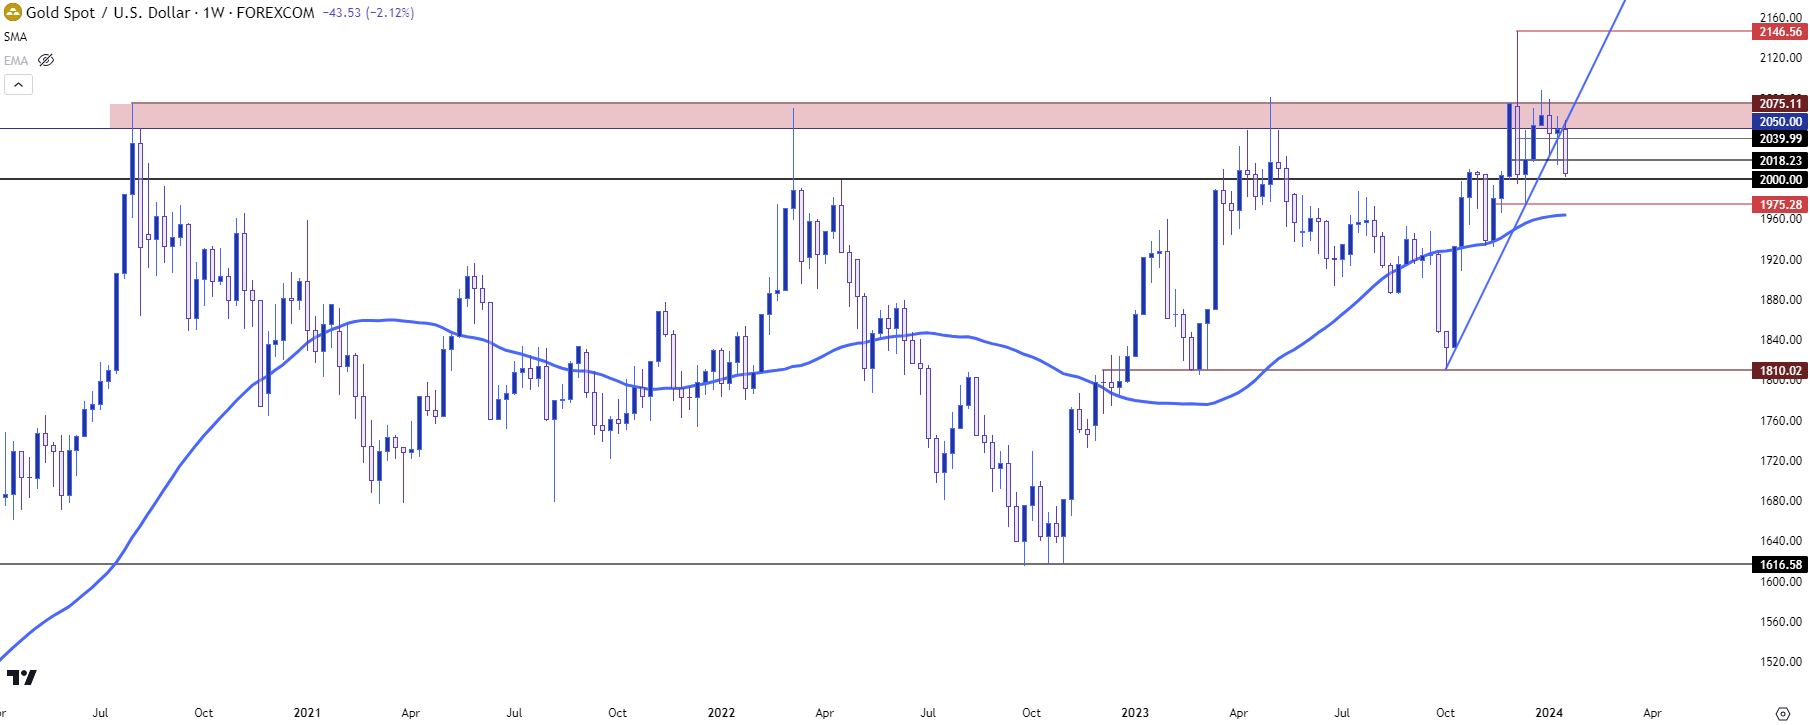 Chart prepared by James Stanley, Gold on Tradingview
The $2,000 psychological level remains a massive line in the sand and price hasn’t yet ticked below that. But there could be some trailed stops sitting below the big figure, and if that price does get traded through and those stops get triggered, we could get some information about sentiment in the market. Below that, there’s another item of possible support around 1975, and then another around 1933.
Gold Daily Price Chart
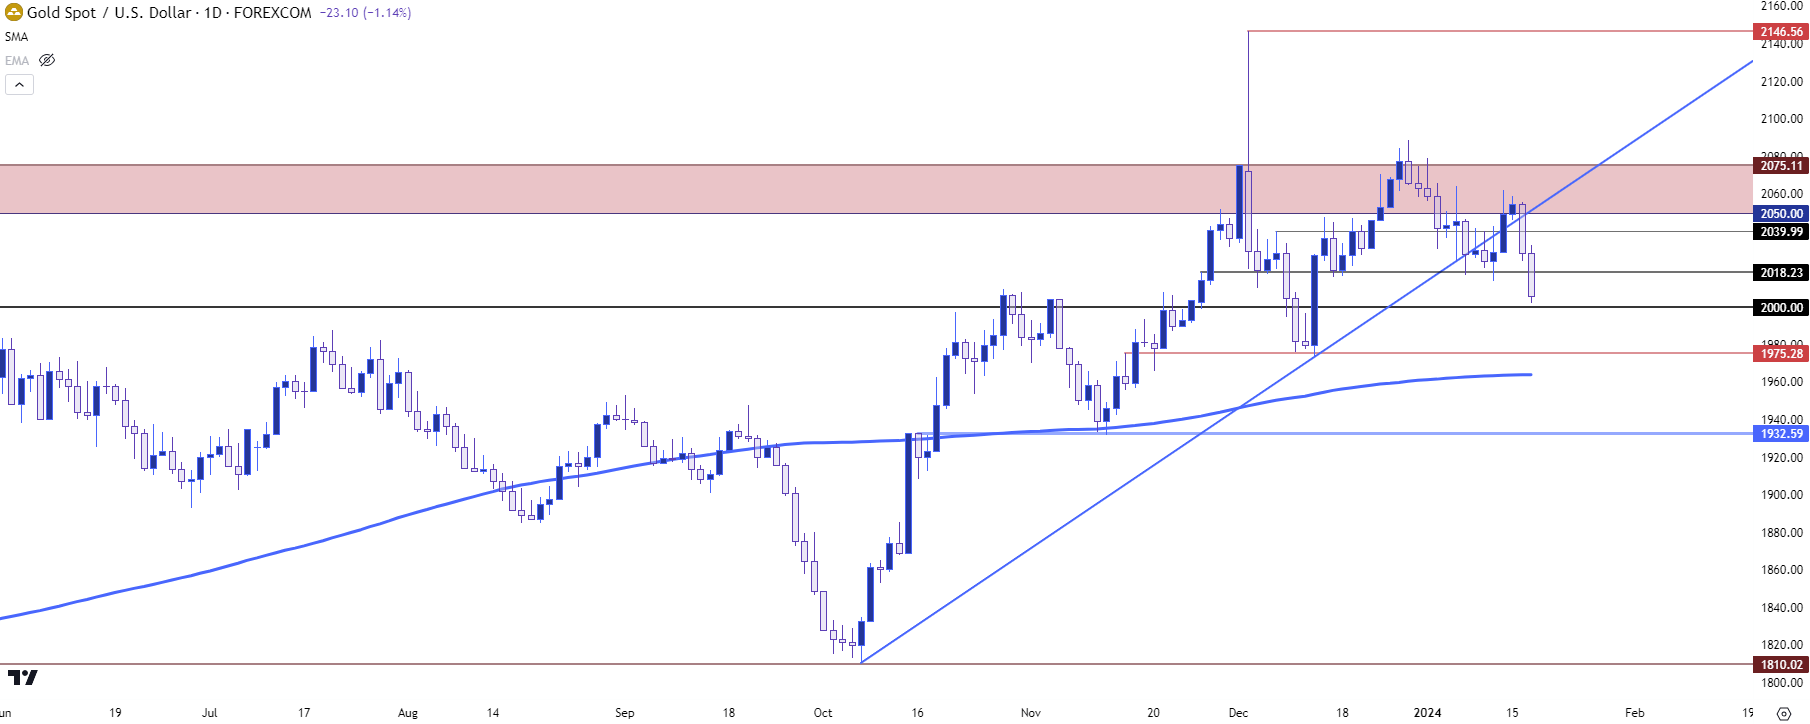 Chart prepared by James Stanley, Gold on Tradingview
--- written by James Stanley, Senior Strategist


