
US Dollar Talking Points:
- The US Dollar is working on its first green weekly bar since early-November.
- Next week brings heavy drive to the greenback with CPI to be released on Tuesday and the FOMC rate decision on Wednesday. The projections will be key here, as quite a bit has changed with market expectations for 2024 rate policy. The Fed last said that they were expecting two cuts next year, but markets are pricing in a median expectation of five to six cuts.
- I’ll be discussing these themes in-depth in the weekly webinar. It’s free for all to register: Click here to register.
The US Dollar put in some recovery this week, continuing the bounce that had started on the prior Wednesday after DXY had run into a Fibonacci level whilst going into oversold territory on the daily chart. There was also a falling wedge formation in there, and it began to give way on Wednesday as EUR/USD began to react to resistance at the 1.1000 handle. In a mirror image scenario EUR/USD had pushed RSI into overbought territory on the daily as the USD was showing oversold conditions, and in the week and change since that’s happened, sellers have had a fairly clean run; obstructed only by the confluent support zone at 1.0750-1.0766 that stalled the move for a day.
But as the calendar flips into next week there remains a bullish lean in the USD as shown from the continued pattern of higher-highs and lows.
The big item for this week on that front was defense of the 103.50 level. This was the yearly open in DXY and there’s a few other confluent items that make this a very interesting spot. The 200-day moving average remains in close proximity, and this was also a double top formation in July, just before the failed breakdown. This is also near the 50% mark of the bullish move that began in July and completed in October.
Most recently, it was resistance to close last week and the early part of this week saw bulls grinding above. And a late-week pullback dipped below that price for a bit, but buyers pulled it back and at this point it retains the higher-high and low sequencing.
US Dollar Four-Hour Price Chart (indicative)
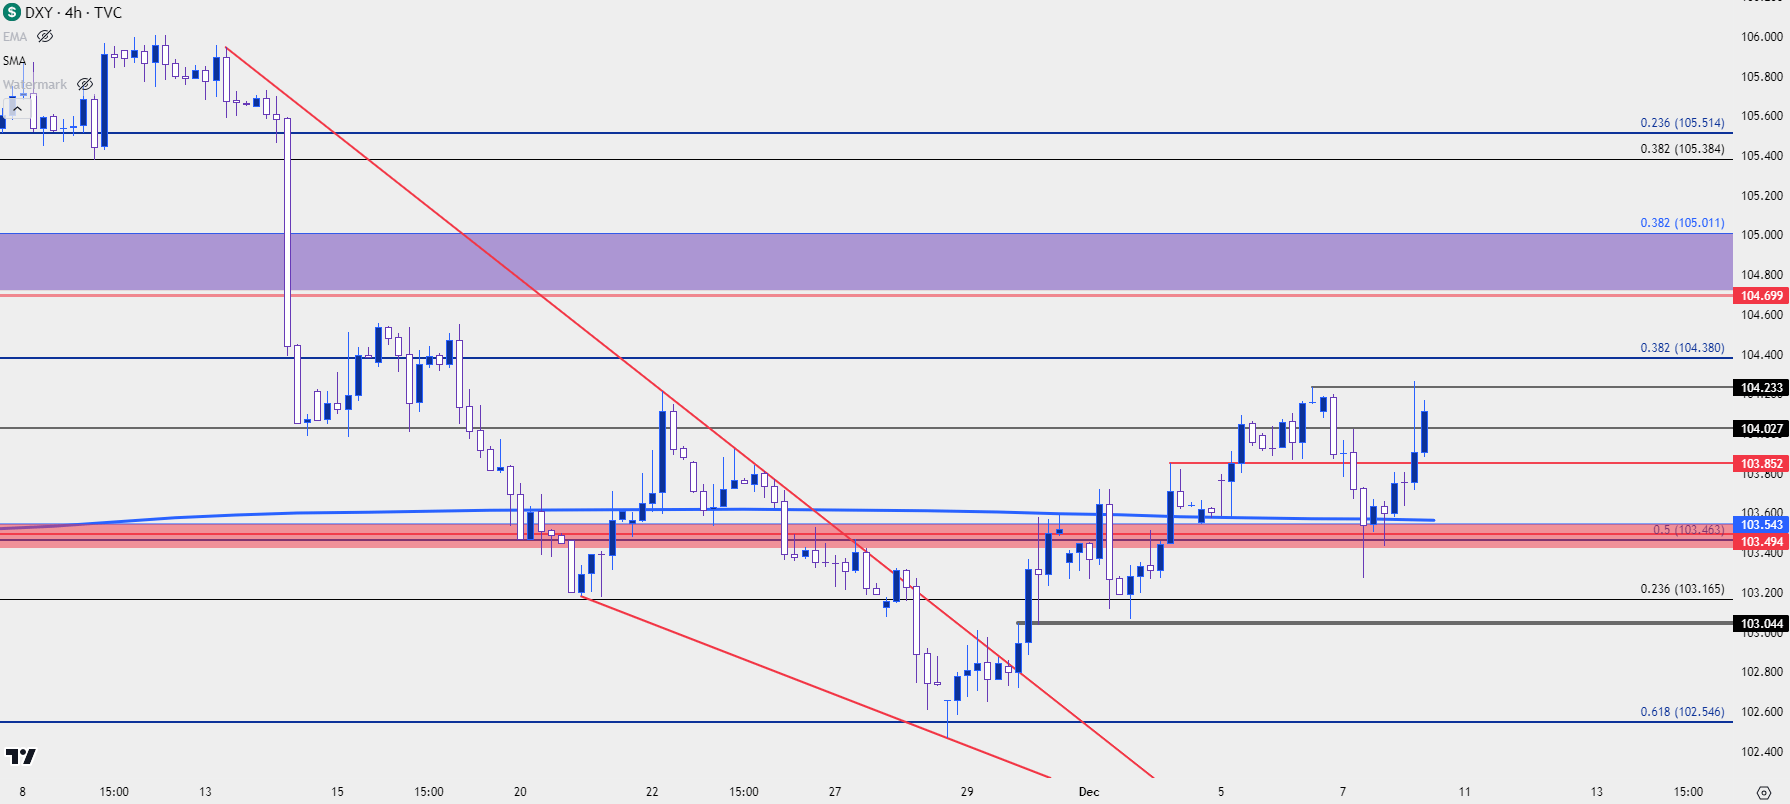 Chart prepared by James Stanley; data derived from Tradingview
From the daily chart of the USD, we can see that recent bullish move in greater scope. There could be still somewhat of a corrective feel from the daily as the bounce that’s shown so far is a mere 38.2% Fibonacci retracement of the November sell-off. And there’s a large zone of resistance sitting overhead that bulls will have to contend with should continuation show, and that spans from 104.70 up to the 105.00 handle.
But, given the calendar for next week, when both inflation and the Fed will be in full view, there certainly remains the potential for such a scenario to happen. For bulls, the 103.50 level remains important and the prior higher-low was just above the 103.00 handle. Those would be key spots for buyers to hold to keep the door open to bullish trend continuation.
US Dollar Daily Price Chart (indicative)
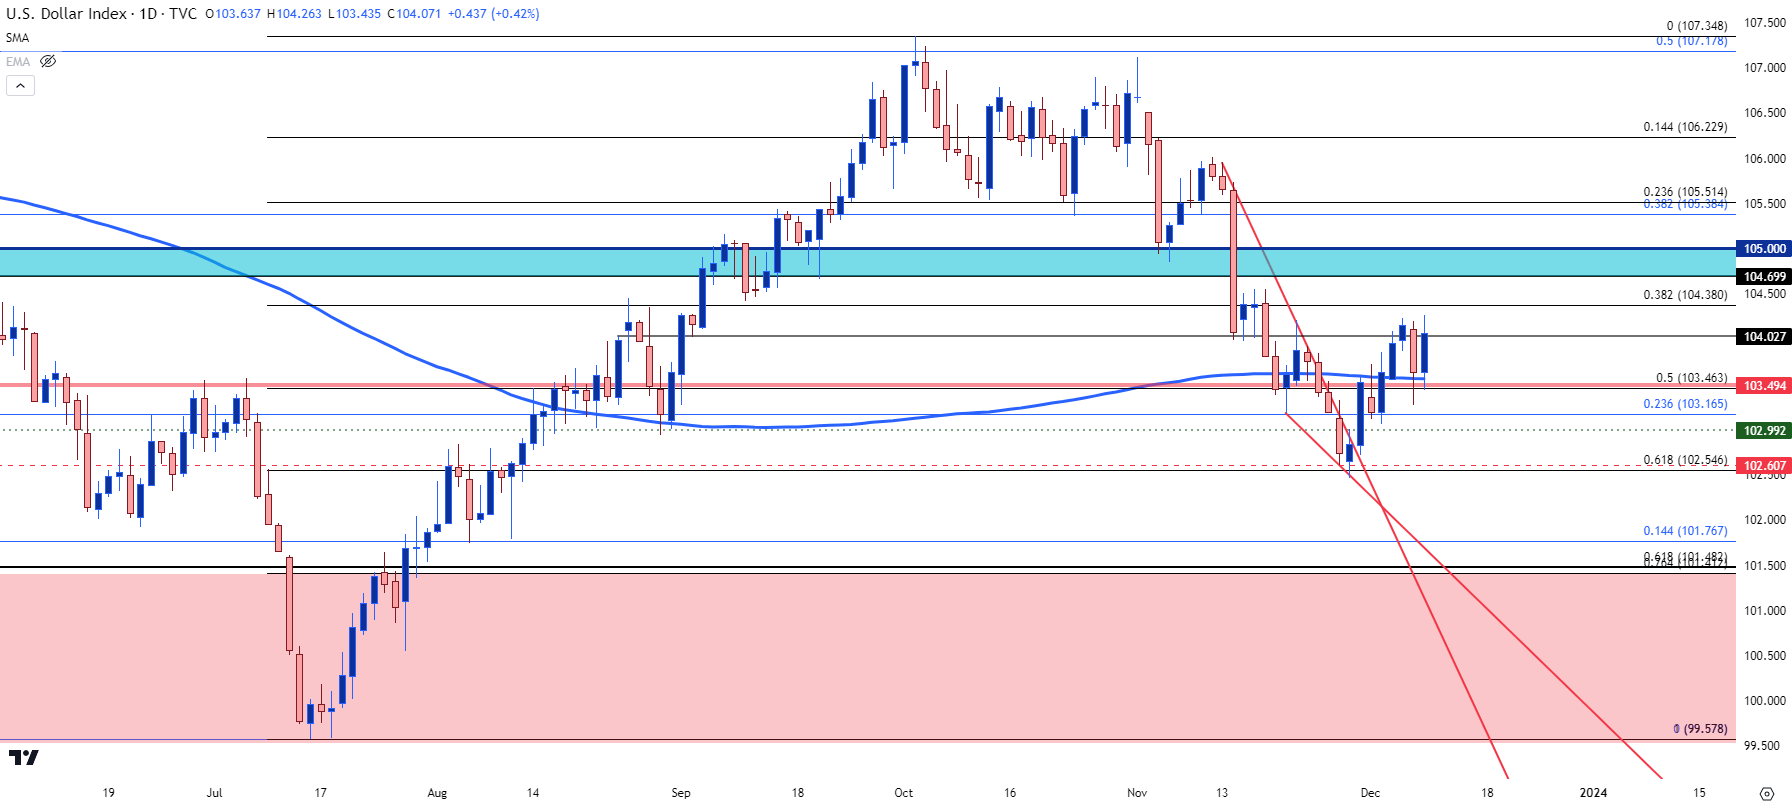 Chart prepared by James Stanley; data derived from Tradingview
EUR/USD
EUR/USD has shifted quite a bit since that 1.1000 resistance test. As mentioned above when that happened RSI went into overbought territory for the first time since July, right around when the pair had topped for this year, and it’s been pain for bulls ever since.
There was a six-day streak of losses until support finally showed at the 1.0750-1.0766 zone, and that led to a bounce on Thursday. But, that was entirely priced-out on Friday with a push after NFP as sellers stretched down for a test of 1.0733.
There’s some similarity between what the USD showed this week and what EUR/USD showed in October. In October EUR/USD came into the month with an aggressive bearish trend, but support had started to show around the 1.0500 handle and over the course of the month, it helped to hold sellers at bay. A bullish channel developed during this period but it almost felt like a begrudging bullish move as buyers weren’t able to show much stretch at resistance while also showing rigid defense of support at 1.0500.
The US Dollar had a similar feel this week, where buyers weren’t able to show much run while at highs or resistance, but the continued defense of support remained in-play. This could keep the door open for USD bulls and EUR/USD bears, particularly if the CPI data next week helps to elicit another push of USD-strength.
In EUR/USD, price is back within the channel that held for most of October trade, and this week saw a move back below the 200 day moving average. There was a lower-high at the Fibonacci level plotted at 1.0800, so this would be a spot for bears to hold to keep the door open for bearish continuation. The next support zone is a confluent spot which sets between 1.0638 and 1.0666.
EUR/USD Daily Price Chart
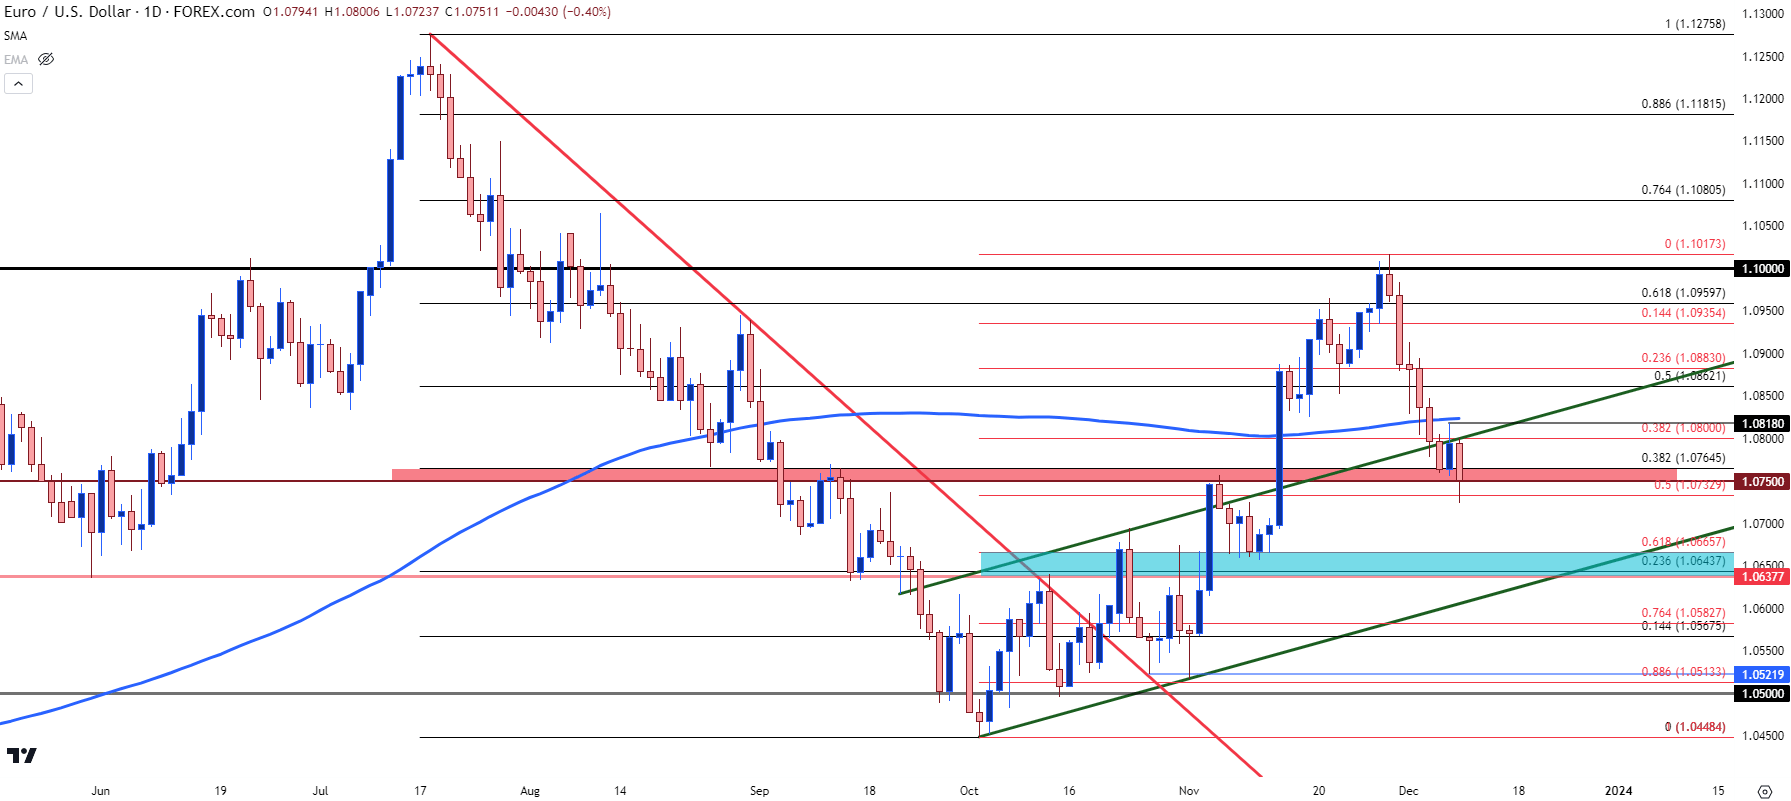 Chart prepared by James Stanley, EUR/USD on Tradingview
USD/JPY
This market is loaded in either direction, in my opinion.
If the US Dollar is going to stage a larger sell-off, USD/JPY could be one of the more attractive markets to work with. And we got a glimpse of that this week, even as the US Dollar held some relative strength, as an aggressive pullback showed in USD/JPY after some comments from Kazuo Ueda. There’s only been slight hints that change may be on the horizon for Japan, but after years of carry trades building it would be logical to assume that there remains a heavy long position across markets as driven by that rate divergence.
And much like we saw last Q4, if there’s a rising risk of principal losses, those carry trades can bail very quickly, and that can lead to sharp downside moves. There’s even been some similarity with Q4 of last year and what’s shown so far: Last Q4 USD/JPY began to stall in October before beginning a reversal in December. This year, a CPI print released in November also brought out the bears but the difference this year has been that the move has built in a constructive fashion, as opposed to a violent CPI-fueled breakdown.
The big change this week was insinuation that the BoJ may be ready to leave their negative rate policy. Those comments hit the wires on Wednesday night/Thursday morning and this led to a major sell-off in USD/JPY as the pair posted its worst day since December of last year.
But, as looked at above, the US Dollar held support at 103.50 and that helped to pull the pair back from the proverbial ledge. As of this writing USD/JPY is re-testing the 145.00 resistance zone. There’s follow-through resistance at 145.90 and then prior support that gave way to that breakdown move at 146.66.
USD/JPY Four-Hour Price Chart
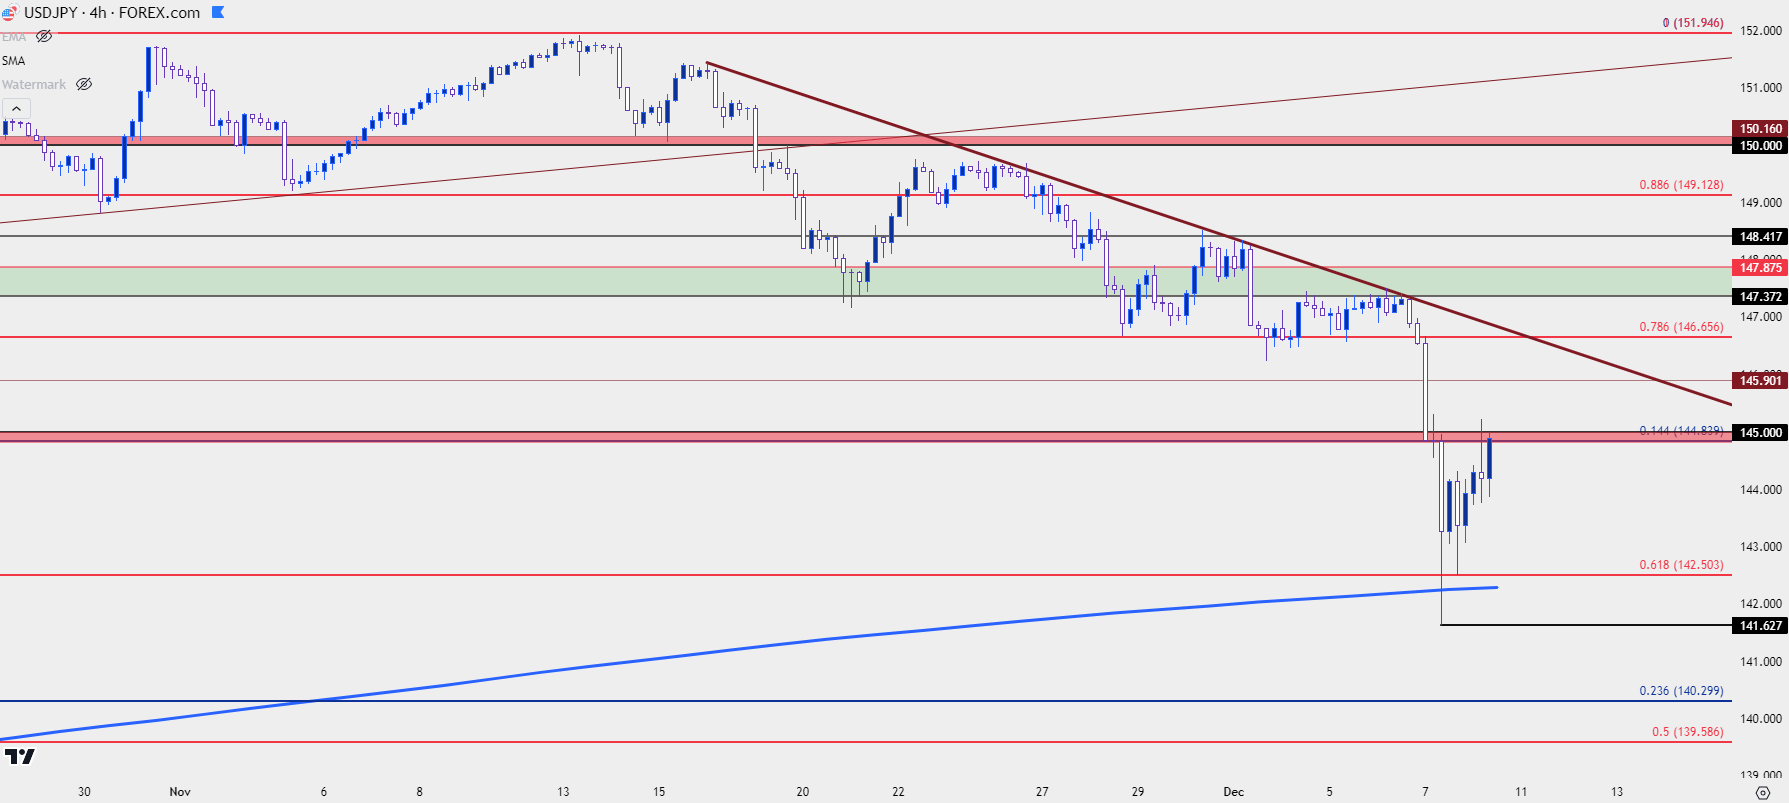 Chart prepared by James Stanley, USD/JPY on Tradingview
From the daily chart below, trend tendencies can be seen a little more clearly, while also illustrating the danger of chasing even what had been a strong breakdown move. The bounce from the lows is currently more than 300 pips, and when a market is stretched, the pullbacks can similarly take on larger scope. And this isn’t the first aggressive bullish bounce to show in an otherwise bearish cycle.
This can keep focus on resistance potential at that 145.90 and 146.66 spot. Notably, the Bank of Japan rate decision is the week after the FOMC and if the BoJ does begin to make the initial hints that change may be afoot, then the Yen-side of the pair could continue to draw interest such as we saw this week.
USD/JPY Daily Price Chart
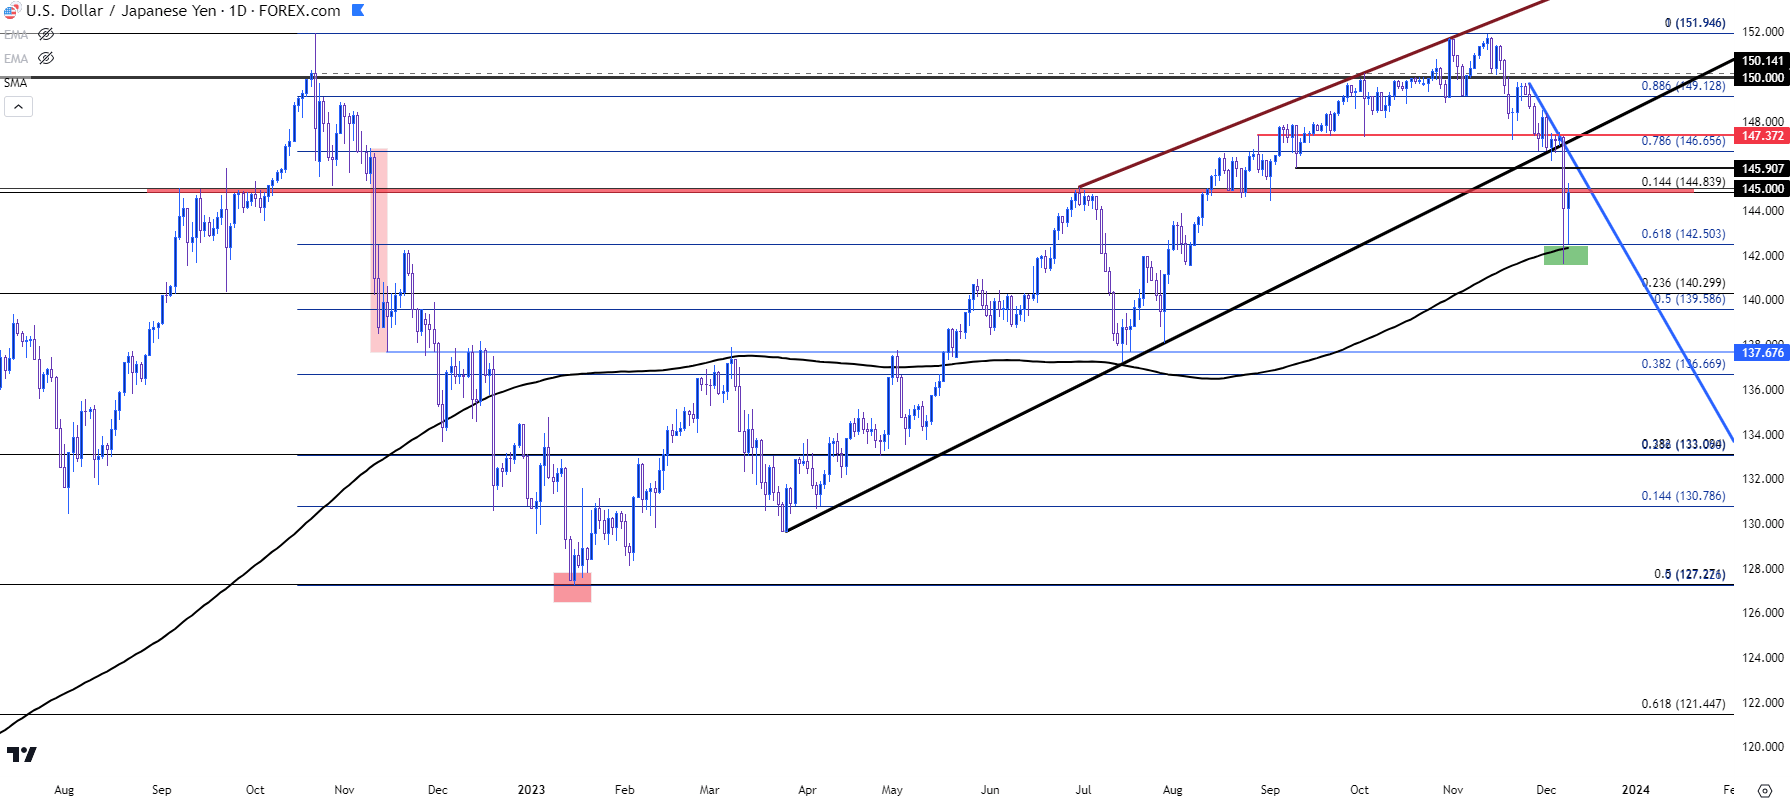 Chart prepared by James Stanley, USD/JPY on Tradingview
AUD/USD
Commodity currencies were particularly strong during that streak of USD-weakness, and in AUD/USD this allowed for a fresh four-month high in the opening days of December trade. And before that burst of strength, the pair had shown choppiness in two different ranges: From .6385-.6500 through August and September, and then from .6285 and .6385 through much of October.
AUD/USD Weekly Chart
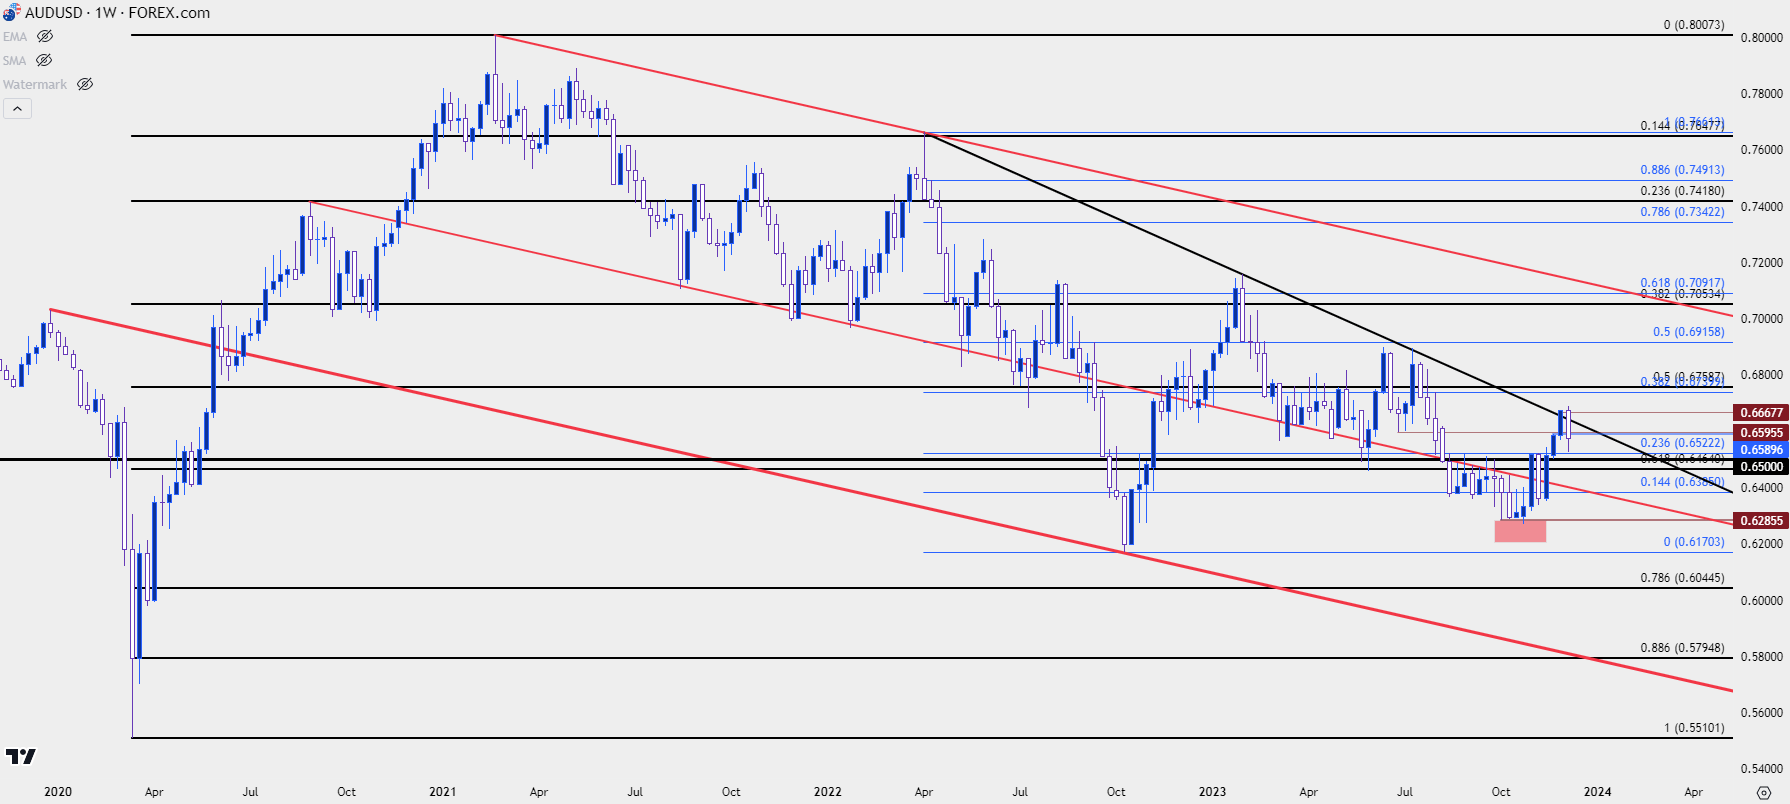 Chart prepared by James Stanley, AUD/USD on Tradingview
Aussie bulls began to come to life in November after the FOMC rate decision, and forced an initial higher-high up to the Fibonacci level at .6522. After a higher-low, bulls then began to stretch the move, running all the way into the end of last week.
This week has been pullback from that and this puts focus on a zone of potential support as taken from prior resistance. There are Fibonacci levels at .6464 and another at .6522, with the .6500 psychological level in-between. If bulls show up to hold the higher low between .6500-.6522, that could carry a greater sign of aggression, although a dip down to .6464 could still keep the door open for bullish trend continuation.
This could be one of the more enticing pairs for bearish USD-scenarios, to go along with the USD/JPY setup looked at above.
AUD/USD Daily Price Chart
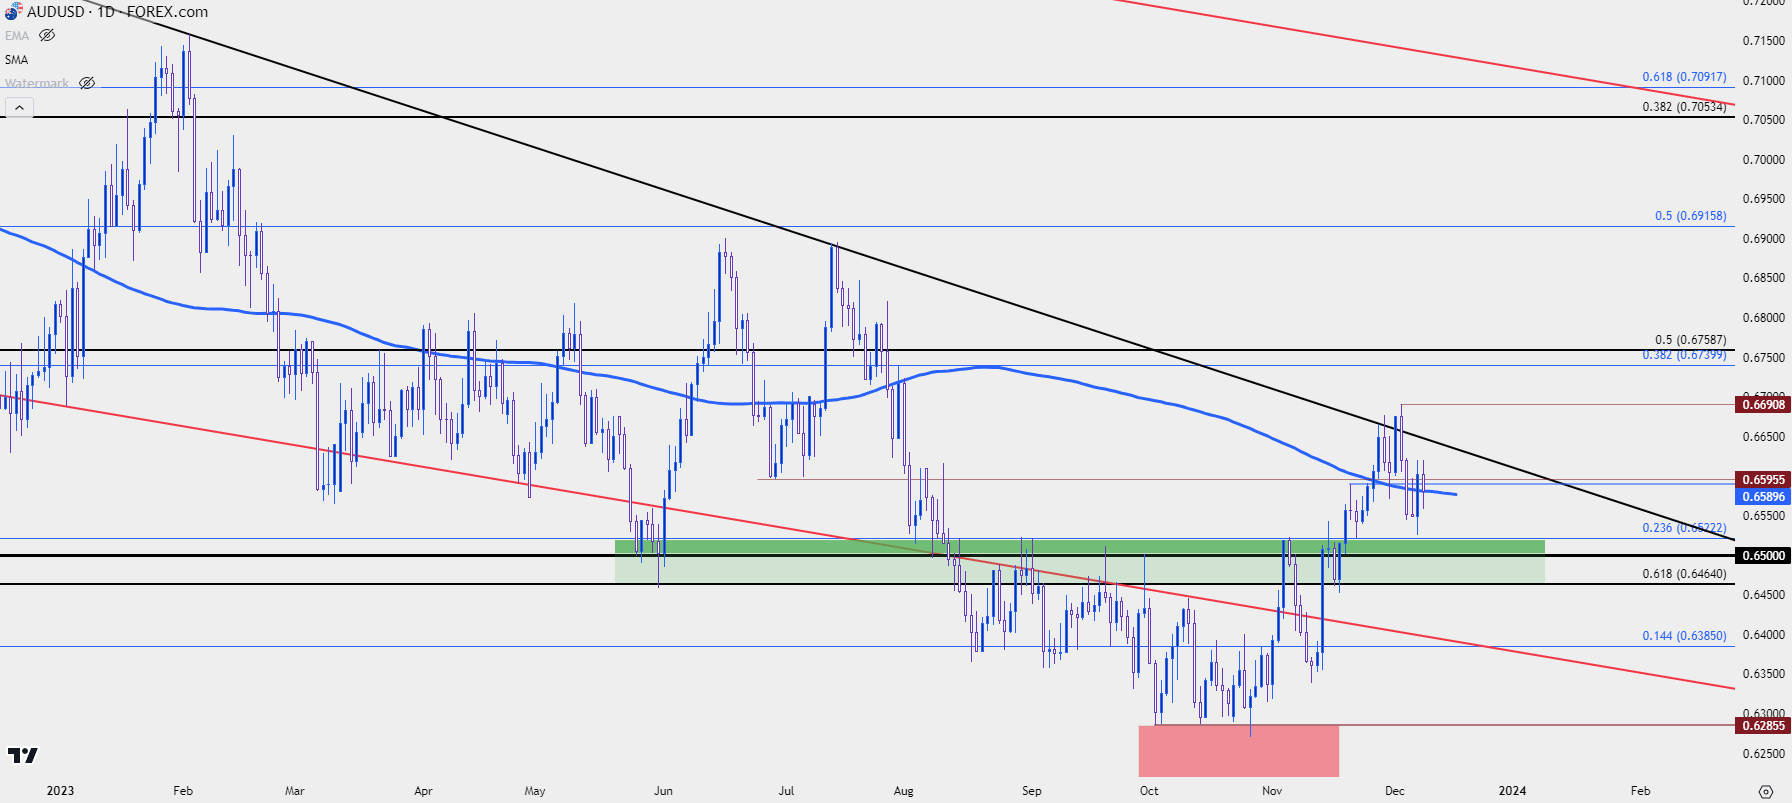 Chart prepared by James Stanley, AUD/USD on Tradingview
Gold
The week started with a bang but is ending with a whimper.
Gold closed last week right at resistance and then broke out to a fresh all-time high to begin this week; but very soon after prices began to peel back and, well, that lasted for much of the rest of the week. There was a range that had built in-between and had held Tuesday through Thursday until, eventually, sellers went for a push back-below the $2k psychological level after the NFP report on Friday.
So, first things first, the below weekly bar is currently showing as both a bearish engulf and a large, outsized reversal bar given the elongated wick from earlier in the week. This is a bearish outside bar combined with a possible capitulation scenario given the reaction to fresh highs.
Gold Weekly Price Chart
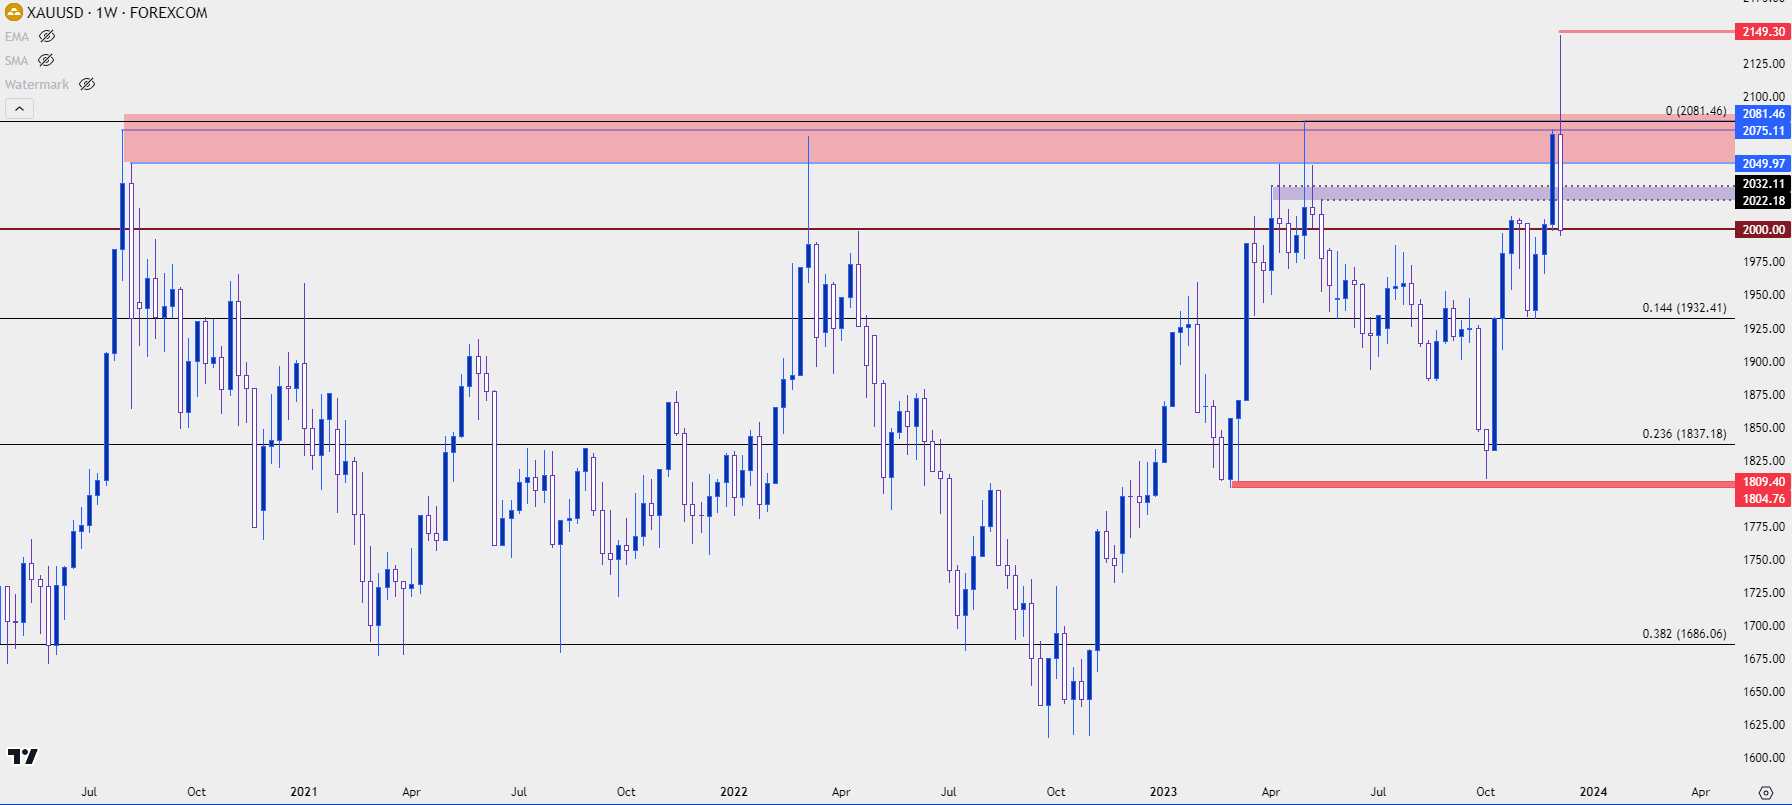 Chart prepared by James Stanley, Gold on Tradingview
Gold Shorter-Term
Gold has shown a few different bear traps this year, and it can be argued that the bottom of the move that led into that breakout was such a scenario. In early-October, Gold had moved to historically oversold levels. I wrote about it at the time, with daily RSI pushing below 20 for only the fourth time in the past 22+ years.
On the morning of NFP Friday in early-October, sellers even went for the breakdown, setting a fresh six month low before prices started to pull back; and that then led into a massive move at the next weekly open and bulls have largely been in-charge ever since, save for a pullback in early-November that launched higher after CPI data was released.
At this point with a wide weekly range and a push back-below the $2k level, there could be a number of bearish tendencies showing. And on a short-term basis price is fast moving towards oversold territory, which certainly does not preclude bearish continuation, but it does illustrate how this recent theme has come on rather quickly. And it also begs the question as to whether another bear trap may be brewing.
Next week could have more evidence on that front. For resistance, there’s a spot at 2009 that remains of interest, and then we have the same zone between 2022 and 2023 that was in-play for much of this week. If bulls can stretch above that, 2040 comes into the picture and over-taking that would be a strong response to the $2k test.
Gold Four-Hour Price Chart
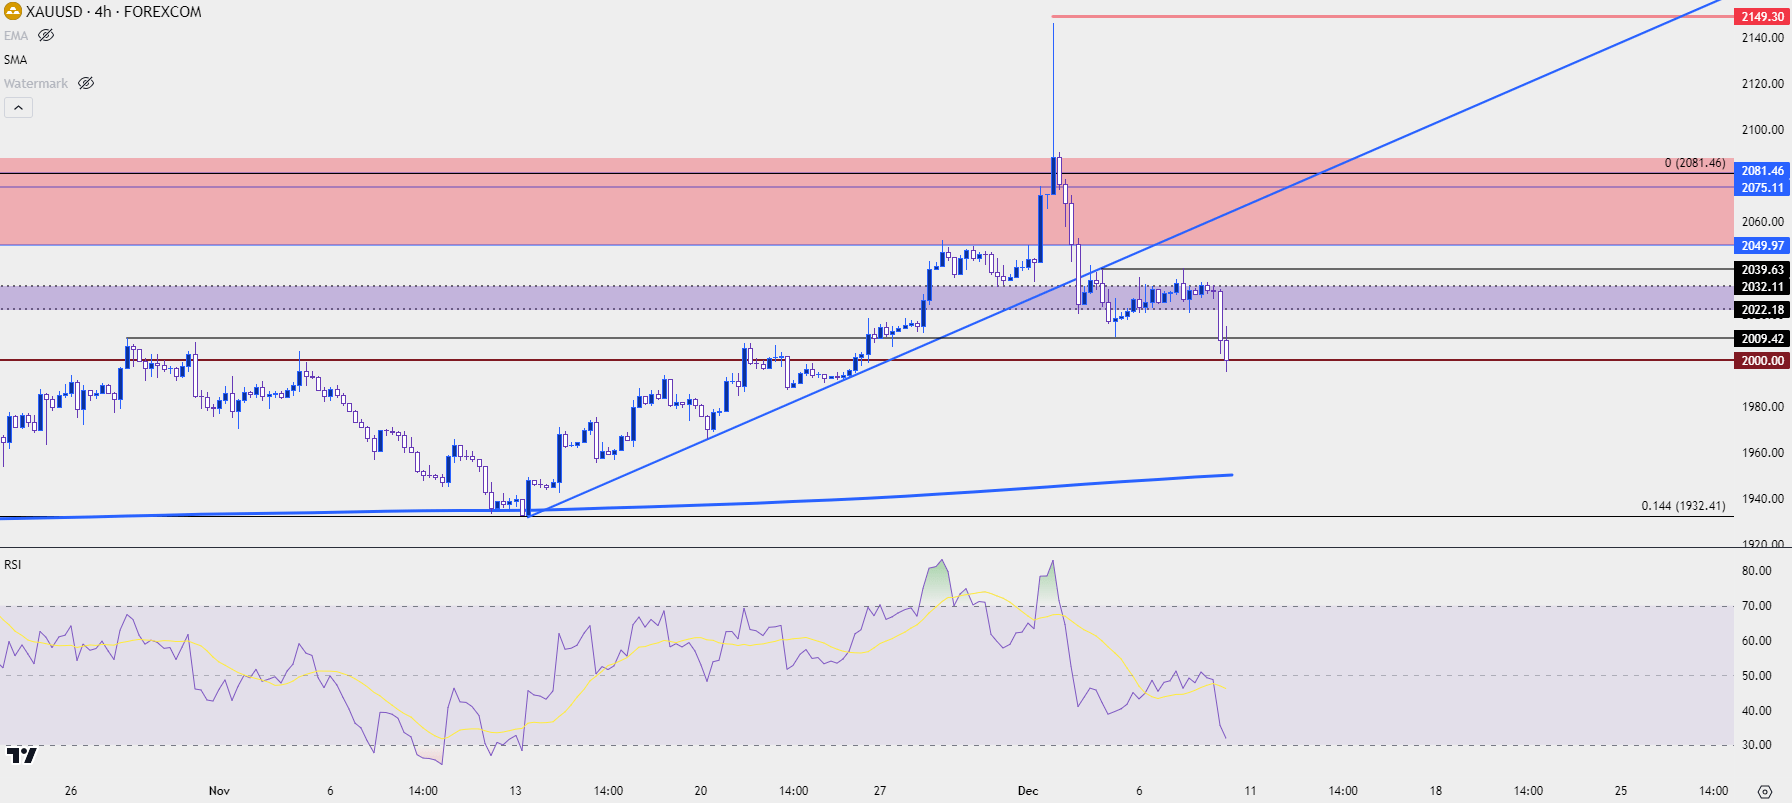 Chart prepared by James Stanley, Gold on Tradingview
--- written by James Stanley, Senior Strategist


