
US Dollar Talking Points:
- The US dollar pushed down the support looked at in last Tuesday’s webinar a day later, and that has since held the low as a bounce has begun to develop.
- While there’s numerous similarities to last year’s Q4 in the way that the US Dollar broke down in November, there are some key differences, as well, and that can have bearing on price action across FX majors as we move towards the end of the year.
- The next week is very busy across markets, particularly for the USD and this can have connotations elsewhere: This Friday brings NFP, next Tuesday brings CPI, and then Wednesday brings the final FOMC rate decision for 2023. Perhaps most important at that meeting are the Fed’s projections, which had previously forecast two cuts for 2024 while markets are currently expecting five or possibly more.
The US dollar continues to push for recovery. The chart looks different from last week, and in that webinar, I had highlighted a confluence of factors in both the USD and EUR/USD that could soon have bearing. And since then, they have.
Last week the US dollar saw daily RSI dip into oversold territory for the first time since July. July, of course, is when bears attempted to push a breakdown but they were quickly offset by bulls, leading into a pattern of 11 consecutive weeks of gains for the Greenback. That held into October trade, at which point stall began to show (along with overbought readings via daily RSI) and that put bulls on their back feet as we walked into November trade. And November had a markedly different outlay, as bears went to work on the first day of the month, around the FOMC, and largely remained in chart until last week’s webinar.
Support finally appeared at the 61.8% Fibonacci retracement of that bullish move that began to build in July. There was also a falling wedge formation, often tracked with the aim of bullish breakouts.
Buyers have since pushed a topside move and as we can see from the daily chart below, price has moved off that oversold backdrop and bulls are making a forward push through the 104.00 handle. In the webinar, I had highlighted 104.03 as a nearby resistance level and the next level of note is the Fibonacci level at 104.38.
US Dollar Daily Price Chart (indicative)
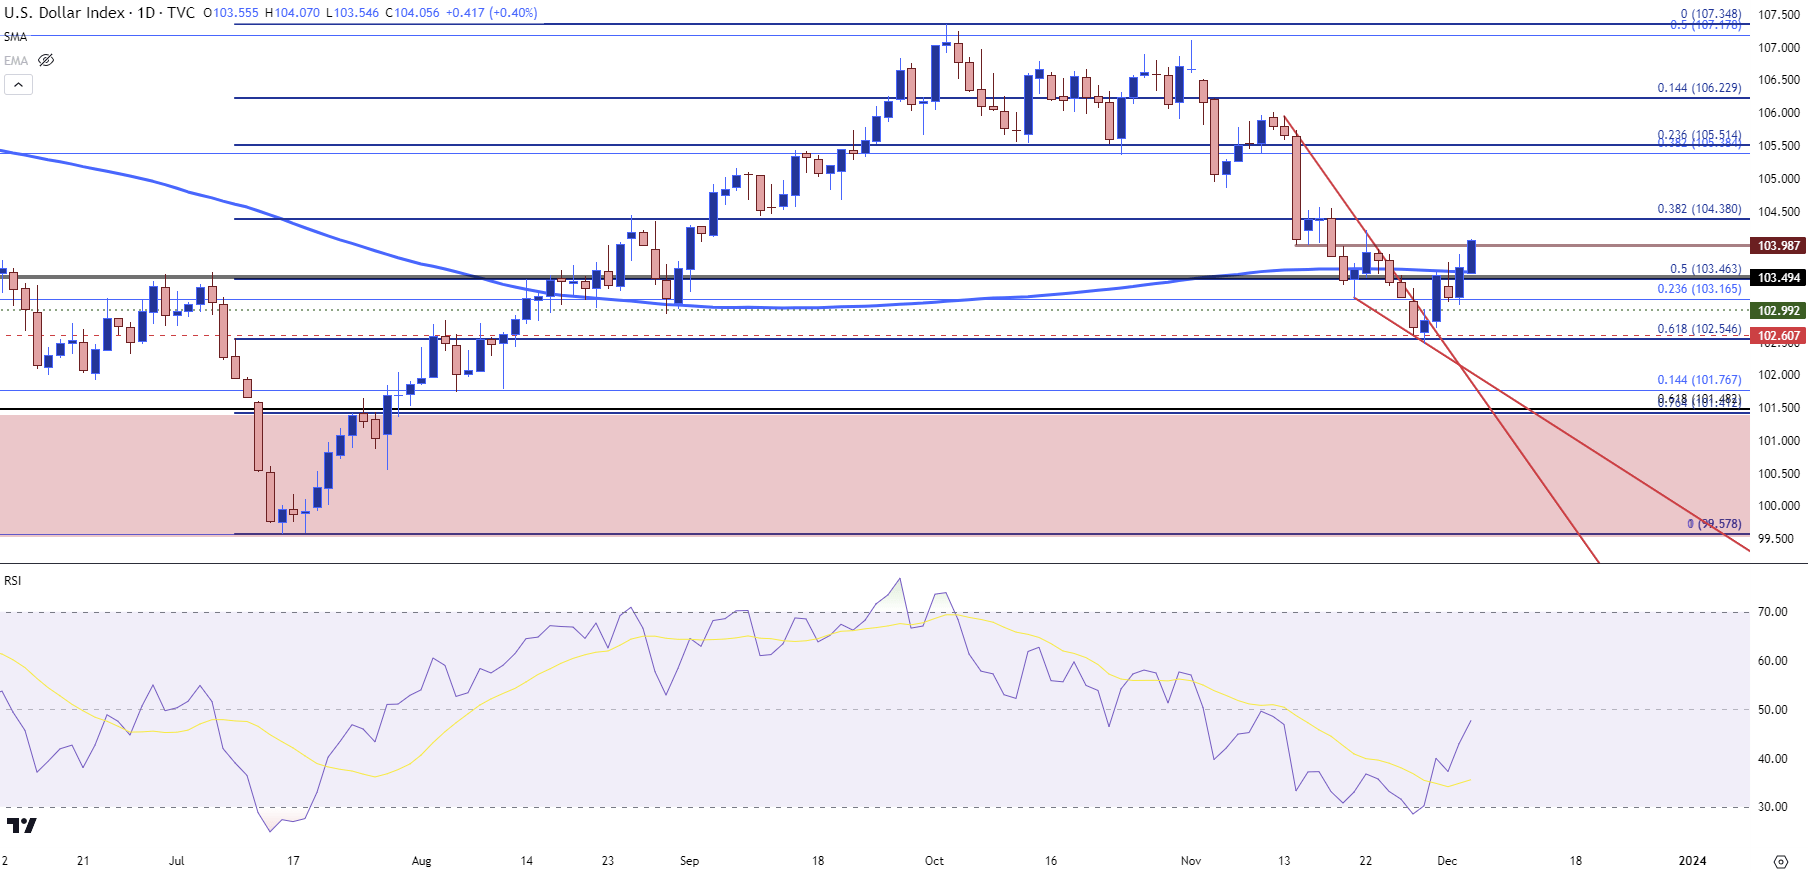 Chart prepared by James Stanley; data derived from Tradingview
EUR/USD
There’s going to be quite a bit of mirror image dynamics here as I had discussed last week. While the US dollar went oversold, EUR/USD went overbought. The pair also ran into the 1.1000 psychological level, which is a big area, historically speaking.
The 1.1000 level had traded on Tuesday around the last webinar. It had another test on Wednesday but that’s when sellers started to re-appear, and they’ve largely been in-control ever since. Price is now making a fast move to the next key support zone, which I’m tracking around the 1.0750 psychological level which syncs up to the 1.0766 Fibonacci level.
This zone came into play after October NFP to hold the highs, which led to the build of a falling wedge that eventually broke out on the back of CPI last month.
EUR/USD Daily Price Chart
 Chart prepared by James Stanley, EUR/USD on Tradingview
GBP/USD: Cable 2x Resistance
Cable has been clean, of late. Last week I looked at a resistance zone that was sitting just above current price. The zone runs across three Fibonacci levels in tight proximity and this zone came into play a day later, on Wednesday. The daily bar of GBP/USD built a doji after the first test, with a noticeable sell-off showing on Thursday. This completed an evening star formation which is often approached with aim of bearish reversal, and this is the mirror image of the two morning starts that showed up in November on the daily chart (shown in green below).
Initially, there was no follow-through on the evening star; buyers posed a push right back to that resistance zone which held the weekly close and into this week’s open.
Invalidation for an evening star is when the high is taken out, so it was close, but bulls never took out the high and the formation remained in-play. Since then sellers have started to take their shot and we now have a breach of Fibonacci support at 1.2590. This puts the focus on deeper supports at 1.2548 and then the 1.2500 big figure. In the webinar I shared a bit more context on the pair.
GBP/USD Daily Price Chart
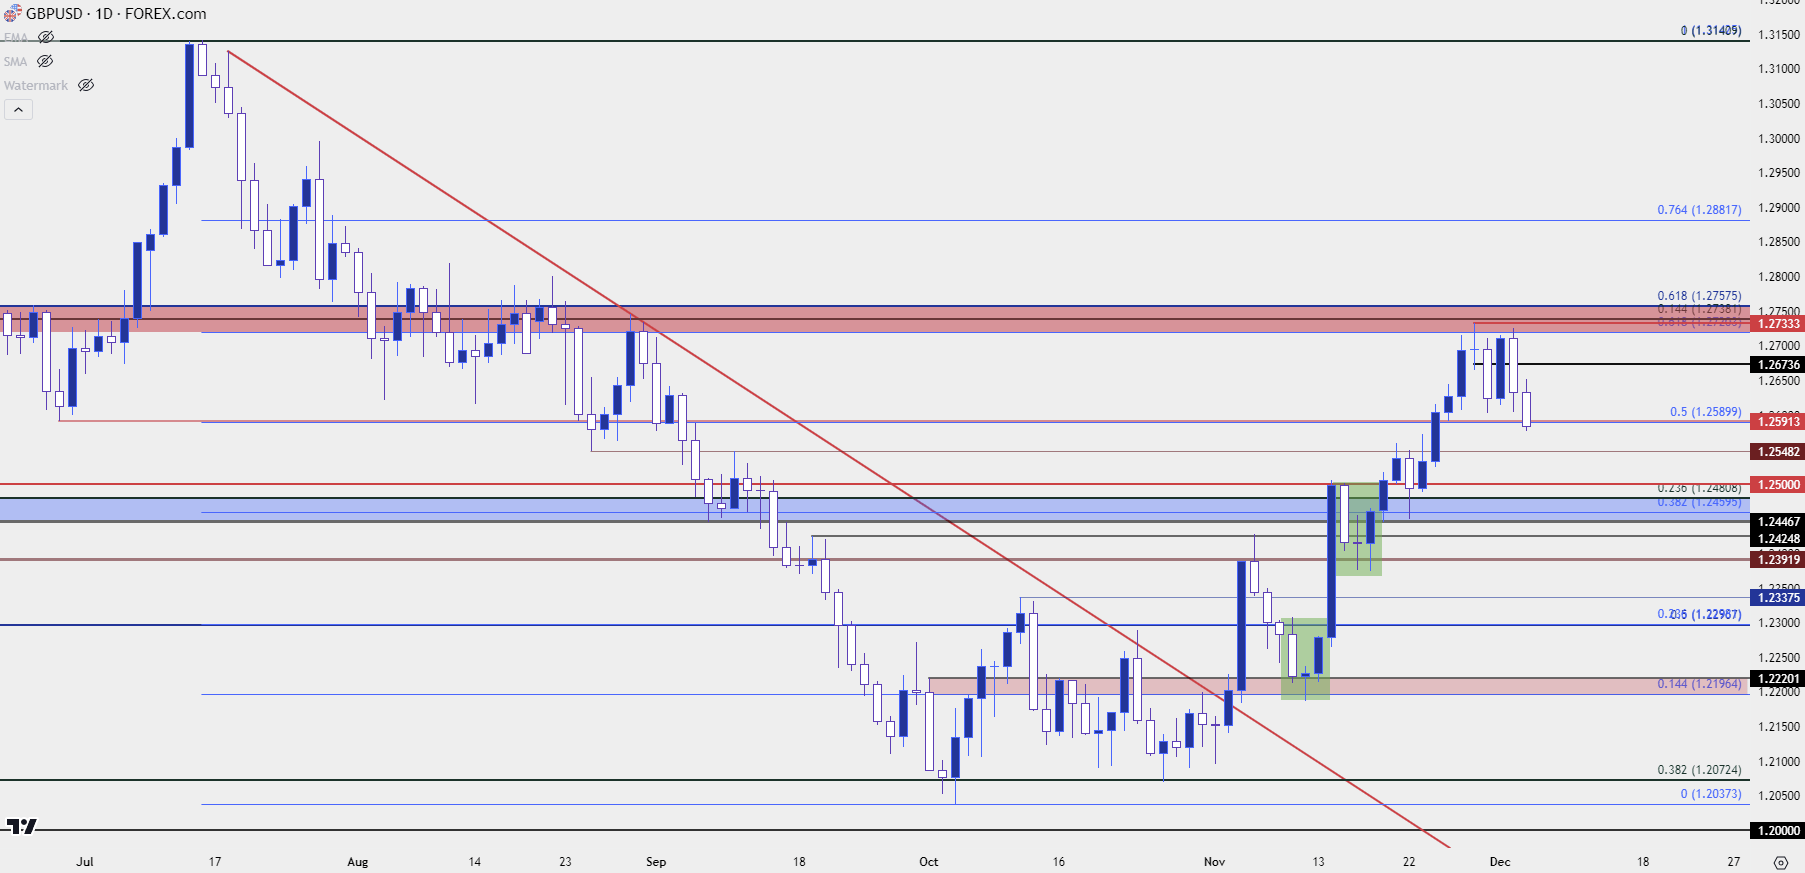 Chart prepared by James Stanley, USD/CAD on Tradingview
USD/JPY
If there’s a larger sell-off in the US dollar, USD/JPY could be vulnerable. But with USD bears taking a step back from the proverbial ledge there’s been a degree of cooling off in USD/JPY, as well.
But – notably – the strength shown in USD/JPY doesn’t appear to match that of DXY, which indicates that there has been an element of Yen-strength taking place. The bigger question, however, is whether those carry trades might get another prod of motivation to close and unwind; and if there’s a greater expectation for USD-weakness, that could play. This would be similar to last November, when USD/JPY pushed a massive bearish breakdown after the CPI data that was released on Nov. 10th.
This year produced a similar backdrop from a macro perspective, with the USD breaking down on the back of a below-expectation CPI print: But the price action does not mirror what happened last year in USD/JPY.
As a matter of fact, USD/JPY has been grinding at that 146.66 support level that I had looked at last week. And as drawn in the webinar, there’s been the build of a falling wedge here. So, if the USD does not tank like it did last Q4, there could be residual strength in the pair and if this falling wedge yields to breakout, we could be looking at a 150.00 re-test.
On the underside of price action, 145.00 seems to be important still, and this was the line-in-the-sand last year that got broken on the morning of November 10th, and that led to an aggressive breakdown move.
USD/JPY Daily Price Chart
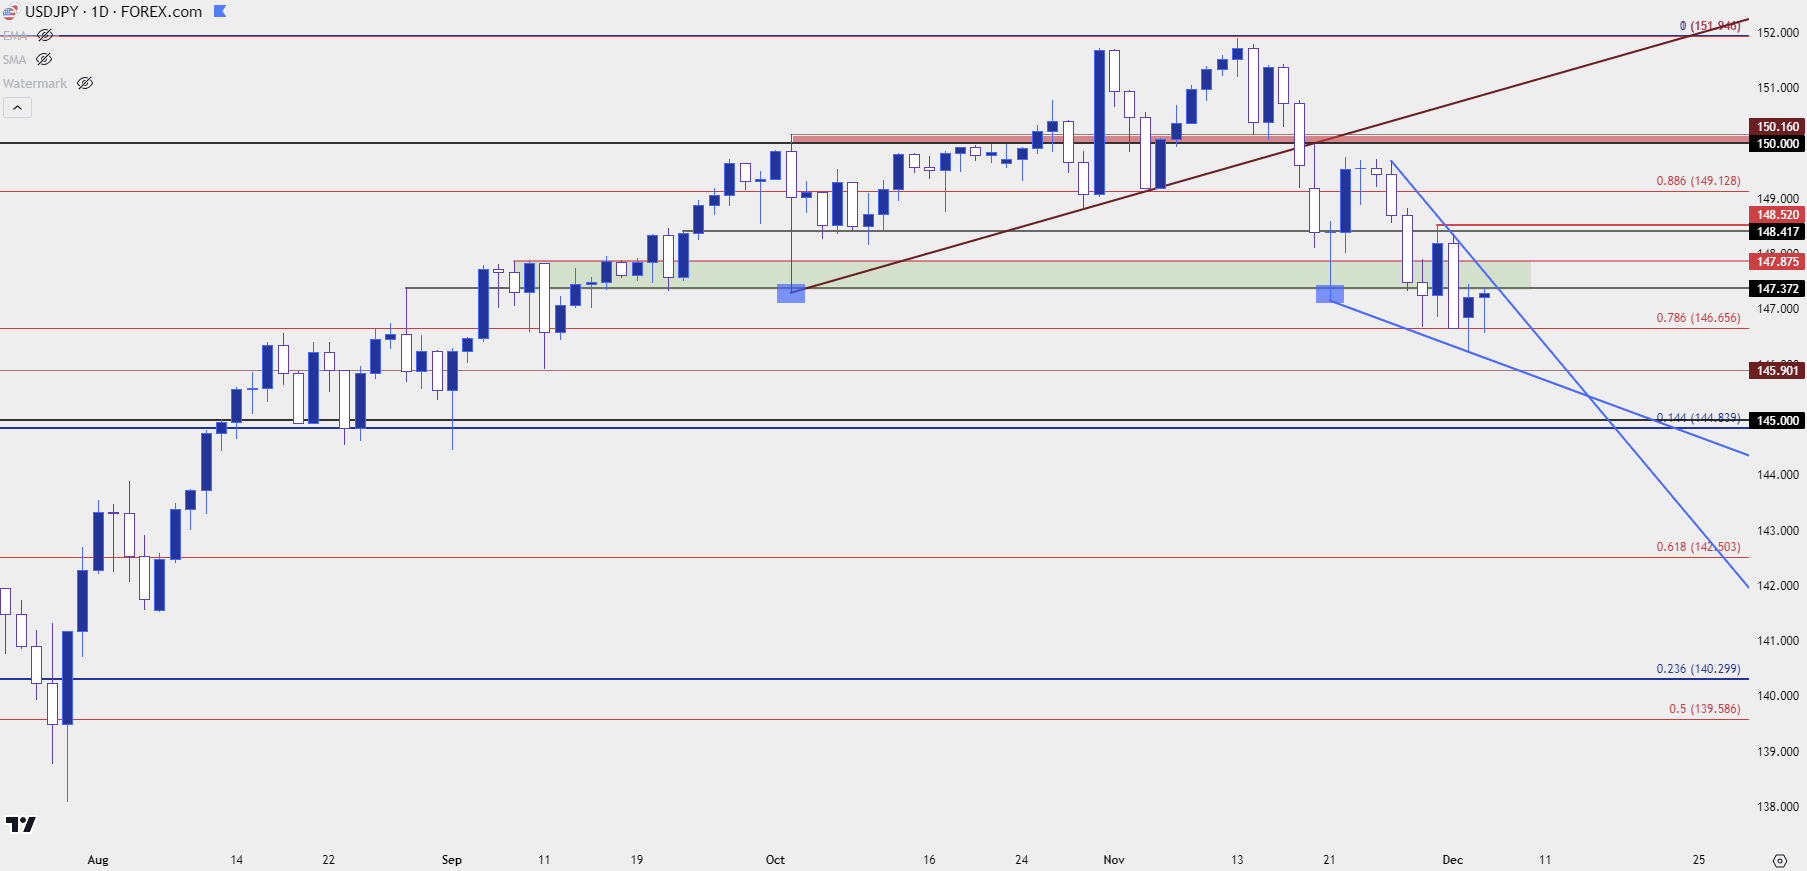 Chart prepared by James Stanley, USD/JPY on Tradingview
USD/CAD
USD/CAD was in a bearish state last week after having seen a resistance test at the Fibonacci level of 1.3652. During the webinar last week, I was highlighting a lower-high resistance test at 1.3623-1.3630 which has since yielded to a greater breakdown, with support ultimately showing around the 1.3500 psychological level.
The daily chart still has a bearish look as given the fresh lower-low after a lower-high; but the question is whether sellers will return to continue that short-term trend inside of the longer-term symmetrical wedge formation. The same resistance as last week could function as that spot, but the 1.3652 level may not be done yet for 2023 trade after it’s shown up in multiple ways throughout the year.
USD/CAD Daily Price Chart
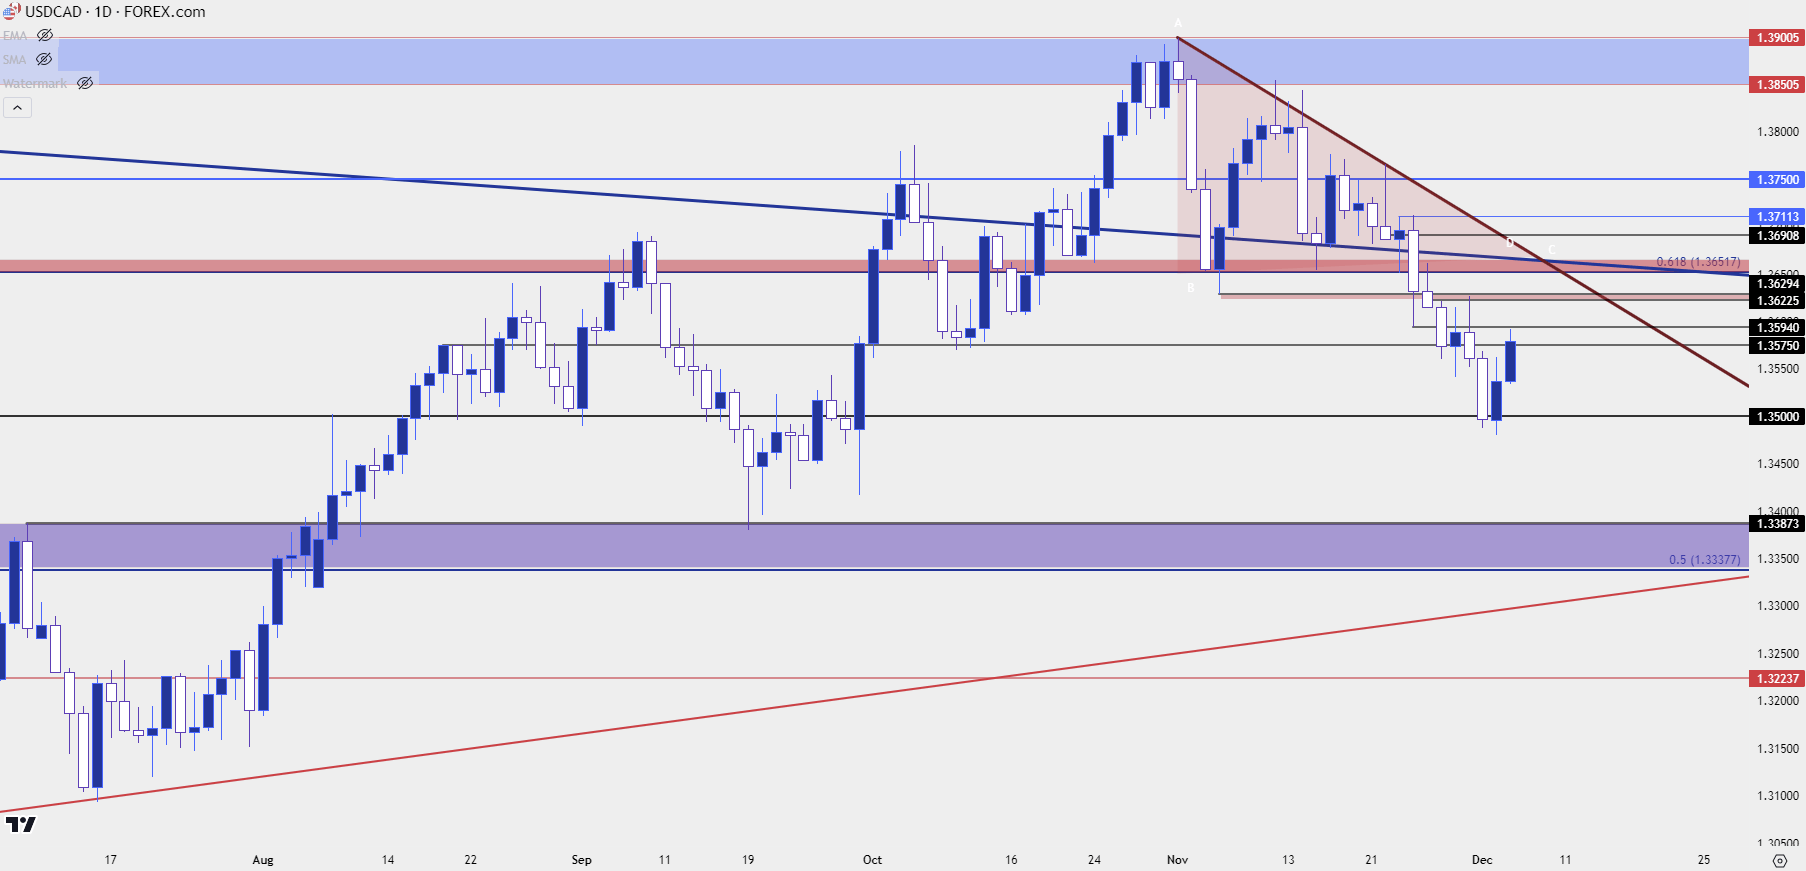 Chart prepared by James Stanley, USD/CAD on Tradingview
Gold
Gold opened with loudness this week, rushing up to a fresh all-time-high on Sunday night amid thin liquidity. The move was quickly faded and at this point it’s been entirely erased as price has posed a brisk pullback to just above the $2k level.
From many charts that outlay looks like a nasty reversal setup. But, this could be a dangerous read as there may have been something else going on around that open, and I shared my opinion in the webinar. For gold strategy, structure remains important, and there has been a show of buyers re-entering over the past day and change.
Yesterday the 2022 price marked the low, which led to a bounce. This morning sellers pushed below that 2022 level but then found some support around 2017. It’s still early – but the aggression with which the sell-off was pricing in has waned.
So, while it would be simple to walk away from a look at the weekly or daily and think that this has reversal written all over it, like most things trading, it isn’t so simple. The 2k level remains huge and if sellers can push below that by the end of the week, then that would be a meaningful show from bears. But while above the 2k handle, things can shift quickly so that’s going to remain a big spot.
Gold Four-Hour Price Chart
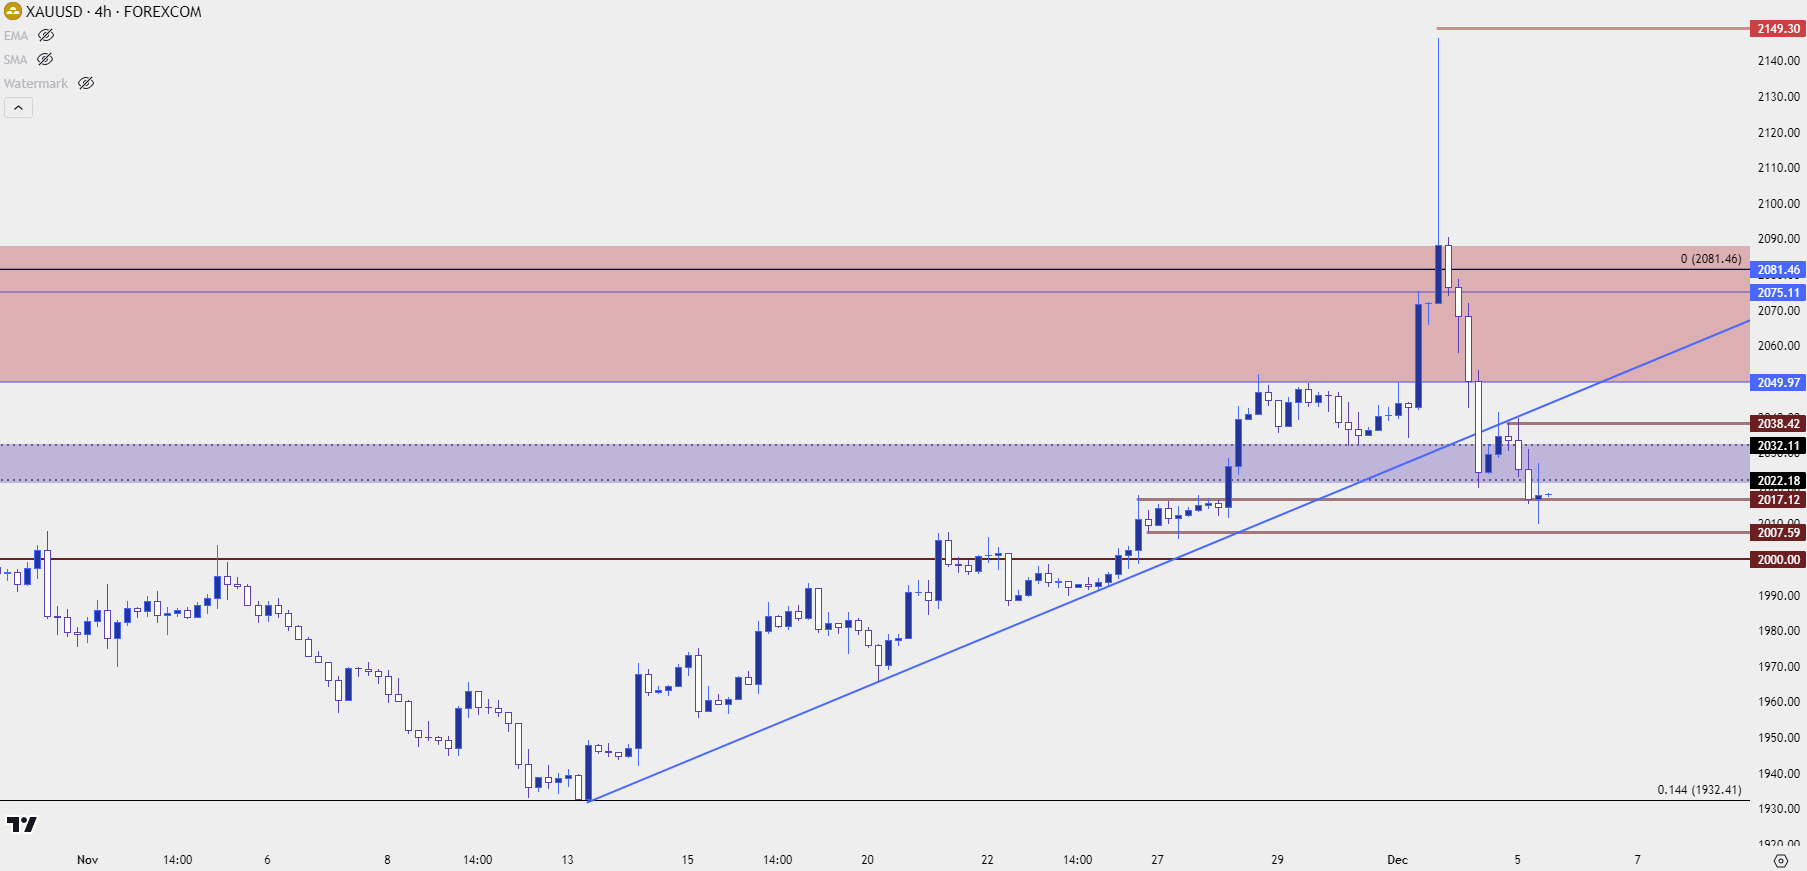 Chart prepared by James Stanley, Gold on Tradingview
--- written by James Stanley, Senior Strategist


