
US Dollar Talking Points:
- The US Dollar (DXY) is currently showing as a doji on the weekly chart, although there were a couple of twists and turns in USD price action over the past week.
- A number of major pairs and markets remain at key points:EUR/USD continues to test the 1.1000 handle, GBP/USD with 1.2500. USD/JPY put in a strong breakout after the BoJ on Thursday night/Friday morning. And the prior highflyer for USD-strength of USD/CAD has finally started to pullback after running into a major Fibonacci level.
- I’ll be discussing these themes in-depth in the weekly webinar on Tuesday at 1PM ET. It’s free for all to register: Click here to register.
Last week I highlighted the double bottom formation that’s started to build in the US Dollar. It’s still early-stage and the sell-off in the Greenback has been rather aggressive since the currency topped last September; but the question remains as to whether the USD has bottomed, and this week brought some additional context to the matter that I’ll explore a little later.
More immediately: Next week’s economic docket is absolutely loaded with high-impact macro items or data releases scheduled for every day next week. The week starts with US Manufacturing PMI numbers on Monday, followed by the RBA (Reserve Bank of Australia) and Euro inflation figures set to be released on Tuesday. Wednesday is a big day for the US, with the release of services PMI numbers in the morning and the FOMC rate decision later in the day. And then on Thursday, we hear from the ECB and expectations are high for continued hawkishness there, as we’ve heard from multiple ECB members of late. And then on Friday, we get both Canadian and US jobs to be released at 8:30 AM.
It’s somewhat unusual to have so much macro activity in a single week but this is also happening amidst several important corporate earnings releases in the US, with Apple reporting earnings on Thursday after the close, making for an especially pensive backdrop leading into the Friday morning release of Non-farm Payrolls alongside Canadian jobs numbers.
This is the type of week when new trends can establish themselves. It’s also the type of week that can produce topsy-turvy breakouts that fail to continue as there’s so much new information getting priced into markets at the same time. So, it’s important to acknowledge the risk element, because as more variables are up in the air, this could equate to a more difficult prospect of riding a trend as there’s just that much more opportunity for disruption. But the greater potential for volatility can also provide additional motive for swing traders; and as always in markets, risk and reward remain intertwined variables.
The US Dollar
It was an especially noisy week for the USD, so I wanted to start here from the big picture. The weekly chart that I highlighted last week with a possible double bottom formation remains in-place. The early portion of the week made it look as though that support at 100.87 would be vulnerable, as DXY posed a stern drop on Monday until finding support around the 101.30 level. This led to a strong bounce on Tuesday as the USD built both a bullish engulfing candlestick and an outside bar. Sellers took another shot on Wednesday, and another on Friday but at this point that low remains unfettered.
As to whether that support holds or not, it’ll likely have some relationship with whether EUR/USD can break through the 1.1100 handle, which has proved a challenge again this week. As the ECB has grown more and more hawkish, EUR/USD has continued to claw back last year’s losses, and this highlights a major decision point that I’ll look at in that pair a little later.
US Dollar - DXY Weekly Price Chart (indicative only, not available on Forex.com platforms)
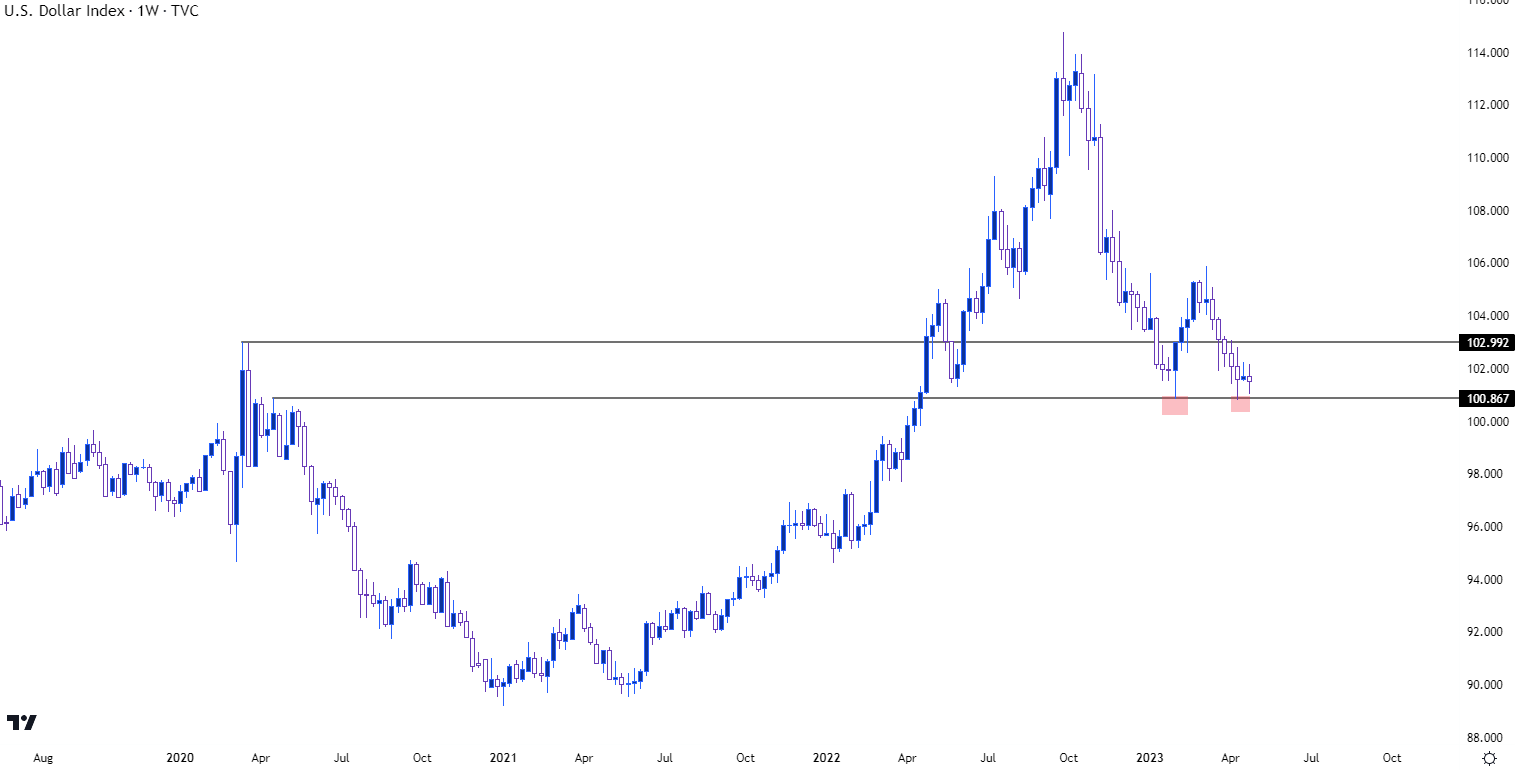 Chart prepared by James Stanley; data derived from Tradingview
USD Shorter-Term
Given the multiple fits and starts in USD trends over the past week, there’s a bit more noise on the daily chart. The one consistent message from last week was a penchant for resistance to show over the 102 level and support around the 101.30 level. This has left the daily chart as fairly choppy, but the four-hour chart may appear a bit smoother given the greater granularity of this recent gyration.
On the bullish side of the matter: prices held a series of higher lows after the Wednesday reversal following the test at 101. And this is after the 100.87 level remained un-tested even during a precipitous drop on Wednesday morning.
On the bearish side of the Greenback: Bulls have been spinning their wheels for a while now and this week was witness, again, to multiple rallies that were sold after tests of the 102.00 handle. But sellers haven’t been able to yet break down to a fresh low so that’s deductively notable, and something that bears should ‘bear’ in mind, as short-side approaches in DXY so near this big picture support are, essentially, breakout strategies looking for DXY to fall to a fresh yearly low.
Of interest for both bulls and bears is the trendline connecting swing highs in the DXY since late-March. If the Greenback is finally going to pose a reversal, it’s going to need to deal with that trendline. But, as long as that trendline remains in-place, an argument can be made that there’s a descending triangle in-play, and that’s a bearish breakout pattern that could point to fresh downtrends when support gives way.
US Dollar - DXY Four-Hour Price Chart (indicative only, not available on Forex.com platforms)
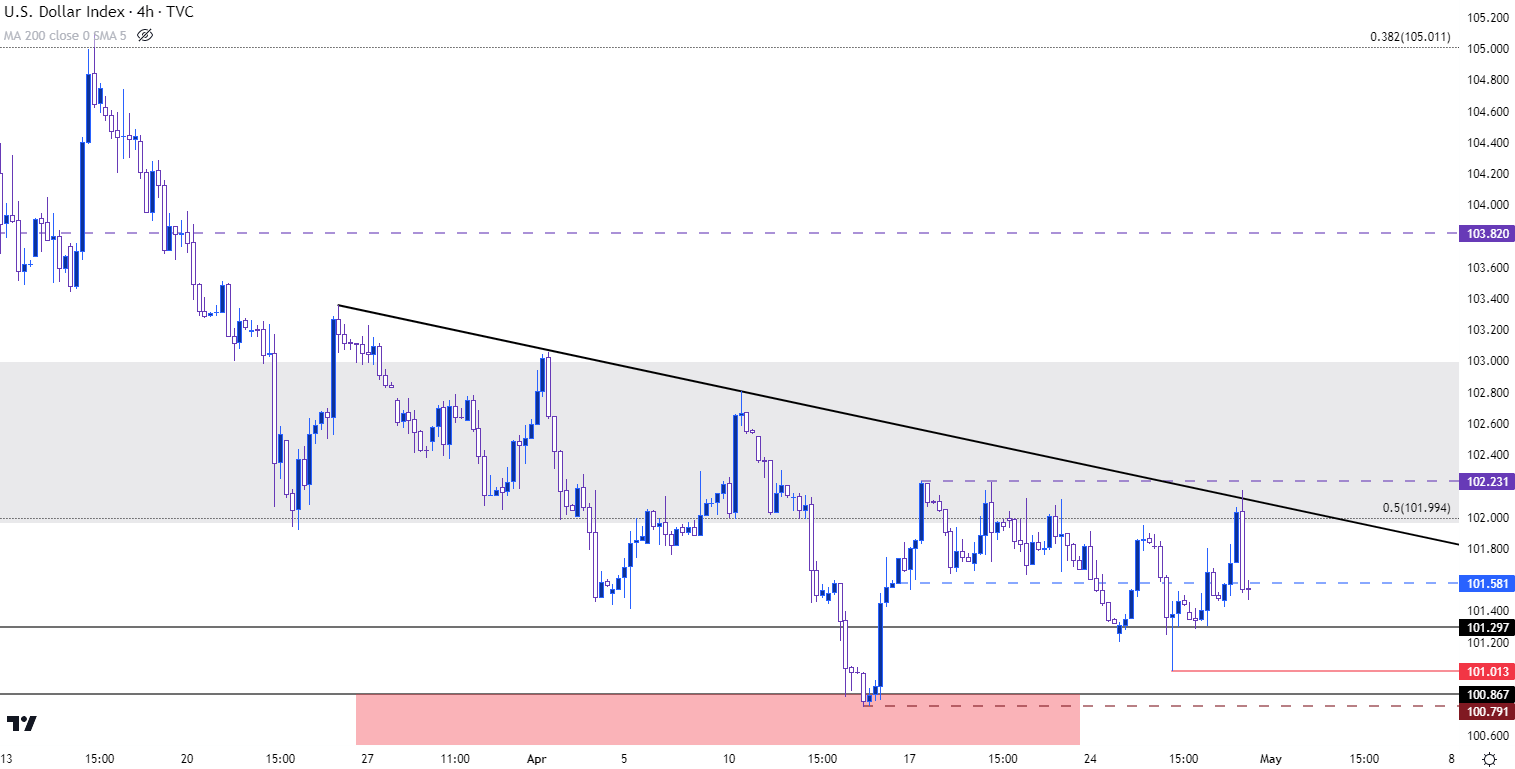 Chart prepared by James Stanley; data derived from Tradingview
EUR/USD
While the US Dollar is in the spotlight next week with FOMC and NFP along with the PMI prints on Monday and Wednesday, so is the Euro.
European inflation is released on Tuesday morning, and this is the flash read for April, so it’ll be subject to revision later in the month but should be a strong pacesetter, nonetheless. And then on Thursday, less than 24 hours after the Fed, we hear from the European Central Bank for their May rate decision. There are expectations for another 50 bp hike and given that the ECB no longer issues forward guidance, hints from the accompanying press conference could go a long way in forming future policy expectations.
This hawkishness is not necessarily new, however, as the European Central Bank has been vociferous on the topic of tighter policy to further temper inflation and that’s helped the single currency to remain bullish against the US Dollar, while setting a fresh 14-year high earlier today against the Japanese Yen.
Given that the Euro is 57.6% of the DXY quote, there will probably need to be some form of softening in the trend if USD is going to begin posing a bullish move off that longer-term support. At this stage, EUR/USD continues to hold resistance around the 1.1000 psychological level, which had come back into the picture in February and remains an item of contention today.
EUR/USD Weekly Price Chart
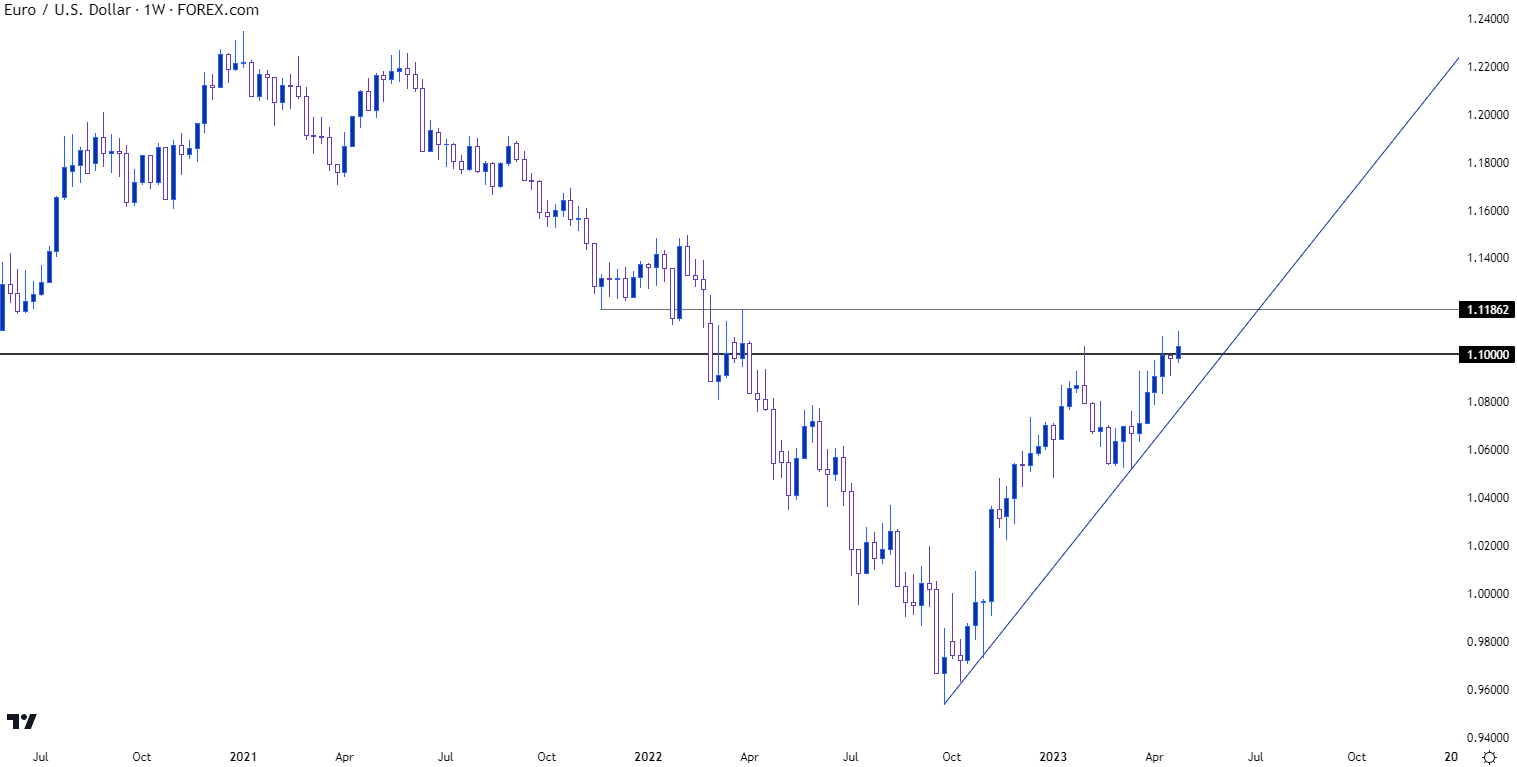 Chart prepared by James Stanley, EUR/USD on Tradingview
EUR/USD Shorter-Term
EUR/USD pushed back-above the 1.1000 handle two weeks ago: But the pair hasn’t been able to show much for bullish continuation as there’s been a penchant for resistance to show around the 1.1050 level multiple times. And on the support side of the pair, there’s been a series of higher lows, helping to produce an ascending triangle formation. This keeps the door open for short-term bullish breakout scenarios in EUR/USD and has some relation with the descending triangle looked at in DXY above.
The big question here is whether a breakout to 1.1100 or beyond would be met with new buyers coming into the market or not, as the pair has already struggled to pull in bulls beyond the 1.1050 level and that helped to lead to the Wednesday reversal which, at this point, is what marks the yearly high in EUR/USD.
EUR/USD Daily Chart
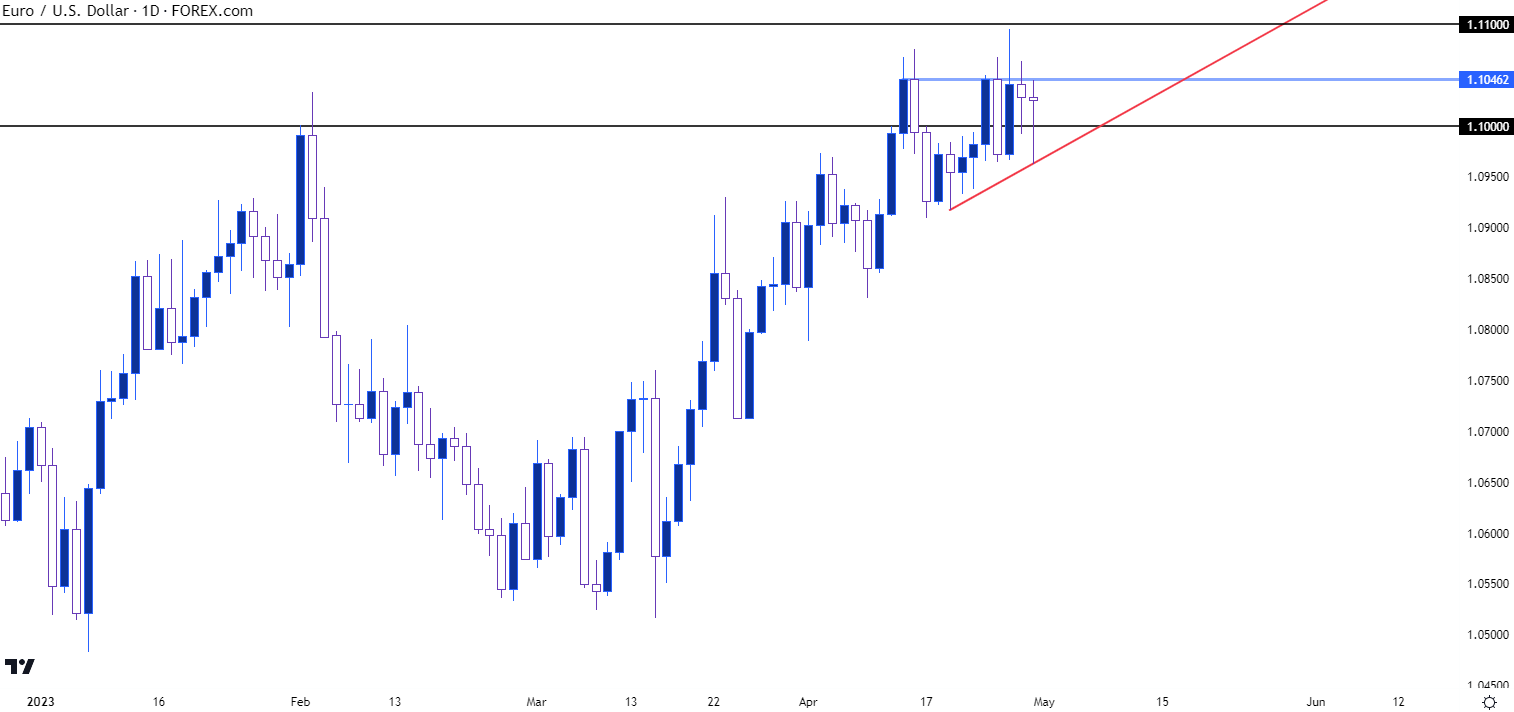 Chart prepared by James Stanley, EUR/USD on Tradingview
GBP/USD
Cable is currently trading at a fresh ten-month high, crossing above the 1.2500 level that was proving a stubborn spot of resistance. Last week’s inflation data showed UK headline CPI remaining above 10% so while inflation has softened in the US and Europe, the Bank of England still has some work to do.
The weekly chart highlights that fresh breakout well, and this sets the pair up for next week’s heavy economic calendar. The 1.2444 and 1.2500 levels could function as higher-low support potential for bullish continuation scenarios. For topside continuation, there’s a spot of resistance around the 1.2667 level that was in-play last May to help hold the highs in the pair. Beyond that, there’s a Fibonacci level nearby the 1.2750 psychological level, and this can create a zone of confluence in the pair.
If buyers can run the fresh breakout in the early portion of next week, that could even produce a reversal setup in the pair provided a show of resistance. Notably, GBP/USD has gained for eight of the past nine weeks, and the one outlier was a doji so there hasn’t been much by way of pullback here since the current bullish trend started to launch back in early-March.
GBP/USD Weekly Chart
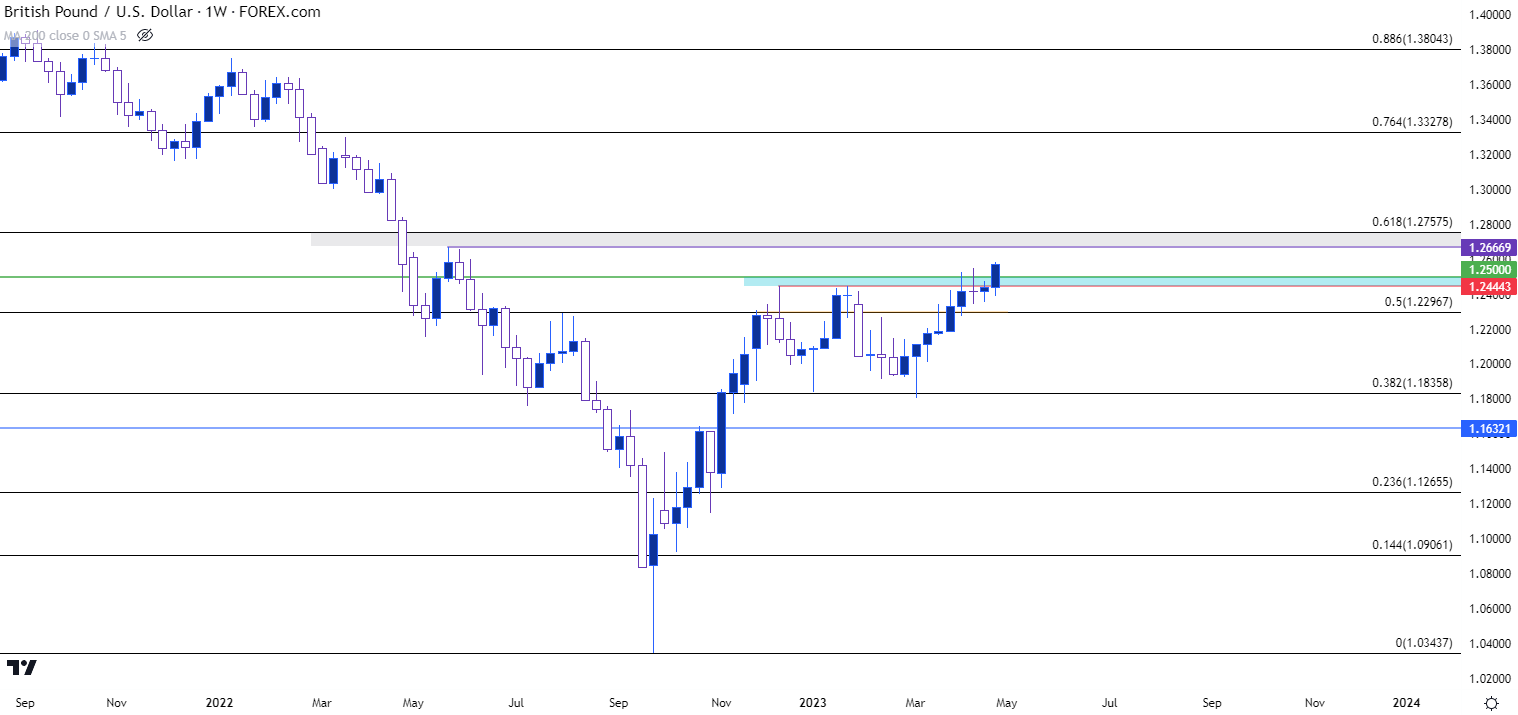 Chart prepared by James Stanley, GBP/USD on Tradingview
USD/CAD
I’ve been tracking USD/CAD over the past few weeks as there’s been a couple of interesting items appearing. And even drawing back to early-March there’s been a few notable items in the pair regarding related USD themes.
Going back a couple of weeks ago, USD/CAD had revisited range support at a key juncture on the chart. And in dropping down to support, the pair produced a falling wedge formation, often approached with aim of bullish reversals. Collectively, the two intertwined to create a bullish scenario for USD bulls and even as the US Dollar has faced its own challenges over the past two weeks, USD/CAD showed a strong breakout from the falling wedge formation to return to the 1.3652 Fibonacci level.
Since that Fibonacci level, however, matters have begun to shift a bit. That price was in-play on Wednesday and came back into the picture on Friday, after which sellers went on the attack to produce an outside bar on the daily chart.
This puts focus on the 1.3500 psychological level for support potential, but outside bars can be approached similar to a bearish engulf which denotes continuation potential – so if support doesn’t develop at 1.3500 in USD/CAD, the focus can shift to deeper support potential around 1.3412 or perhaps even a revisit of the Fibonacci level at 1.3338.
USD/CAD Daily Price Chart
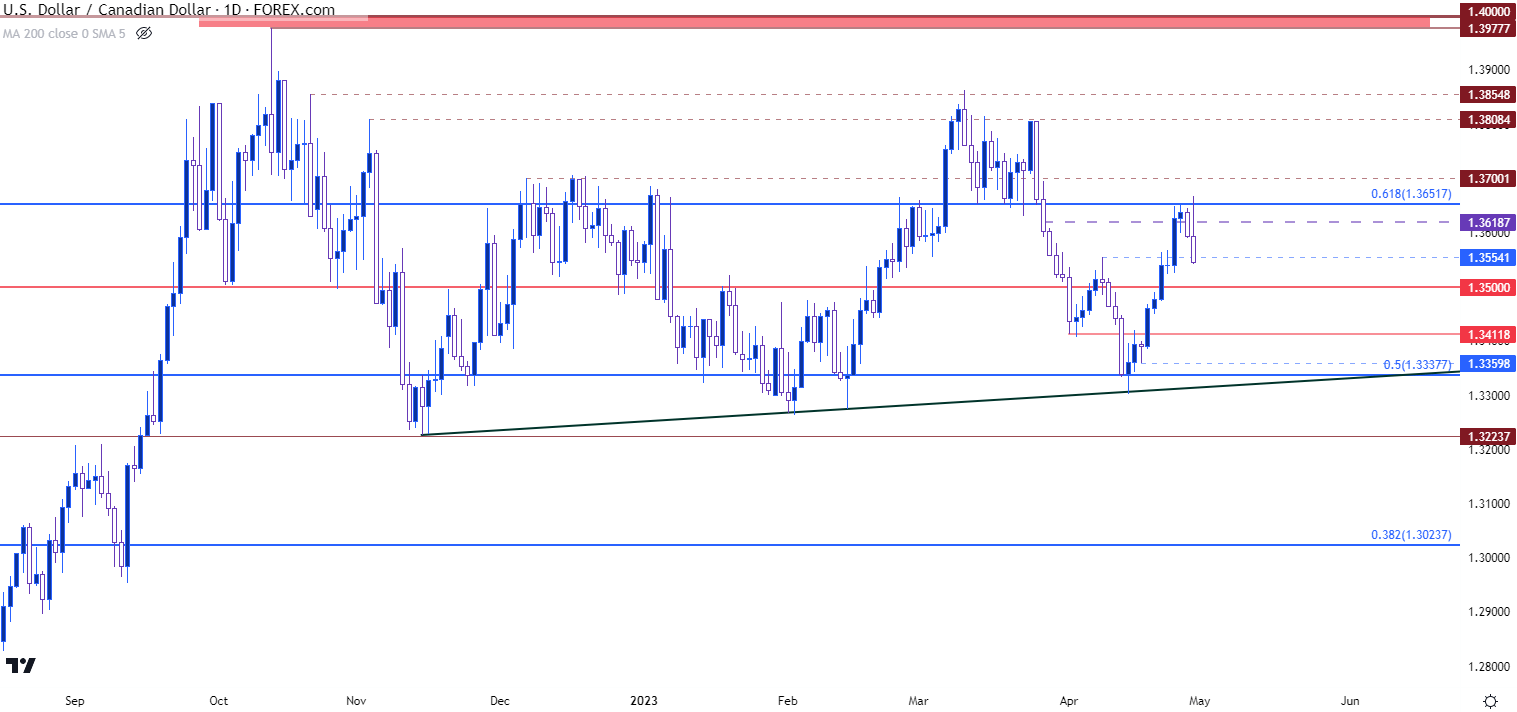 Chart prepared by James Stanley, USD/CAD on Tradingview
USD/JPY
USD/JPY has broken out of a short-term bull flag formation that I had looked at on Thursday, just ahead of the Bank of Japan rate decision. That meeting has since produced a powerful move of Yen-weakness that’s helping EUR/JPY to trade at a fresh 14-year high as GBP/JPY trades above 170.00. USD/JPY is a bit more subdued given recent themes of USD-weakness, but this also raises questions about longer-term trend potential in the pair.
USD/JPY Daily Chart
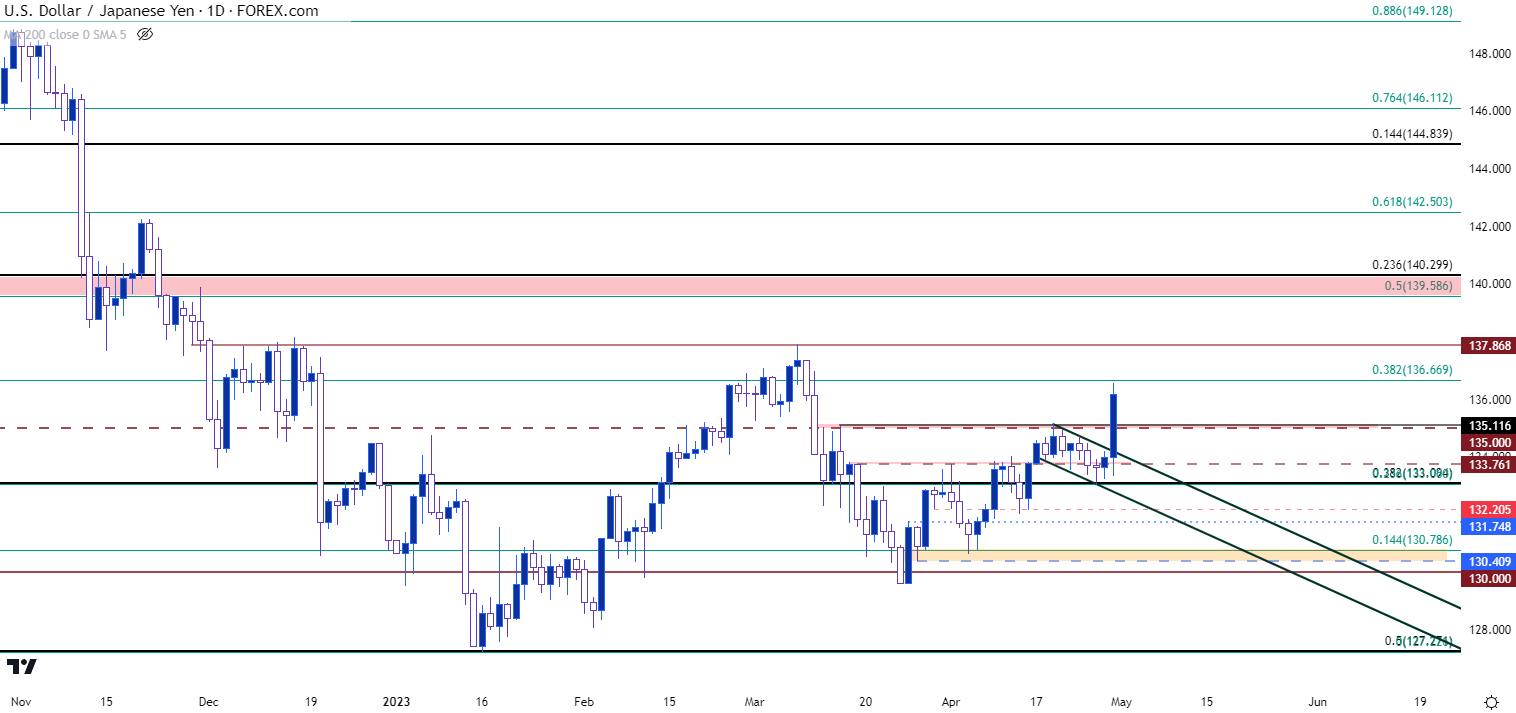
Chart prepared by James Stanley, USD/JPY on Tradingview
At source of the move was last night’s Bank of Japan rate decision, which was the first from newly installed BoJ Governor, Kazuo Ueda. Given how impactful the Bank of Japan’s Yield Curve Control policy has been on not only Japanese markets but global bourses, as well, there was considerable attention paid to this initial outing from Ueda as markets looked for any possible signs of change that may prelude a shift to policy. And to be sure, there was some change, although we remain at a very early stage of gauging the market response.
What seemed to really get the attention of market participants was the announcement of a policy review that may take 12-18 months. And given the response in the Yen it seems as though some are expecting that few changes will be made during this period, as the review is seemingly being read as a key step before any formal changes are made.
In USD/JPY, this puts focus on 137.87 resistance, which has already held two advances in December and then again in March. Above that price is another major spot on the chart around the 140.00 handle, and if bulls can re-engage there, big picture bullish continuation themes will be in the spotlight after a 50% retracement of the 2021-2022 major move.
Alternatively, if buyers are unable to defend the 133.09 support level, bullish themes are in question after what would invariably take on the look of a failed breakout, as that Fibonacci level helped to hold this week’s low before the push above the psychologically-important 135.00 level.
USD/JPY Weekly Price Chart
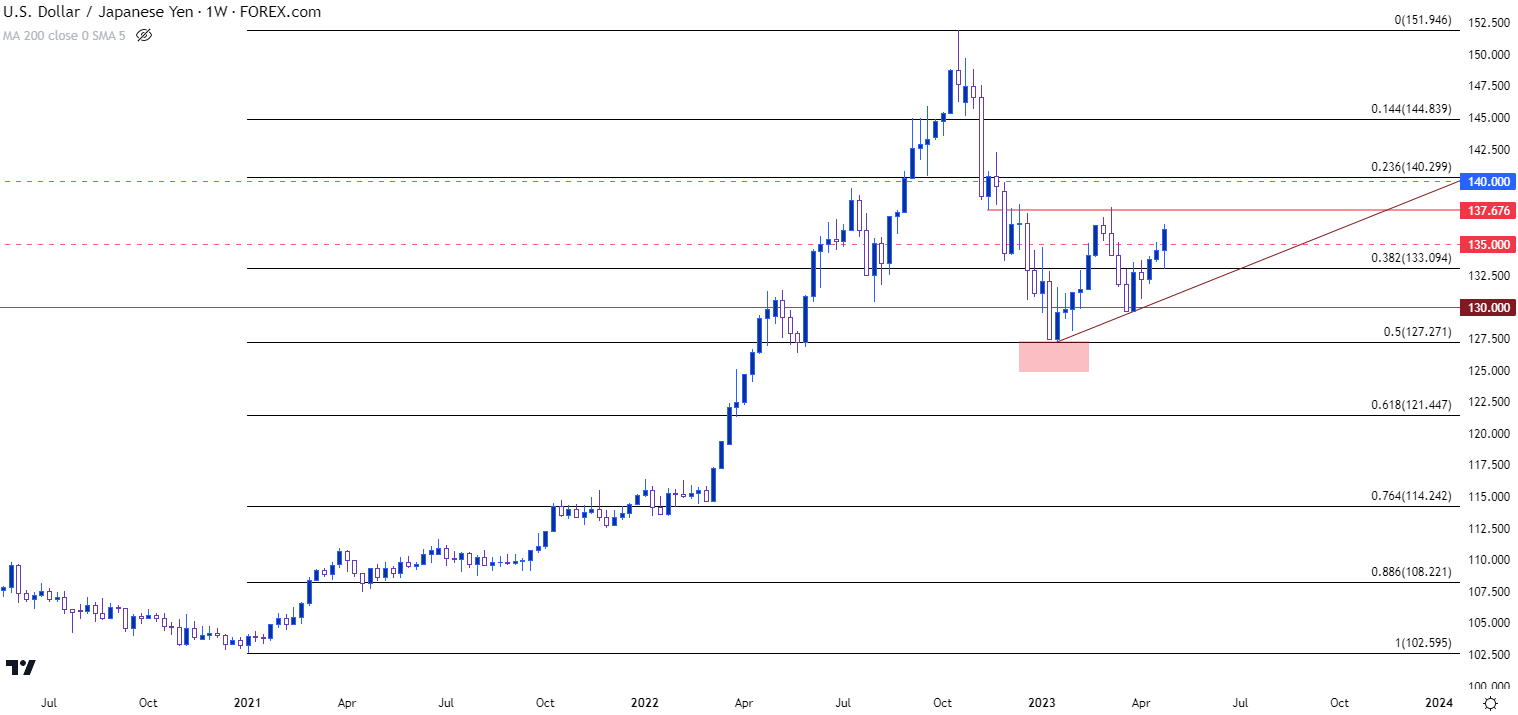 Chart prepared by James Stanley, USD/JPY on Tradingview
--- written by James Stanley, Senior Strategist


