
US Dollar Talking Points:
- The US Dollar is continuing its descent this morning, helped along by some dovish FOMC comments.
- EUR/USD has tagged the 1.1000 level and RSI on the daily has moved to overbought territory. GBP/USD continues to surge and USD/CAD and USD/JPY are both showing varying stages of breakdown.
- There remains some important data on this week’s economic calendar with PCE set for release on Thursday, the final trading day of November.
- I’ll be discussing these themes in-depth in the weekly webinar. It’s free for all to register: Click here to register.
The bearish trend in the US Dollar caught another shot-in-the-arm this morning. Noted hawk Christopher Waller of the St. Louis Fed offered some dovish comments and USD bears used the open door to push DXY down to a fresh three-month low.
At this point, the analog to last year has continued to play out around the USD, with November showing as a significant reversal of a bullish move that ran through September and stalled in October. In both cases, it was a CPI print that helped to trigger a downside break. Last year, that CPI report was issued on November 10th and this year, the 14th.
US Dollar Daily Chart: Trend, Stall, Trend (indicative)
 Chart prepared by James Stanley; data derived from Tradingview
US Dollar Now Oversold on Daily
I’m not a huge RSI fan and I shared a few reasons as to why on this webinar; but it can be an item of consideration for context and the fact that USD has already moved into oversold territory after leaving overbought in early-October highlights just how quickly this bearish move has priced in. And this isn’t a central bank that’s talking about cuts, at least from Jerome Powell’s comment on the matter at the rate decision earlier in the month.
The last oversold reading on the USD was in July, just before prices reversed and then moved in to the 11-week streak of strength. That’s what led into the stall in October that eventually began to go the other way.
For support, the 102.56 level sticks out as the 61.8% retracement of that bullish move that began in July, and below that we have a bit of confluence around the 102.00 level. For short-term resistance, there’s potential around 103.17 which is a Fibonacci level that had come into play to hold the lows last week. Above that remains a massive spot at 103.50, and this could be of consideration for month-end. Above that, both 104.03 and 104.38 retain some interest as possible resistance.
US Dollar Daily Price Chart (indicative)
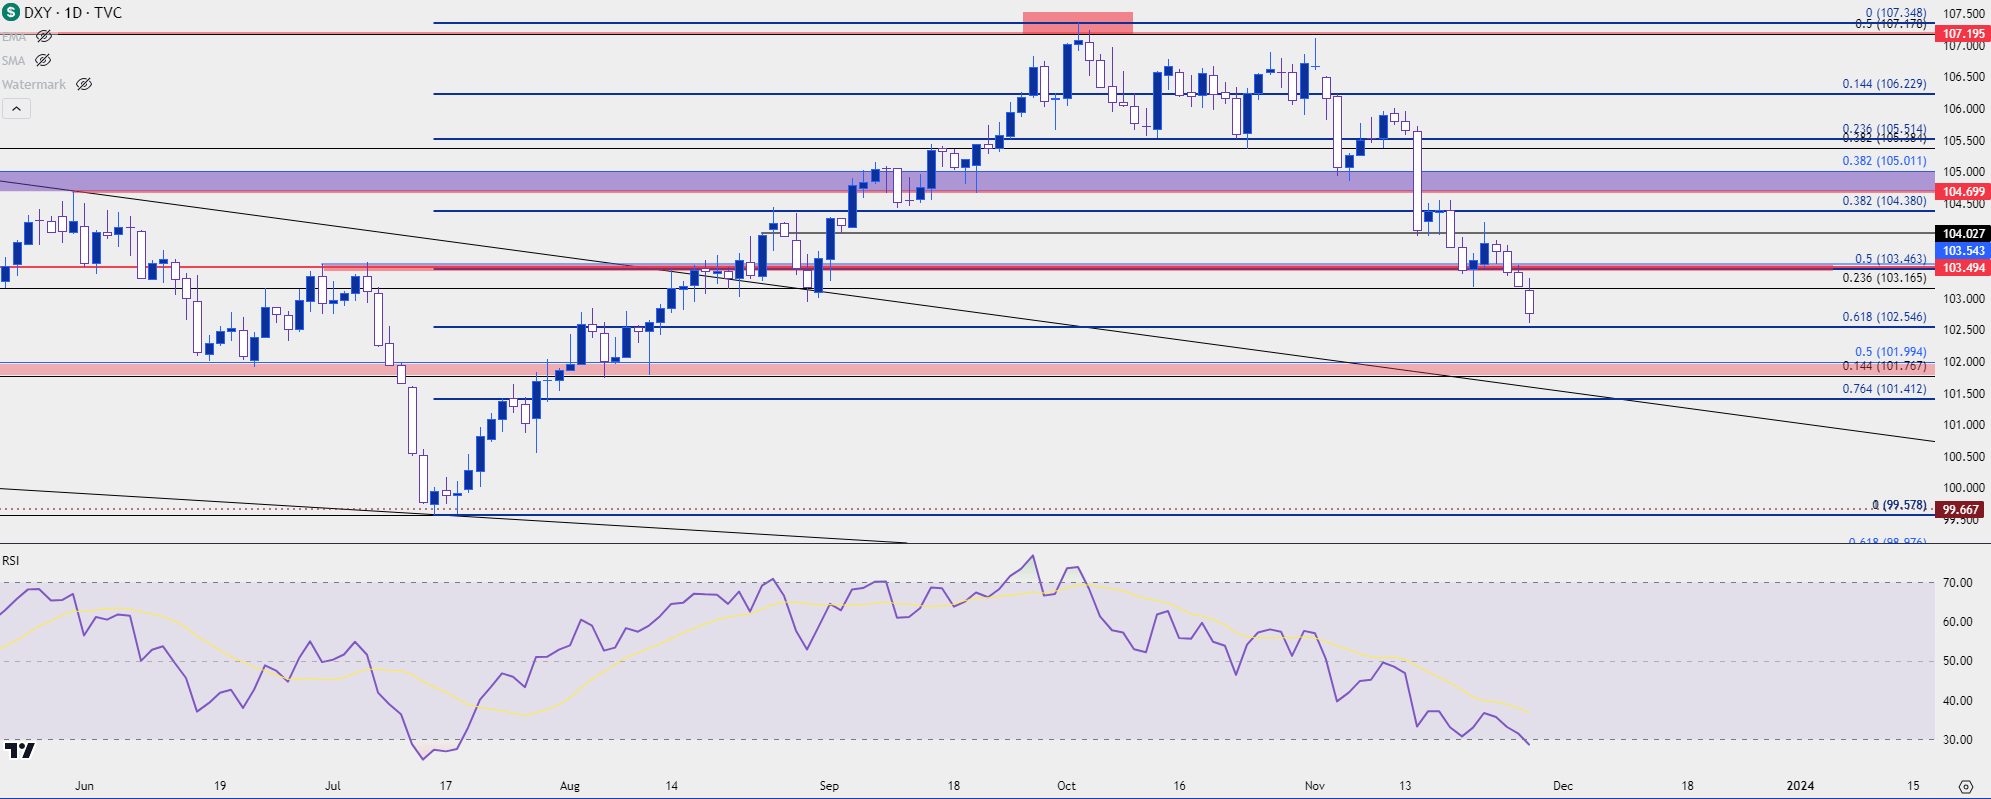 Chart prepared by James Stanley; data derived from Tradingview
EUR/USD 1.1000 Test as RSI Goes Overbought
It’s amazing the way that price can shape sentiment.
Just a couple of months ago doom-and-gloom seemed to be everywhere around Eurozone prognostications. But now that EUR/USD has perked up, largely with a push in November, and those calls have seemed to have grown quieter.
But really, we’re looking at a similar situation that we were when EUR/USD was driving into the 1.0500 figure, with perhaps the notable exception of the market’s technical backdrop and accompanying context. I had started to look at support at the 1.0500 handle in EUR/USD in late-September. At the time, the bearish trend had remained smooth for much of the prior three months, and it didn’t seem as though there was much interest from bulls.
RSI moved into oversold territory – and stayed there for about a week – as bulls simply seemed disinterested. We talked about this on these webinars multiple times throughout the month of October as a bullish channel built. Initially, given the bearish trend that led into the bullish channel, that pullback looked like a bear flag – but buyers continued to push with consistency, if not veracity.
It’s the month of November when this started to come back to life. On the morning of the FOMC rate decision bears were making a push towards 1.0500 as USD was making a push to 107.20. But that move could not hold and by the end of the press conference, it was largely gone, leaving a dragonfly doji on the daily chart of EUR/USD.
And since then, bulls have went to work, with a strong push on the morning of NFP to bring prices up to 1.0750. The pullback from that took the form of a falling wedge – a bullish reversal formation – and that led to another extension in the topside trend after the release of CPI on November 14th.
The next move found resistance at the confluent zone of Fibonacci levels at 1.0943-1.0960, and after a pullback from that, buyers launched into another topside move to arrive at the 1.1000 psychological level. Along the way, RSI drove into overbought territory for the first time since July.
EUR/USD Daily Price Chart
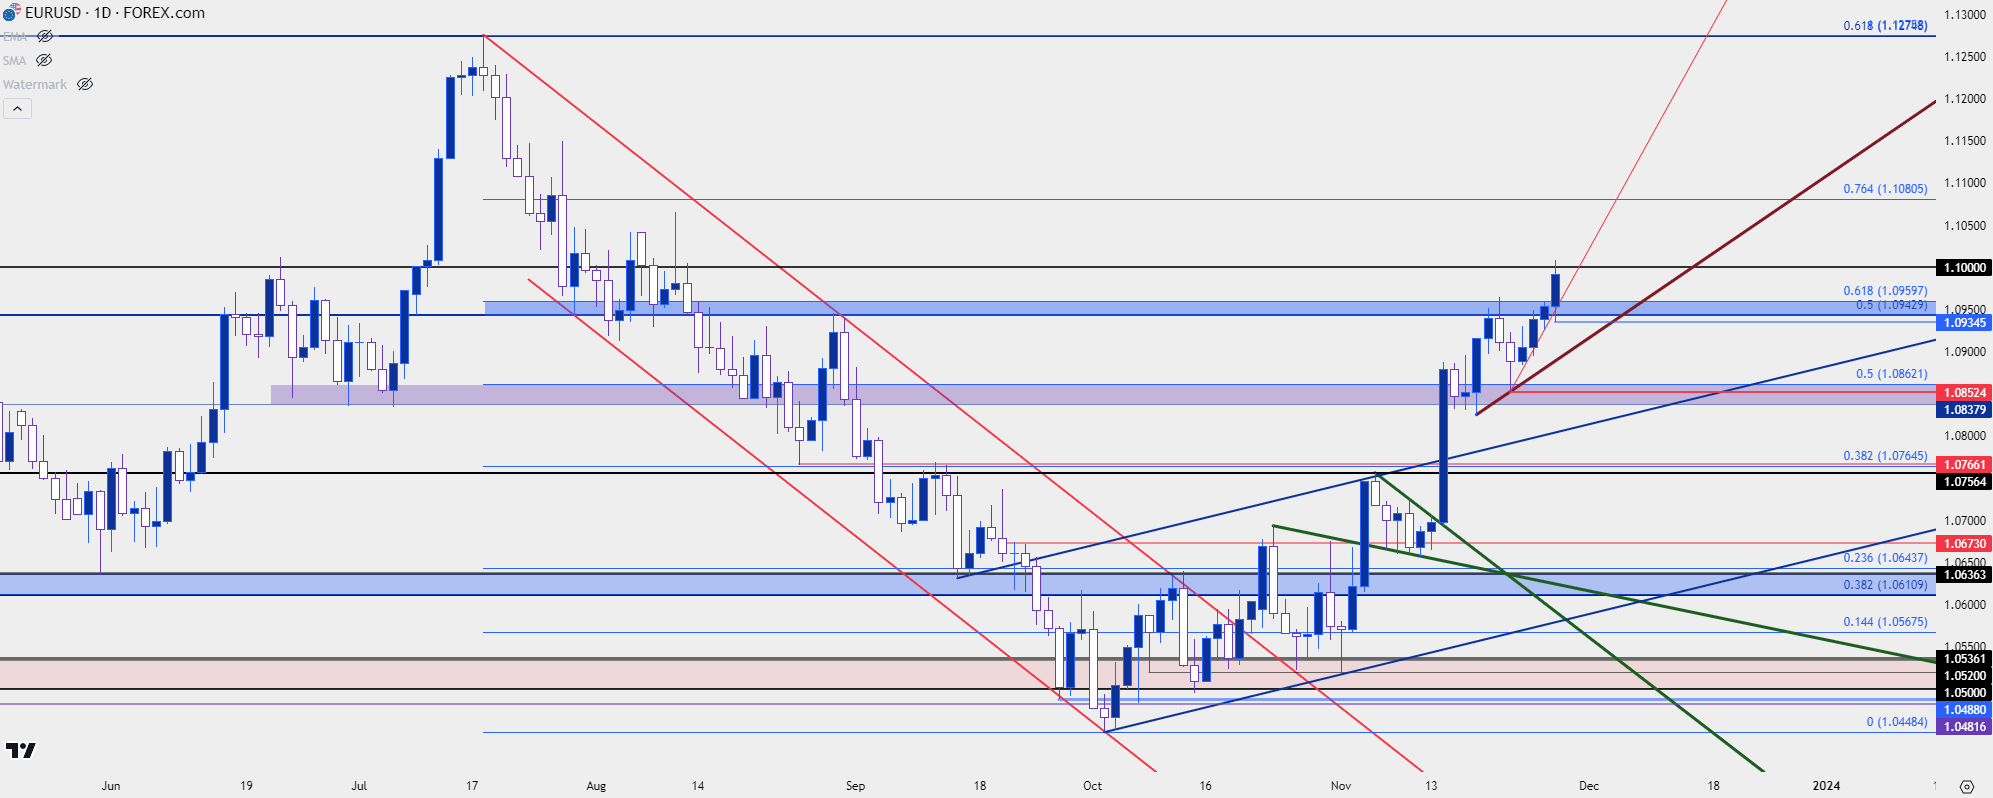 Chart prepared by James Stanley, EUR/USD on Tradingview
As I had shared in the webinar, a resistance hold at a major psychological level coupled with an overbought reading from an oscillator such as RSI could be a lead-in for reversal potential; but just as we saw with the 1.0500 test in EUR/USD in September and October, those types of turns can take time. And on shorter time frames bulls have shown exceptional aggression with a continued pattern of higher-highs and higher-lows.
There’s remaining support potential at prior resistance, from 1.0943-1.0960, after which a short-term trendline comes into play, and if that can’t hold, then we’re looking at the same support that came into play last week, from around 1.0838-1.0862.
EUR/USD Four-Hour Price Chart
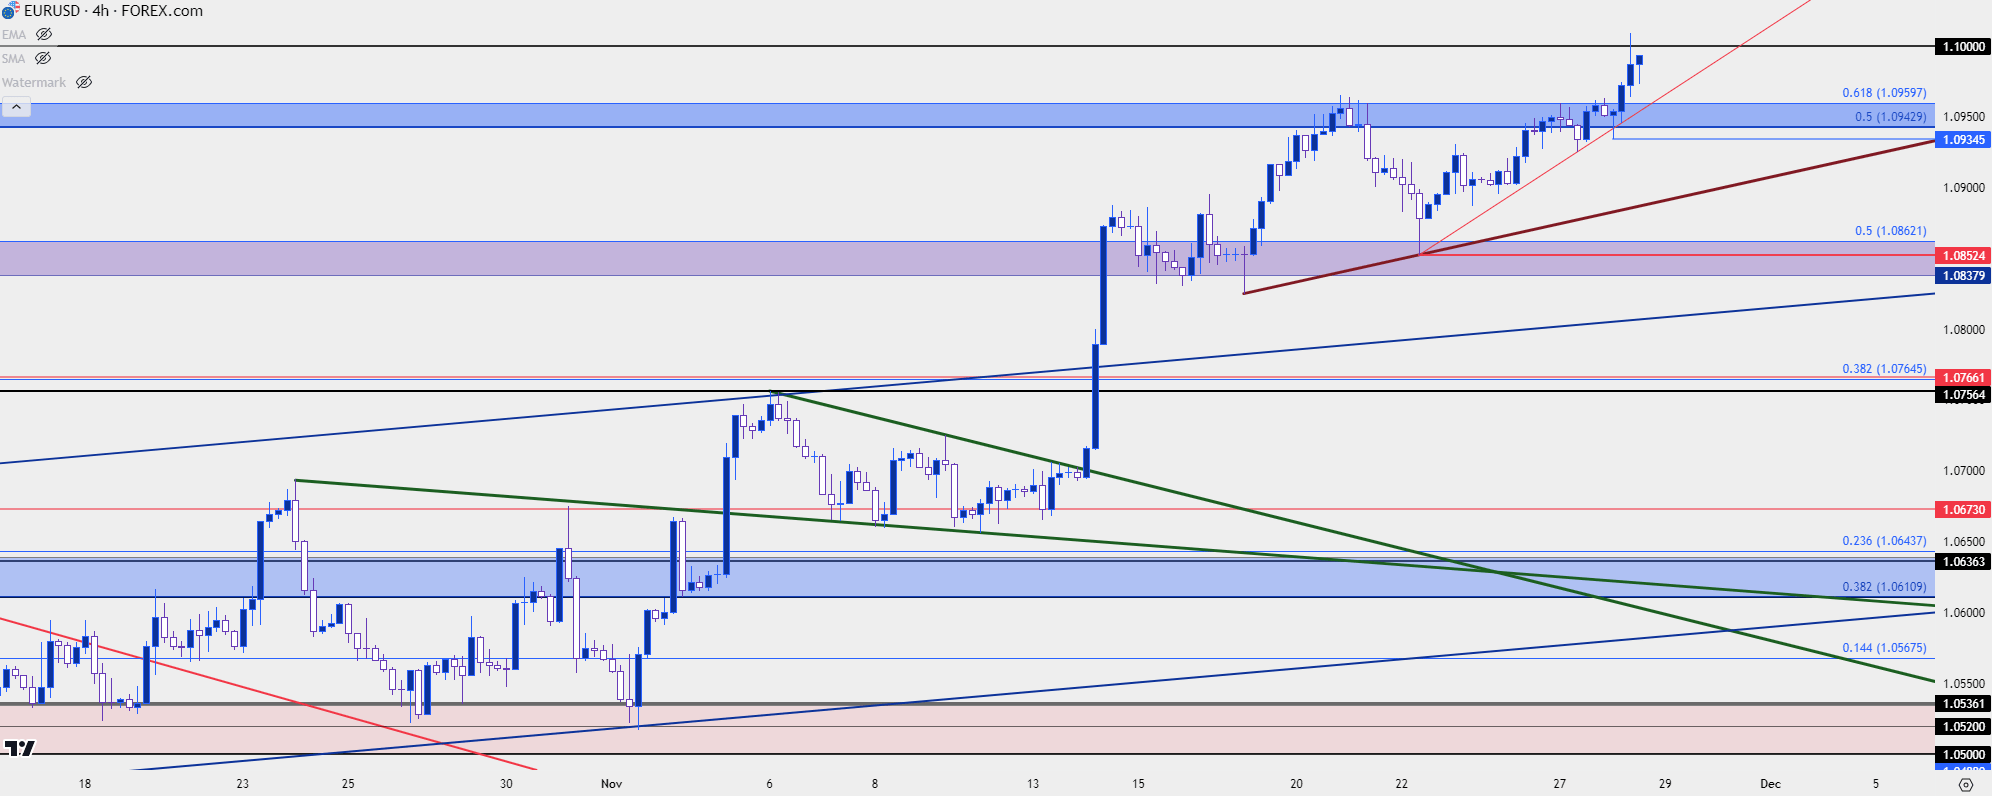 Chart prepared by James Stanley, EUR/USD on Tradingview
GBP/USD
Cable has been a bit cleaner but, similarly, is seeing the bullish move indicate some element of stretch as daily RSI is also overbought here.
GBP/USD is fast approaching the next zone of resistance that runs from 1.2720 up to 1.2758, each of which are Fibonacci levels that straddle the 1.2750 psychological level. There’s been a fast run from the 1.2590 level that I had looked at in the Friday article, and that could function as some element of support if a pullback does show.
But there has been a noticeable difference between this and EUR/USD with the rally in Cable looking a bit more frenetic. So, for those looking to fade the USD move, an item of that nature could be a point of consideration.
GBP/USD Daily Price Chart
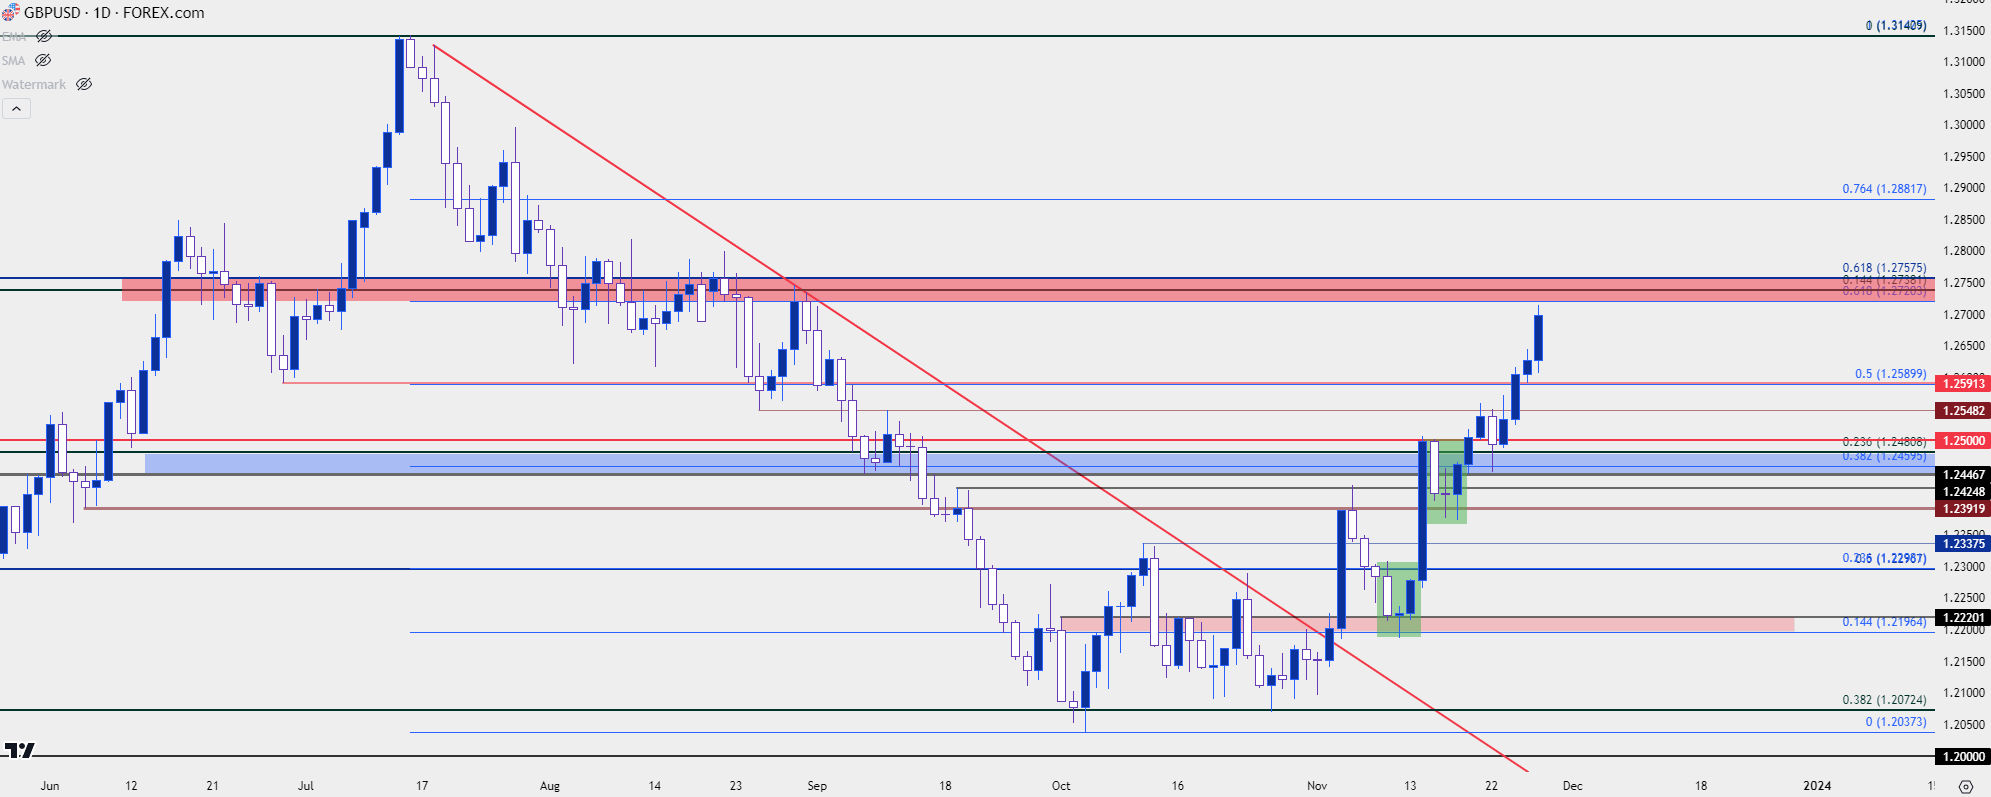 Chart prepared by James Stanley, GBP/USD on Tradingview
USD/CAD Breakdown
There’s not much to update here as I had written about the setup in USD/CAD yesterday. That sell-off has since extended and price is now trading through support at 1.3575. There’s another spot a little lower, around the 1.3500 psychological level, and that remains a key point of contention.
In the webinar, I was able to take a longer-term look to highlight the mean reversion that has shown so far this year and given that backdrop, this could remain as an interesting market for those looking for a continuation of USD-weakness.
USD/CAD Daily Price Chart
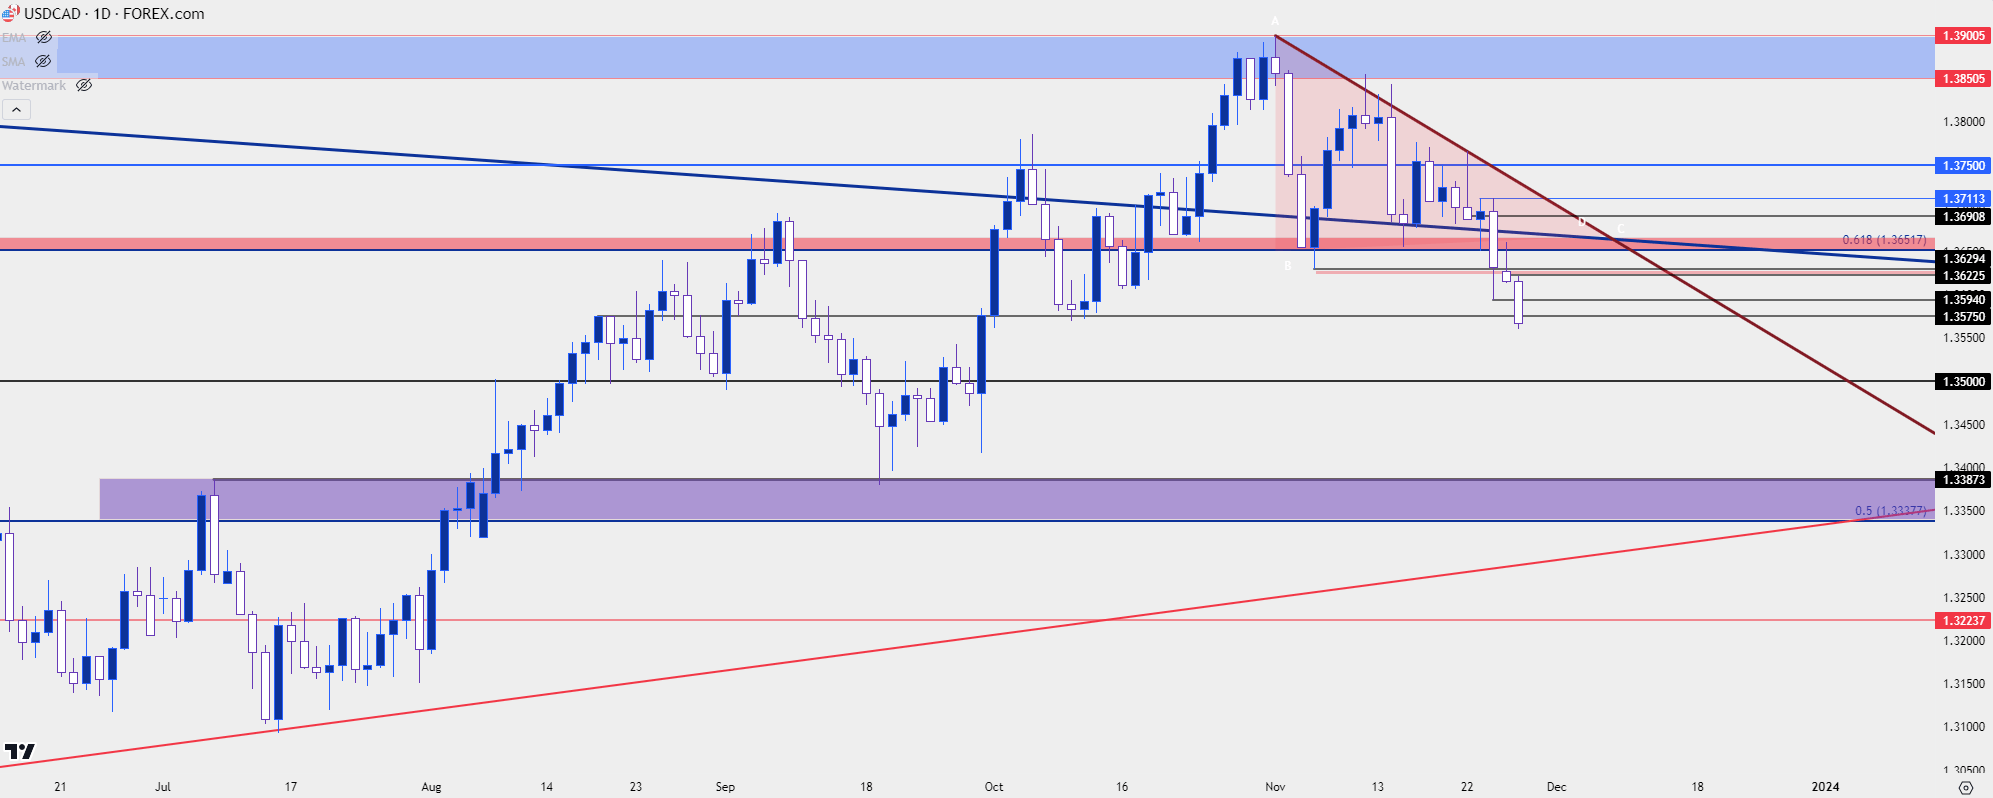 Chart prepared by James Stanley, USD/CAD on Tradingview
USD/JPY
Helping with that USD push this morning has been a resurgence in USD/JPY weakness. This has been a difficult variable as it essentially comes down to the decision-making matrix between the Fed and the Bank of Japan.
As the Fed hiked and the BoJ stood pat, a bullish trend developed as the carry trade pulled more and more investors/traders into the matter.
But – as I had highlighted just before the CPI report in November, and shortly after relevant to USD/JPY – if there’s a fear of pricinpal losses, those carry trades can unwind quickly. This is essentially the backdrop for USD/JPY last year, when the pair put in a harsh reversal after the November 10th CPI report in a move that lasted for a couple of months after.
But the monetary dynamic had not changed: The BoJ remained uber-dovish and the Fed continued to hike, and this helped to draw traders back on to the long side as attracted by that carry, which eventually led to another bullish trend.
USD/JPY seemed disinterested in the Fed outlay at the beginning of the month; but the CPI report seemed to bring out bears and they’ve largely remained in-control ever since. But – they haven’t been able to breakthrough the prior support level of 147.37 yet and after a strong bounce from this price last week, it’s now back in the picture.
USD/JPY Daily Price Chart
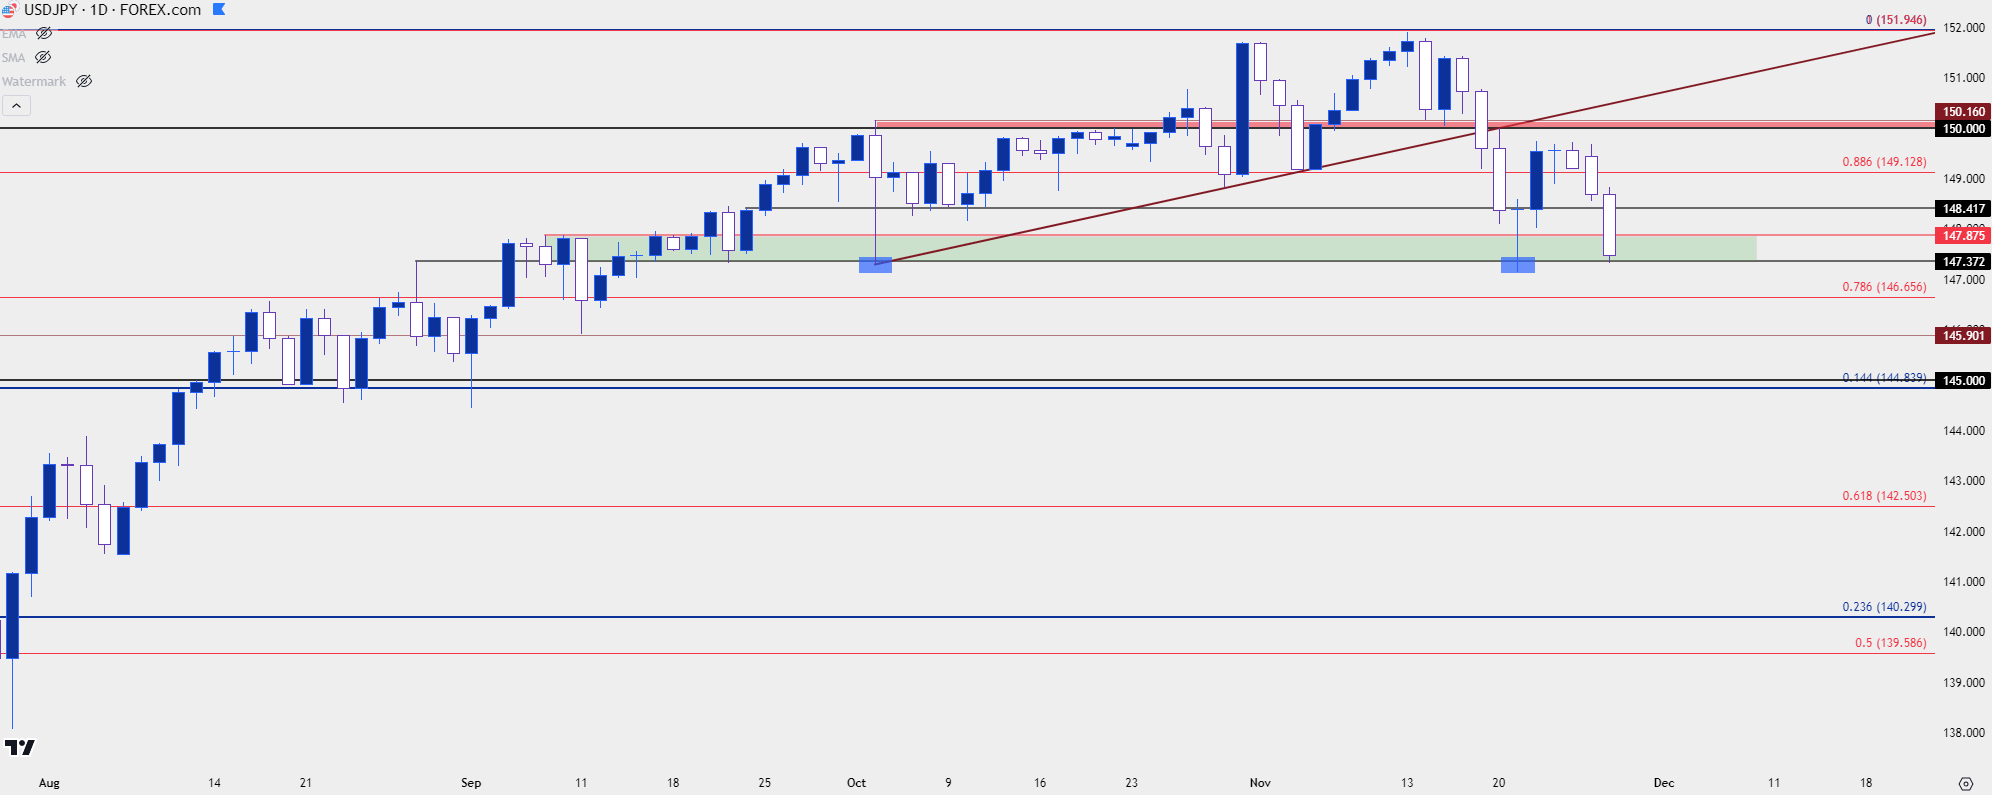 Chart prepared by James Stanley, USD/JPY on Tradingview
While there are considerable similarities to the way that the USD turned last year, there’s also some differences and that’s where the rubber meets the road in USD/JPY.
Last year USD/JPY bears went to work right after the CPI report and the reversal, at that point, was quite clear. This year’s iteration has been less clear and last week saw a strong move develop off of a key support level of 147.37. That led to a bounce of more than 200 pips – but as I had written on the day of the move – the 150.00 level would remain as a key sticking point, as a failure from bulls to re-engage would seemingly cede greater control to bears, which we’ve seen take place in the week since.
The big question now is 147.37. As we can see on the four-hour chart below, one can’t blame bears for not trying as there were four consecutive wicks around that price, indicating a half-day of support as bulls showed up early last week to hold the lows.
USD/JPY has begun to re-engage with that price and, so far, there’s been no break. So for those that are bearish there appears two different paths forward: Either waiting for the fresh low to try to chase the breakout, or look for a pullback after which lower-high resistance potential could keep the door open for short-side trends. For resistance potential, there’s a nearby level at 147.88 if bears remain aggressive. If that doesn’t hold the highs, then 148.42 could quickly come back into the picture.
If sellers can elicit the breakdown, I’m tracking the next support at 146.66, after which 145.90 and 145.00 come into the equation.
USD/JPY Four-Hour Price Chart
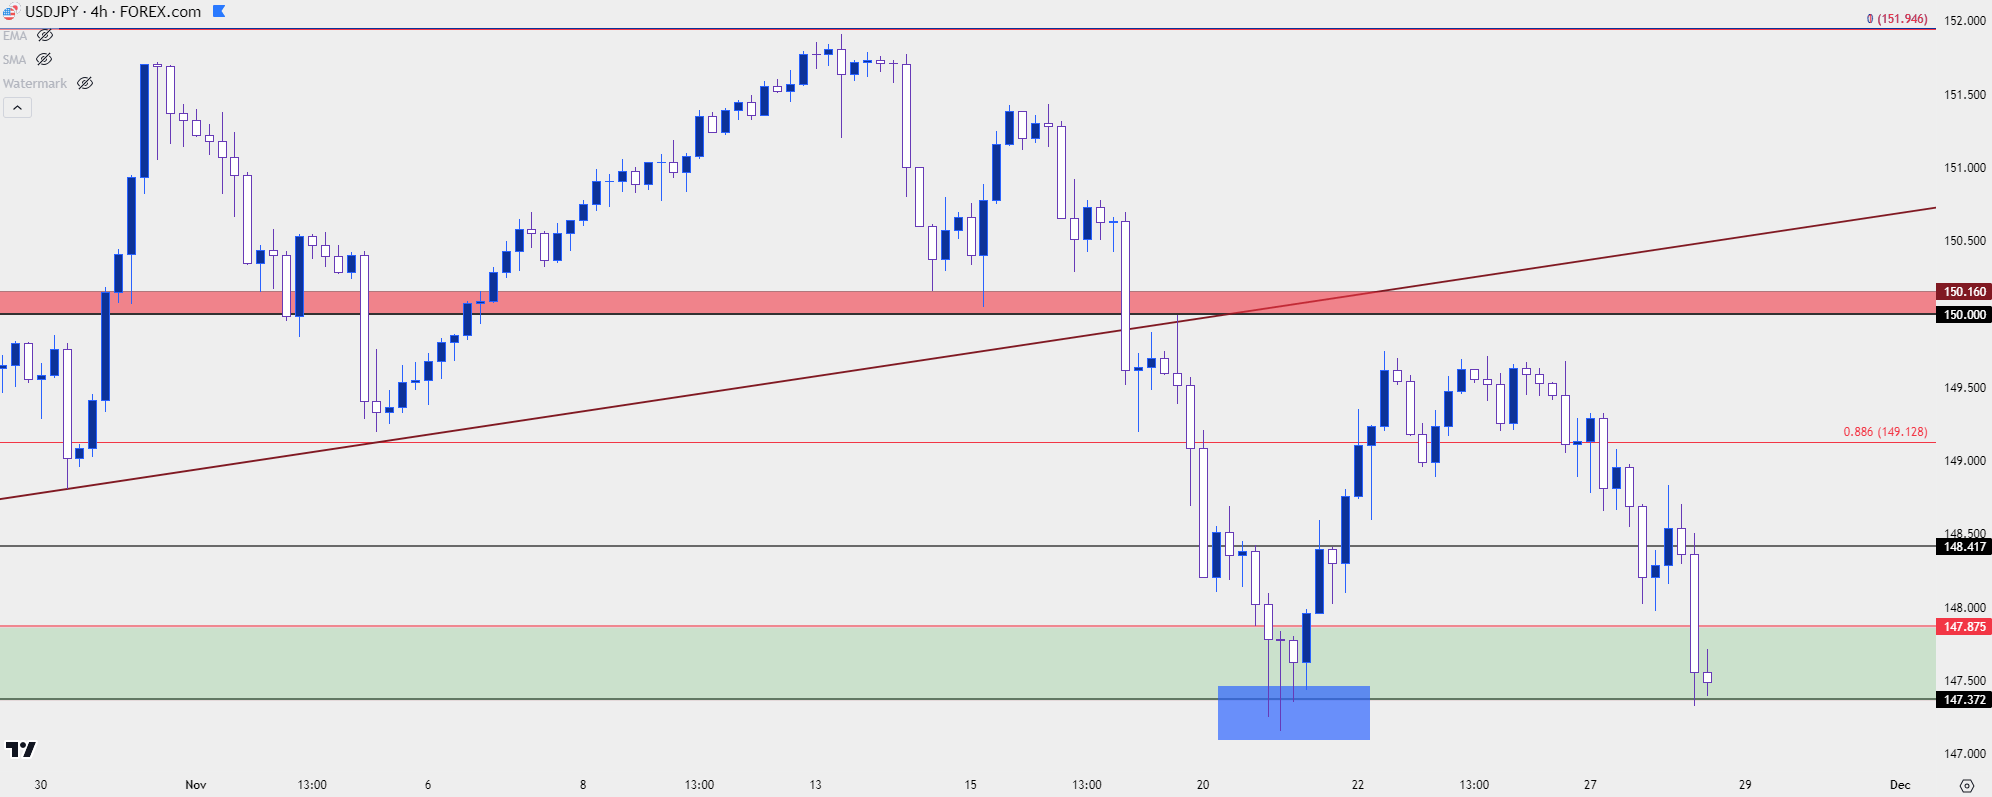 Chart prepared by James Stanley, USD/JPY on Tradingview
--- written by James Stanley, Senior Strategist


