USD, SPX, NDX, 10-Year Talking Points:
- It was a big week for markets with the FOMC rate decision and Non-farm Payrolls.
- In this article, I’m going to look at some of the big picture charts that have piqued my interest, along with some scenarios that may be ahead.
- I’ll be discussing these themes in-depth in the weekly webinar. It’s free for all to register: Click here to register.
- In the Q2 Forecast for Equities, I warned of pullback potential. But, as I also shared, I expected strength to ultimately prevail as helped along by a combination of Federal Reserve and Treasury support. With the announcement of a Treasury buy back program this week that scenario remains in-play. If you’d like to download the full forecast, the link below will allow for access:
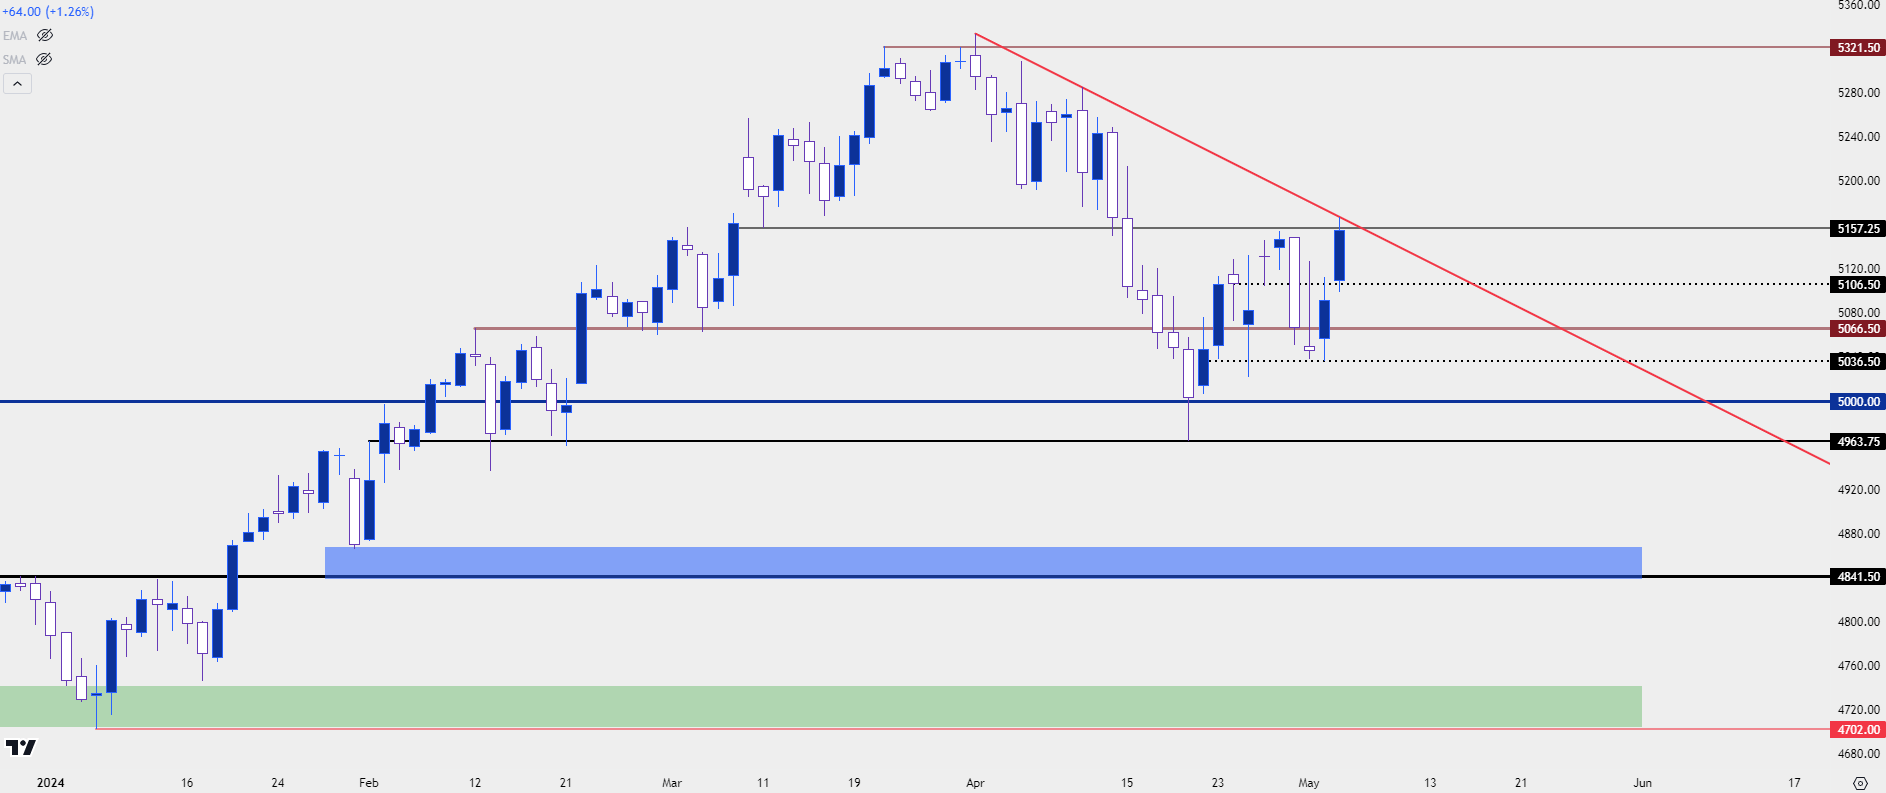
It was a big week and as we move towards the close, it was another dovish Fed outlay that continues to loom large. The S&P 500 is probably one of the better indications of this as the pullback theme was very much in order ahead of the Wednesday Fed meeting, and that even remained an item around the meeting itself.
S&P 500 futures ripped during the press conference but shortly after Powell left the podium, stocks showed a U-turn. S&P 500 futures made a bee-line for prior support at the 5037 level. That daily bar almost looks like a tombstone doji but importantly, it held the lows into Thursday trade at which point bulls could make another attempt. The strength of the Thursday bar completed a morning star formation, which led to follow-through on Friday. The rally extended after Non-farm Payrolls missed the expectation on the headline number, the unemployment rate and Average Hourly Earnings.
That was the first time the headline number came in below expectations since the report that was released in November. Current resistance has held at a bearish trendline projection, taken from the initial stages of the pullback move that showed in the first two weeks of Q2 trade.
S&P 500 Futures Daily Chart
 Chart prepared by James Stanley; data derived from Tradingview
Nasdaq 100 Futures
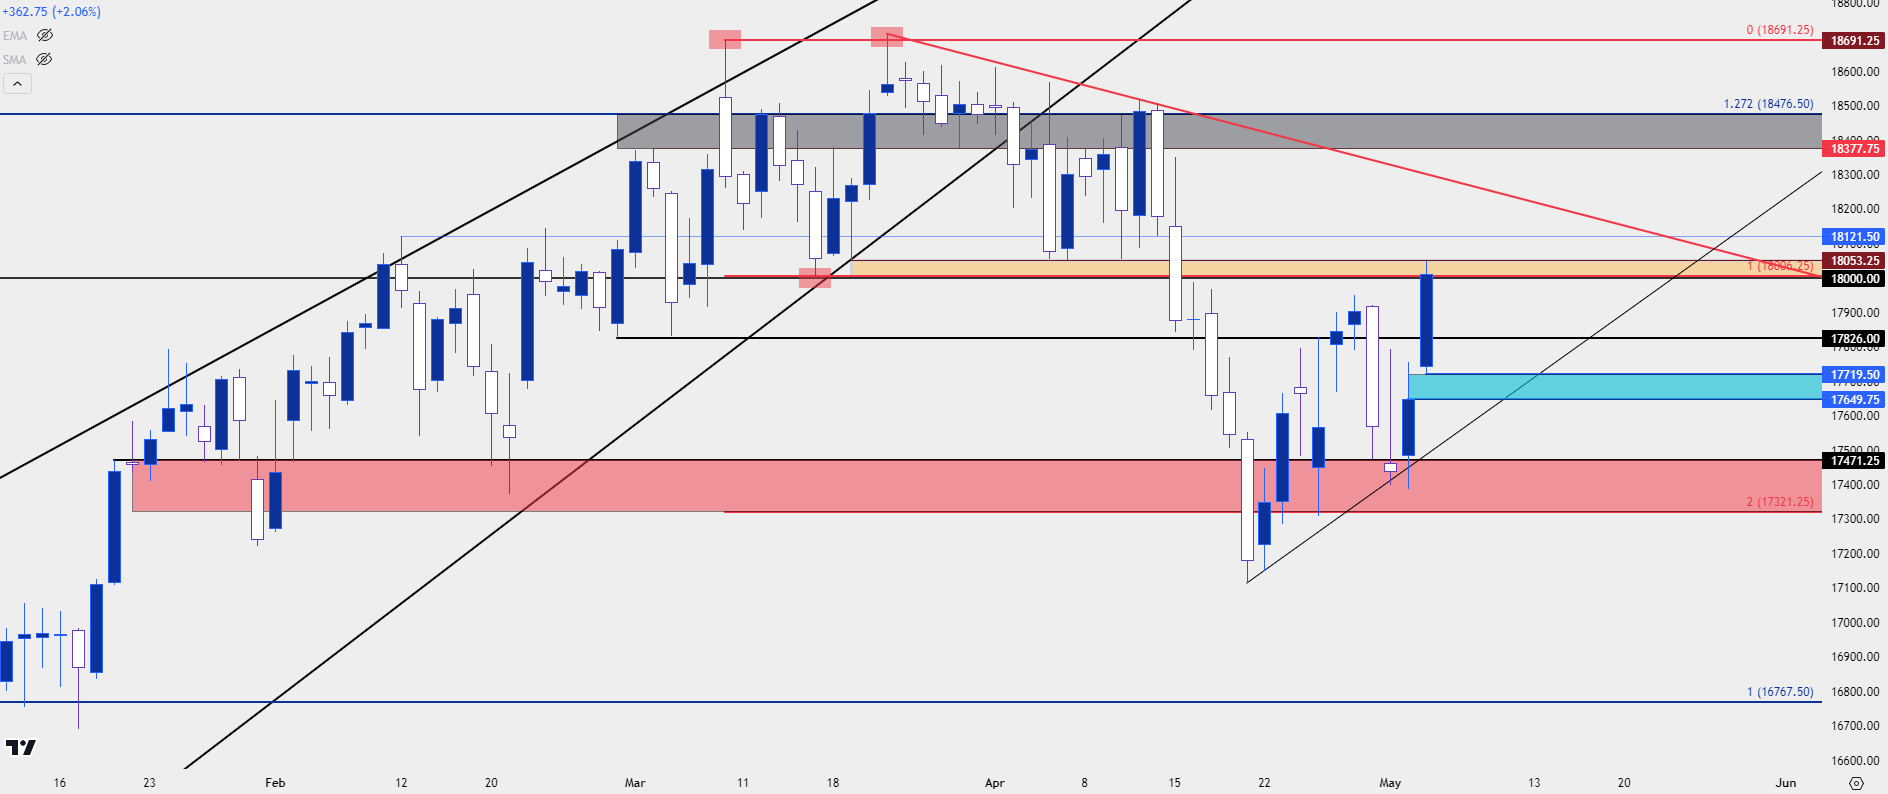
The Nasdaq was in a nasty spot just a couple of weeks ago as it completed the double top formation. But, since then, bulls have been making their way back and this week saw re-test of resistance at the neckline of that formation. Late week trade produced an especially large range, helped along by Apple earnings on Thursday and further pushed on Friday from the NFP report.
This does leave some open gap in Nasdaq 100 futures, which runs from 17,650 up to 17,720, and this could function as higher-low support for next week if bulls can hold the lows there. IF they can’t, however, 17,471 comes back into the picture and a breach of that would expose the April lows.
Nasdaq 100 Futures Daily Chart
 Chart prepared by James Stanley; data derived from Tradingview
USD: Has the Dollar Topped (for now)?
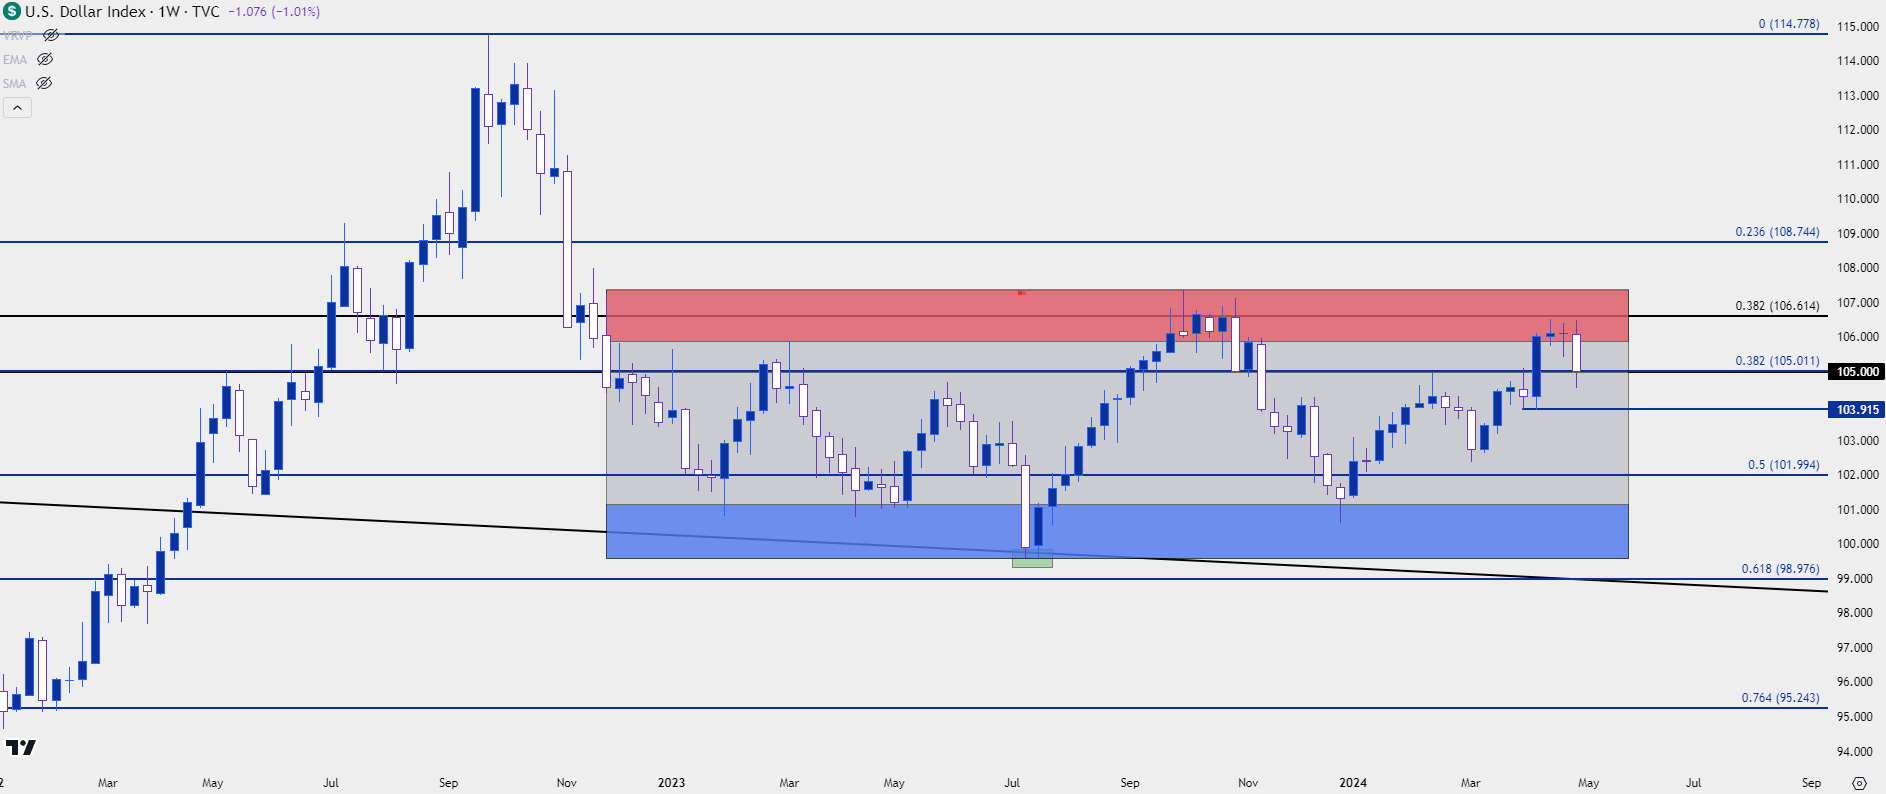
The U.S. Dollar has been in a range for more than 16 months now. And to be sure, this year has shown some consistent strength even in-light of a dovish Federal Reserve. Along the way, we’ve had NFP beating the headline expectation since November (until this Friday) and we’ve had Core CPI doing the same since November 14th.
With the Fed retaining such a dovish outlay even in light of economic strength in the backdrop, any signs of weakness in the U.S. economy could provide a punishing move to the USD.
At this point, the pullback from range resistance has held support at the 105.00 handle, and this caught an assist from the BoJ as they sold USD and bought Yen to try to support their currency.
This could keep the USD in a bullish spot as this is now a show of support at prior resistance: But if bears can keep pushing, they could soon re-take control of the matter. The prior higher-low of 103.92 remains of interest for that theme.
U.S. Dollar Weekly Price Chart
 Chart prepared by James Stanley; data derived from Tradingview
10 Year Yields
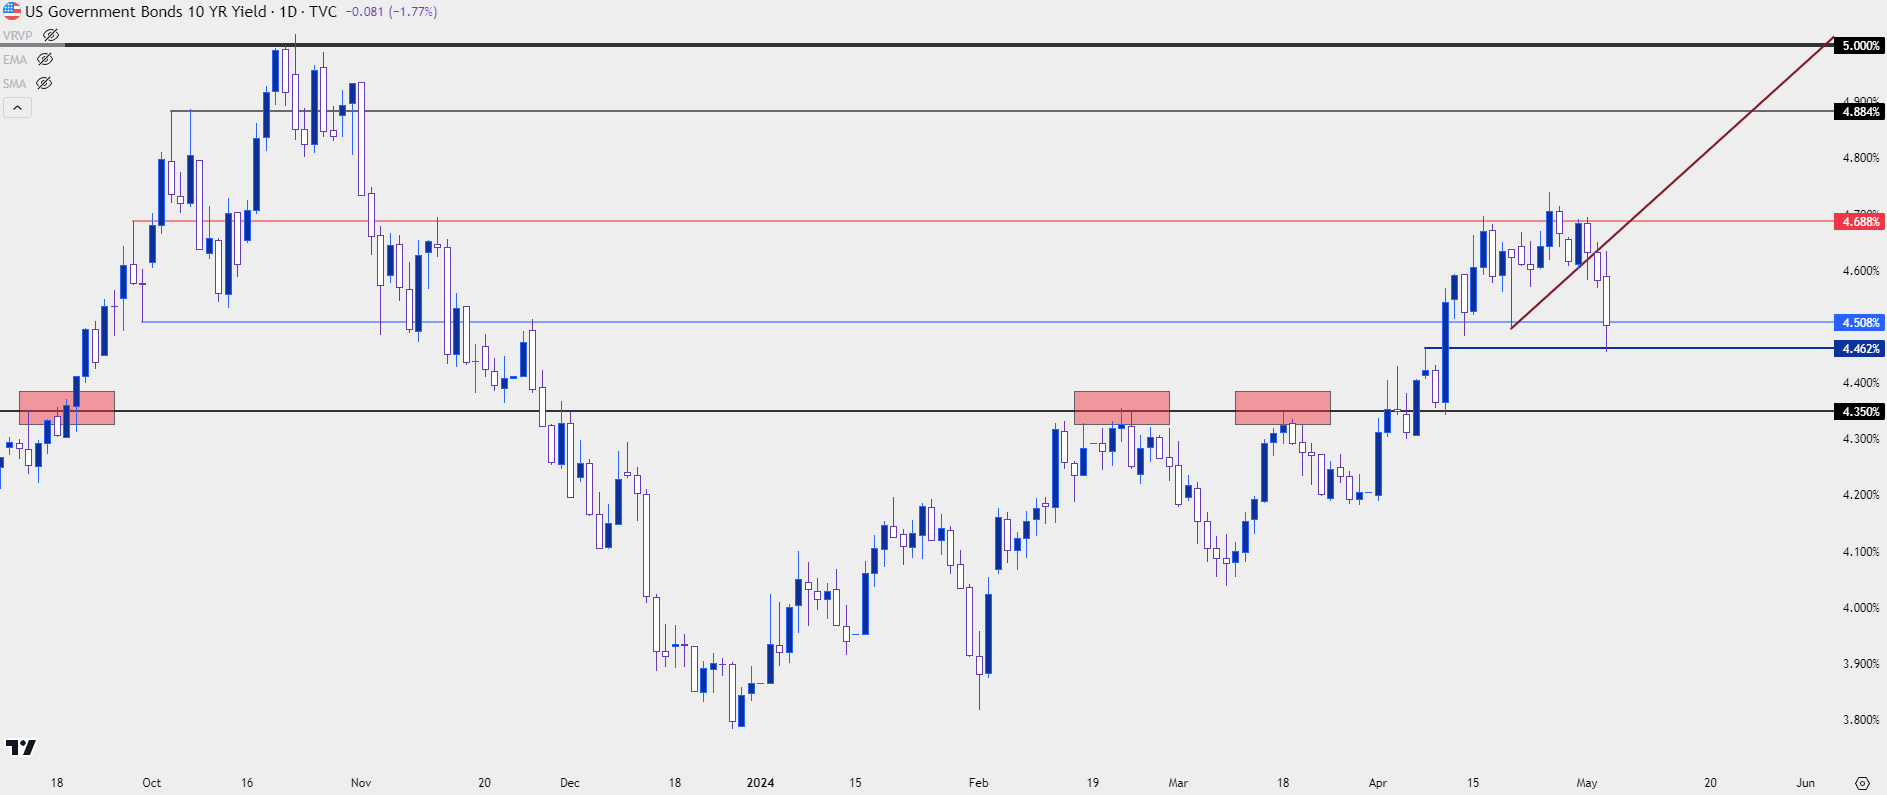
The Treasury buy back program took many by surprise, myself included. And the move in yields after that announcement has been significant.
I had previously plotted the 4.69% level as a significant spot and this ultimately ended up helping to cauterize the high. There was also a significant spot at 4.5%, and that was traded through aggressively in Friday trade, and that exposes the next major spot at 4.35%.
Like we saw in the last two months of 2023 trade, falling Treasury Yields can help to propel stocks and if this theme continues, it can further reinforce the idea that the Q2 pullback is over, and that bulls are making their way back with a very major assist from both the Federal Reserve and the U.S. Treasury.
US Treasury 10-Year Yields
 Chart prepared by James Stanley; data derived from Tradingview
--- written by James Stanley, Senior Strategist


