
U.S. Dollar Talking Points:
- The U.S. Dollar has continued to pull back from three-month highs set last week after the U.S. CPI report.
- While U.S. data remains strong, the Fed remains dovish given recent employment and inflation data and this plays into rate expectations, with markets still expecting four or more 25 bp cuts by the end of the year to a greater with a greater than 50% probability, as of this writing.
- This is an archived webinar and if you’d like to join the live webinar in the future, it’s completely free to register: Click here to register.
U.S. Dollar – Heading Towards the 200-Day
I reiterated in this webinar what I’ve been saying in prior webinars, which is that it feels as though the ‘natural flow’ in the U.S. Dollar is higher as taken from the daily chart. This is supported by the delta in data between the U.S. and trade partners, such as we saw with the NFP report earlier this month or the CPI report last week. But despite that strength and the potential for ‘inflation entrenchment,’ the Federal Reserve seems rather unbothered and that’s allowed for markets to hold on to aggressive expectations for cuts coming later this year.
In last week’s webinar the U.S. Dollar had just started to re-test the 105.00 handle, and as I said then, if or where bulls showed up would be telling for trend continuation potential. The same 103.98 level that I had looked at then remains in-play today but, so far, bulls haven’t been able to re-take the trend. There’s one more spot of interest for higher-low support on bullish continuation scenarios and that’s around the 200-day moving average, which hasn’t yet been tested for support despite holding as resistance in DXY for almost three full weeks.
If that can’t hold, the next spot of support that I’m tracking is around the 103-103.19 area, but if that comes into play there would be a failure from bulls to consider, and the 200-dma could potentially come back as lower-high resistance for bearish continuation scenarios.
U.S. Dollar Daily Chart
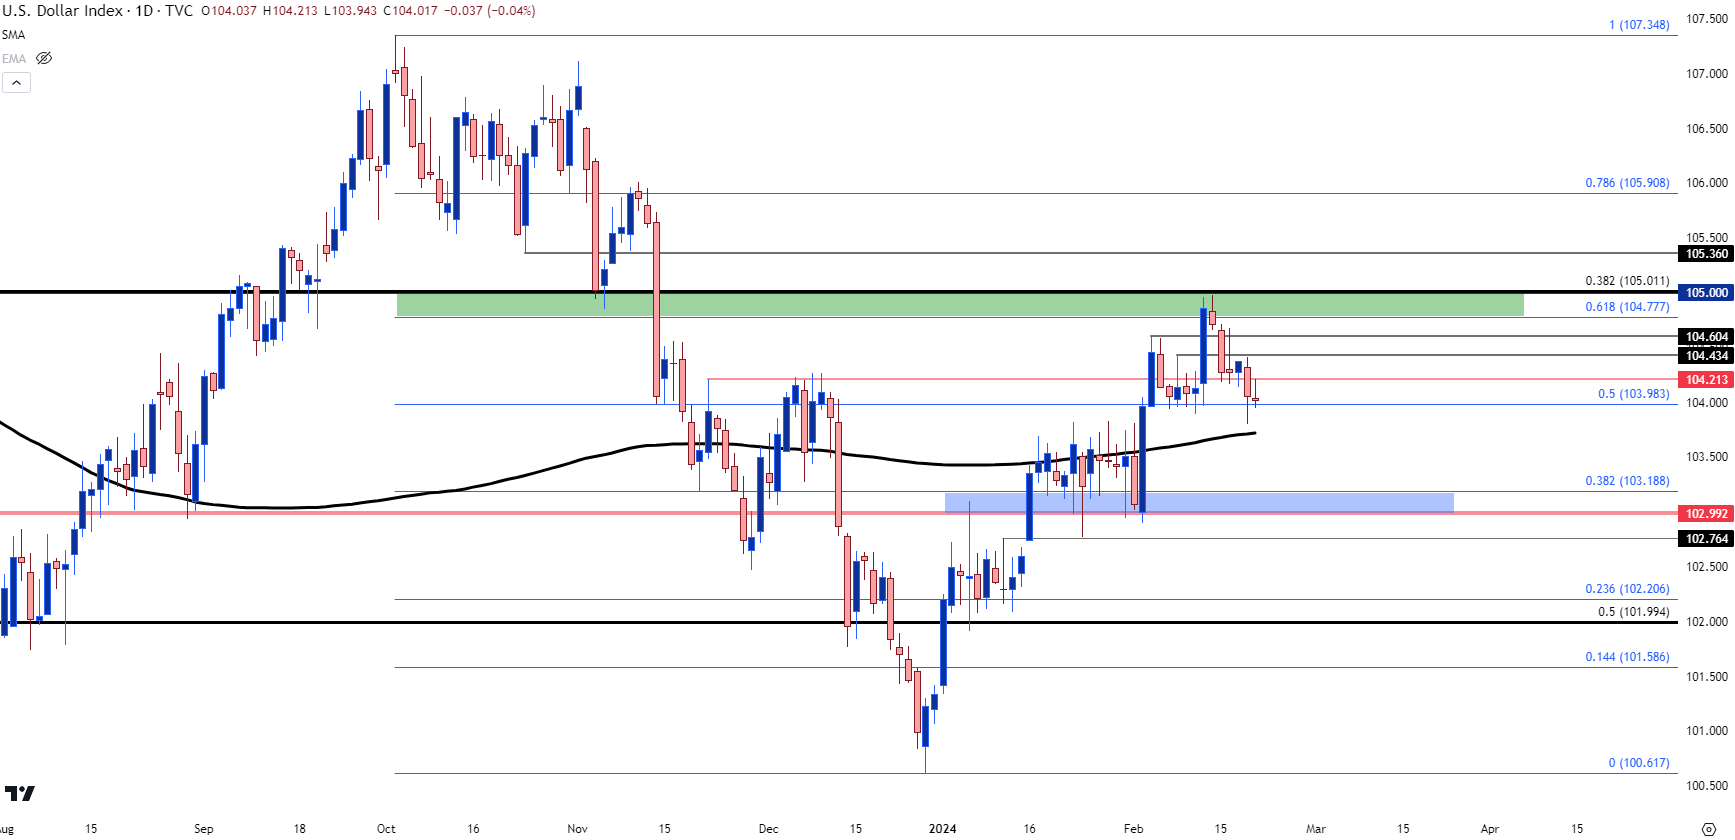 Chart prepared by James Stanley; data derived from Tradingview
EUR/USD
The Euro is 57.6% of the DXY quote and naturally as the U.S. Dollar has seen the bullish trend stall at the 105.00 zone, EUR/USD bulls have been pushing over the past week.
In EUR/USD, the pair has started to re-test the 200-day moving average, which held the highs yesterday. But as looked at in the article yesterday there’s also been the early build of bullish structure, and since then bulls have held higher-low support at the 1.0796 swing of prior resistance.
This keeps the door open for bulls to make a push and the next major spot on my chart beyond the 200-day moving average is the prior lower-high around the 1.0900 handle, shown below.
EUR/USD Four-Hour Chart
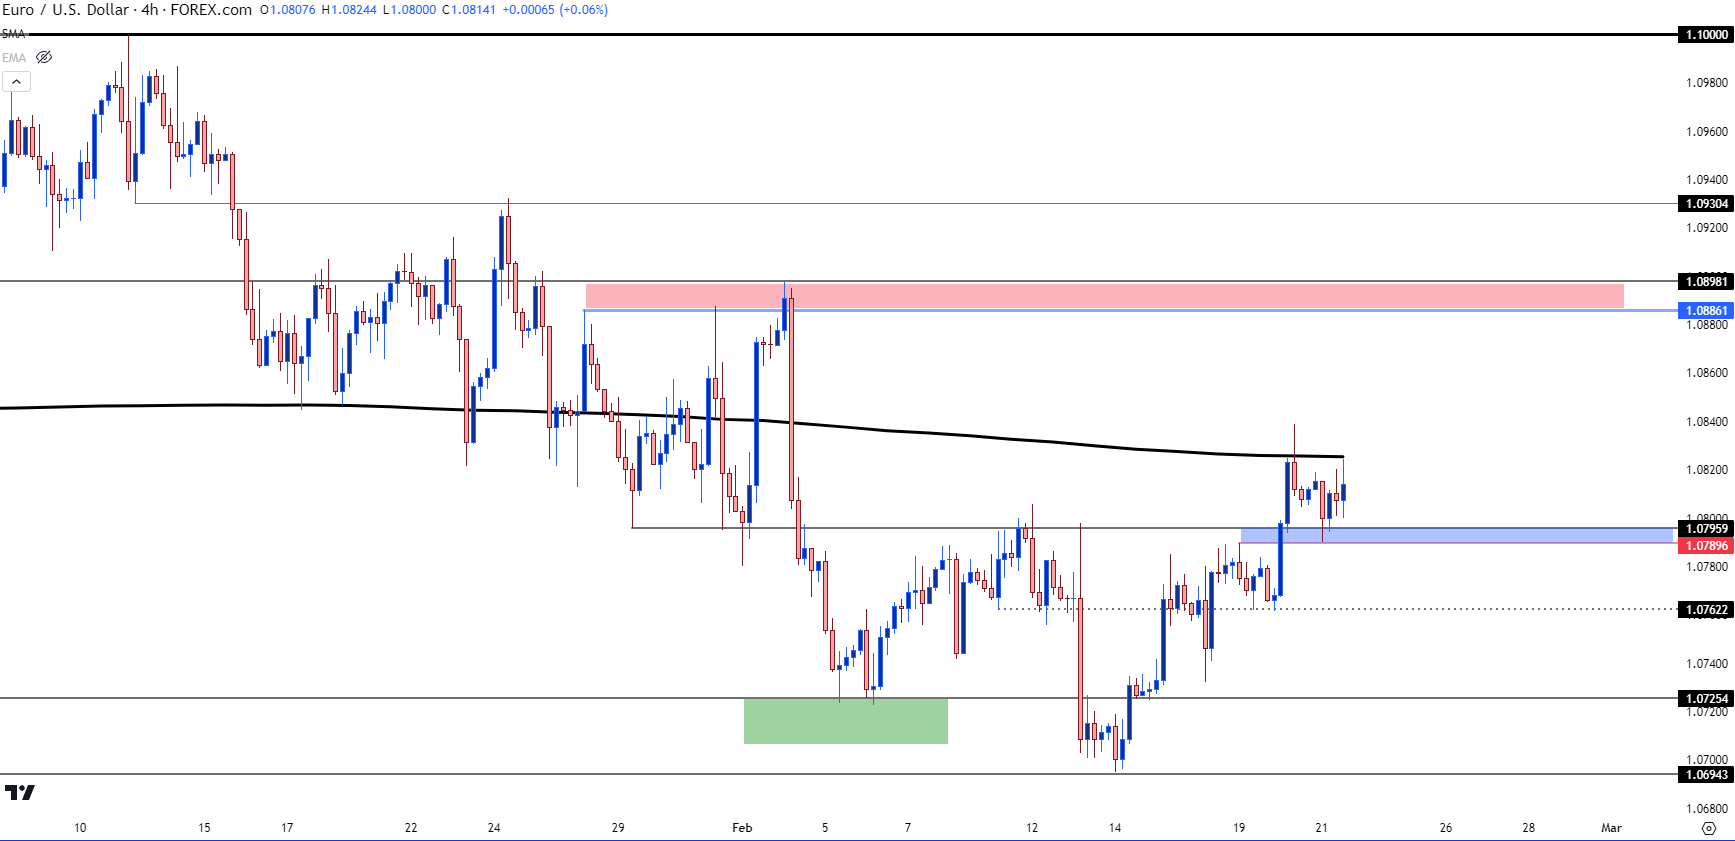
Chart prepared by James Stanley, EUR/USD on Tradingview
GBP/USD
Given that strength in the U.S. Dollar so far this year, the range in GBP/USD is somewhat impressive. This highlights how the British Pound has had strength on its own, enough to allow for mean reversion in the major pair even as DXY set higher-highs and higher-lows elsewhere. So, deductively, if we are going to see a larger bout of USD strength, GBP/USD could be attractive from that lens. And on the fundamental side, inflation in the U.K. remains high as we saw with last week’s print of 5.1% for Core CPI.
I had looked into the pair last week, plotting around the 200-day moving average. That’s since come in to help hold a higher-low above the prior week’s low and this can keep the door open for bulls as the range retains potential for continued mean reversion.
GBP/USD Daily Price Chart
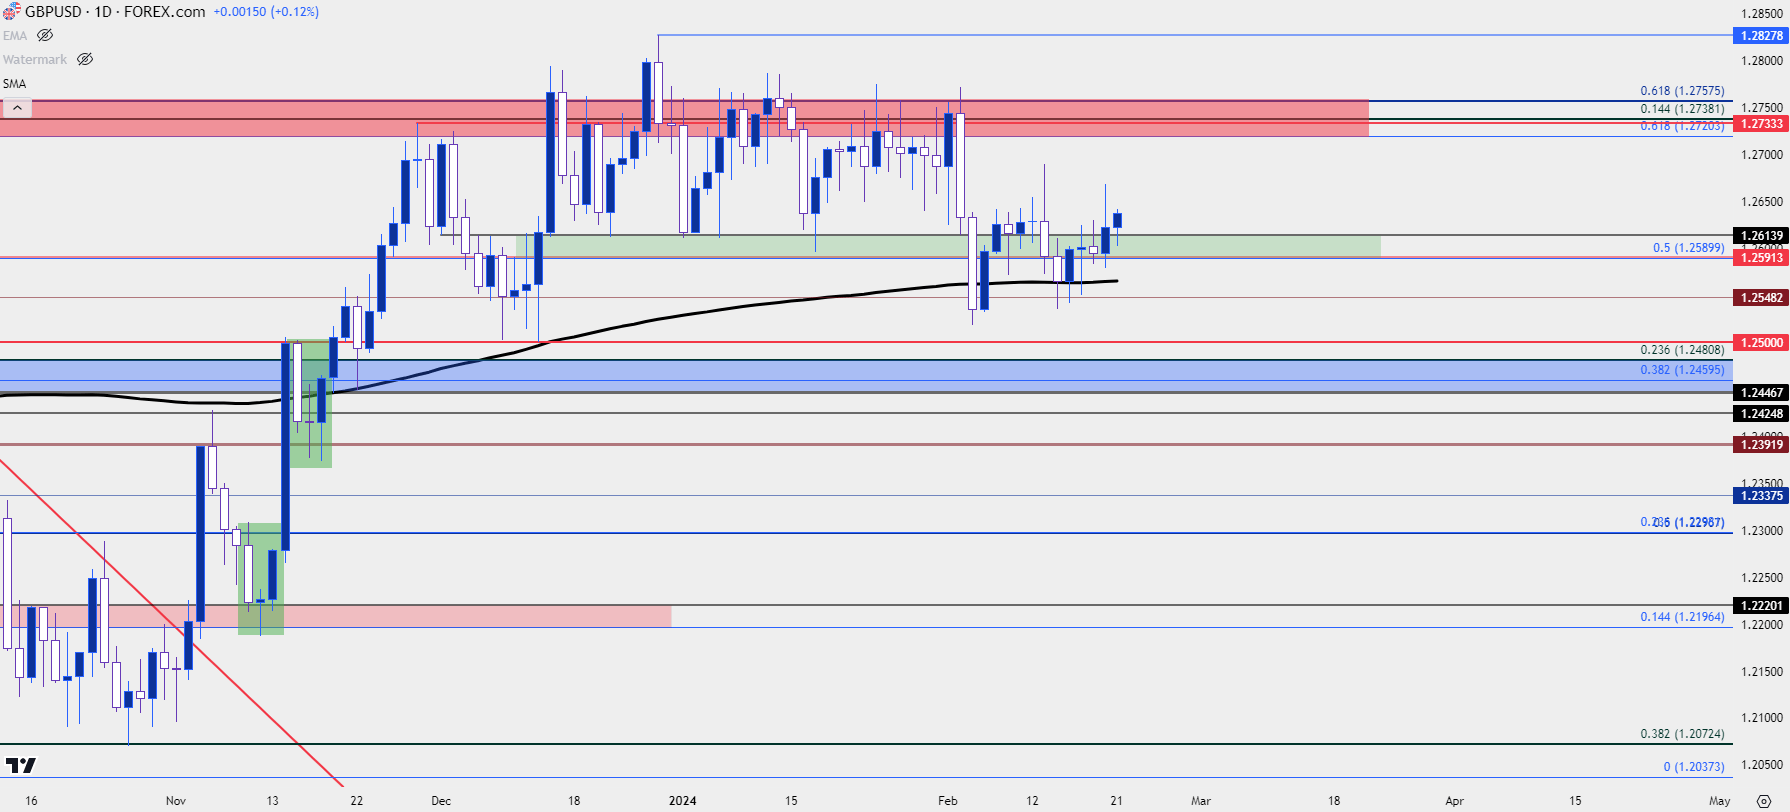 Chart prepared by James Stanley, GBP/USD on Tradingview
USD/JPY
On that front of potential for USD-weakness, USD/JPY would carry some attraction, as well. That was a major push point for reversals in the pair in Q4 of the past two years, and already USD/JPY has jumped back to the same resistance zone that held the highs in each instance. That runs from 150-152.00 and as of this writing, USD/JPY continues to grapple around the 150 psychological level.
Shorter-term, there’s a descending triangle and a rising wedge in-play, both of which are often tracked for bearish potential.
USD/JPY Daily Chart
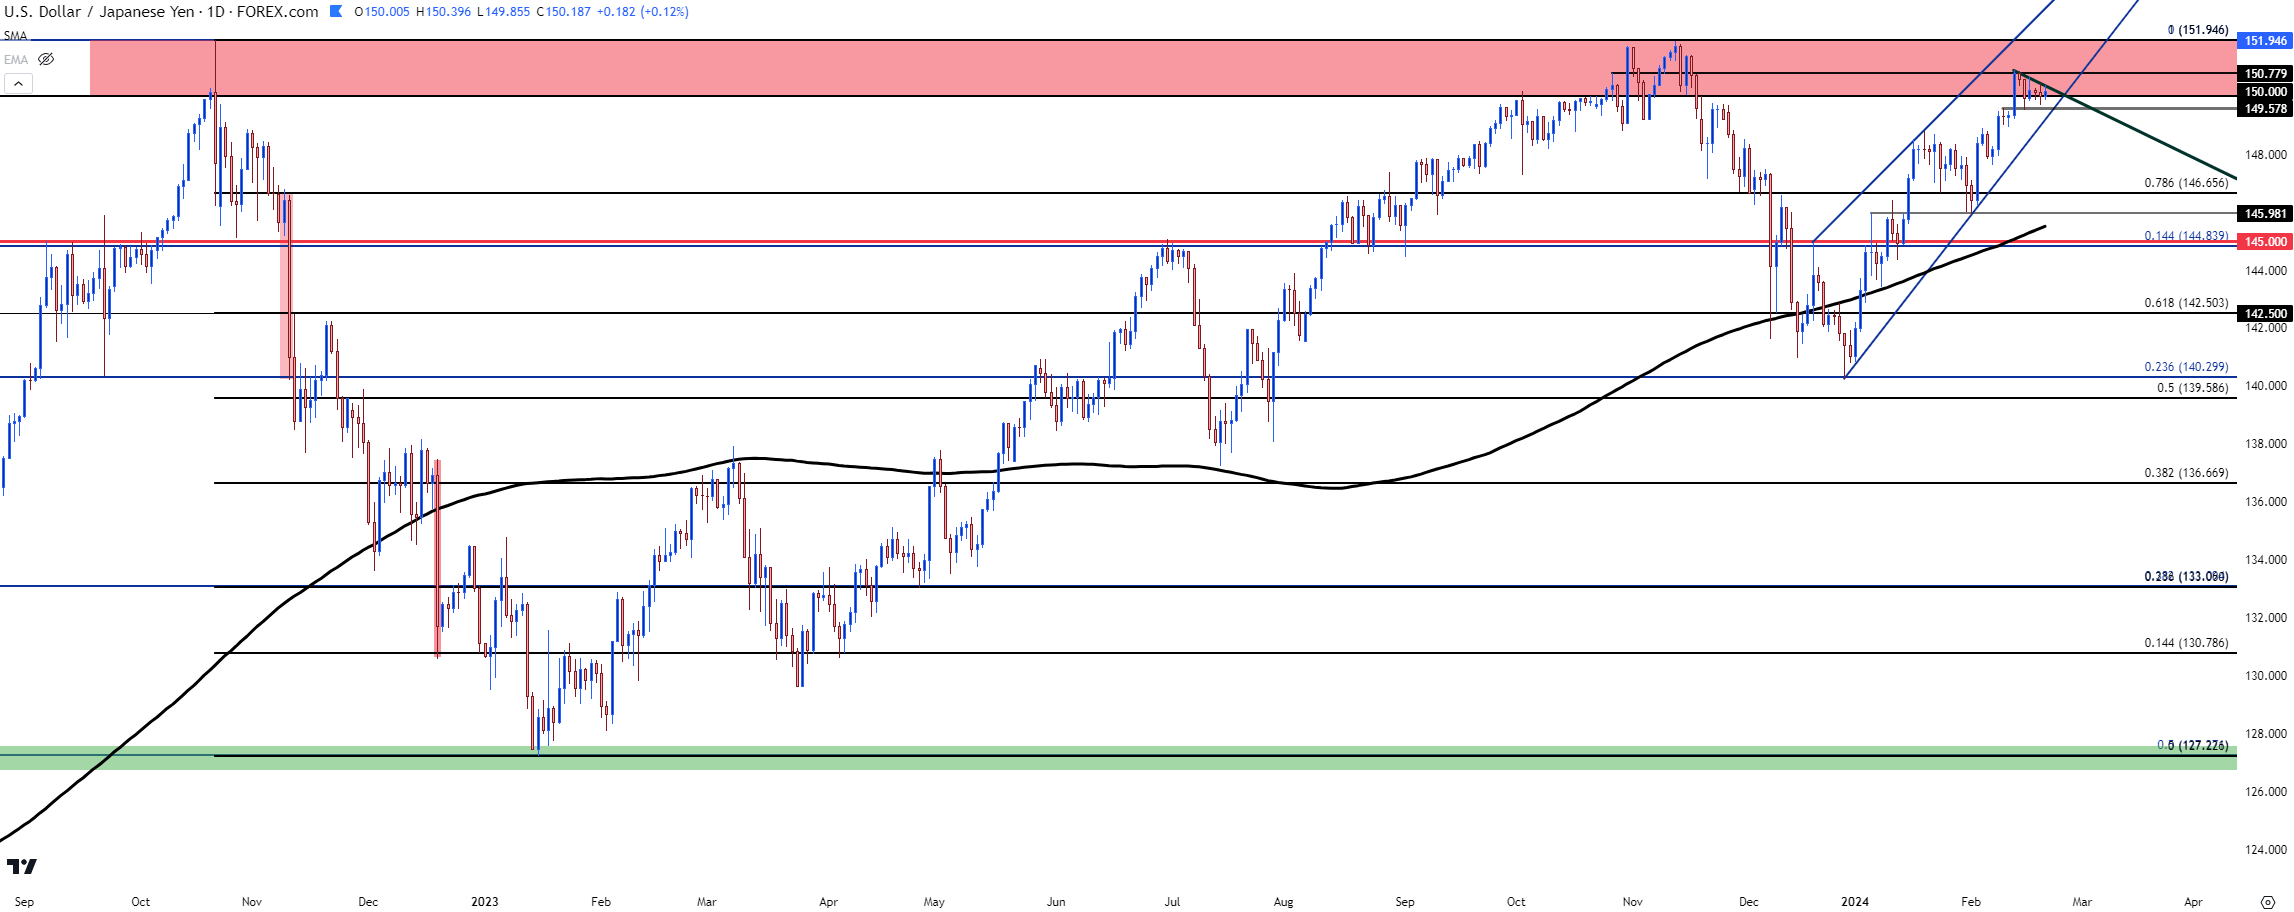 Chart prepared by James Stanley, USD/JPY on Tradingview
XAU/USD (Gold)
I wrote about gold in this week’s forecasts and the point that I tried to make there remains: Bears had an open door last week after the CPI report which allowed for the first test below the $2k psychological level in 2024 trade. But it was the comment from Chicago Fed President Austan Goolsbee a day later that helped to set a low, after which bulls have largely been in-control ever since.
Resistance remains just inside of the 2031 level and in the webinar, I highlighted an earlier ascending triangle formation that failed. I tried to use that as a way of highlighting why and how formations can be effective, and it’s not in their capacity to predict the next move as much as it is to offer context for risk management, so that if the formation doesn’t fill-in, loss mitigation can be prioritized. With that said, bulls showed up at $2,020 and have been pushing since 2PM ET, which is around the time of the FOMC minutes release. At this point the daily bar is working as a doji and if that completes with indecision, it puts that bullish perspective in question.
I remain of the mind that gold has the potential to put in a bullish trend above the $2k psychological level, but that it happens after the Fed has formally flipped on policy. And with U.S. data remaining strong it seems as though that’s getting further away and I think this is one reason the CPI print last week helped to create the first test below $2k so far in 2024. But as we saw the morning after the Fed really doesn’t appear as though they want to entertain hikes and that dovish posture can keep bulls responding to support in gold until something shifts.
Gold (XAU/USD) Daily Price Chart
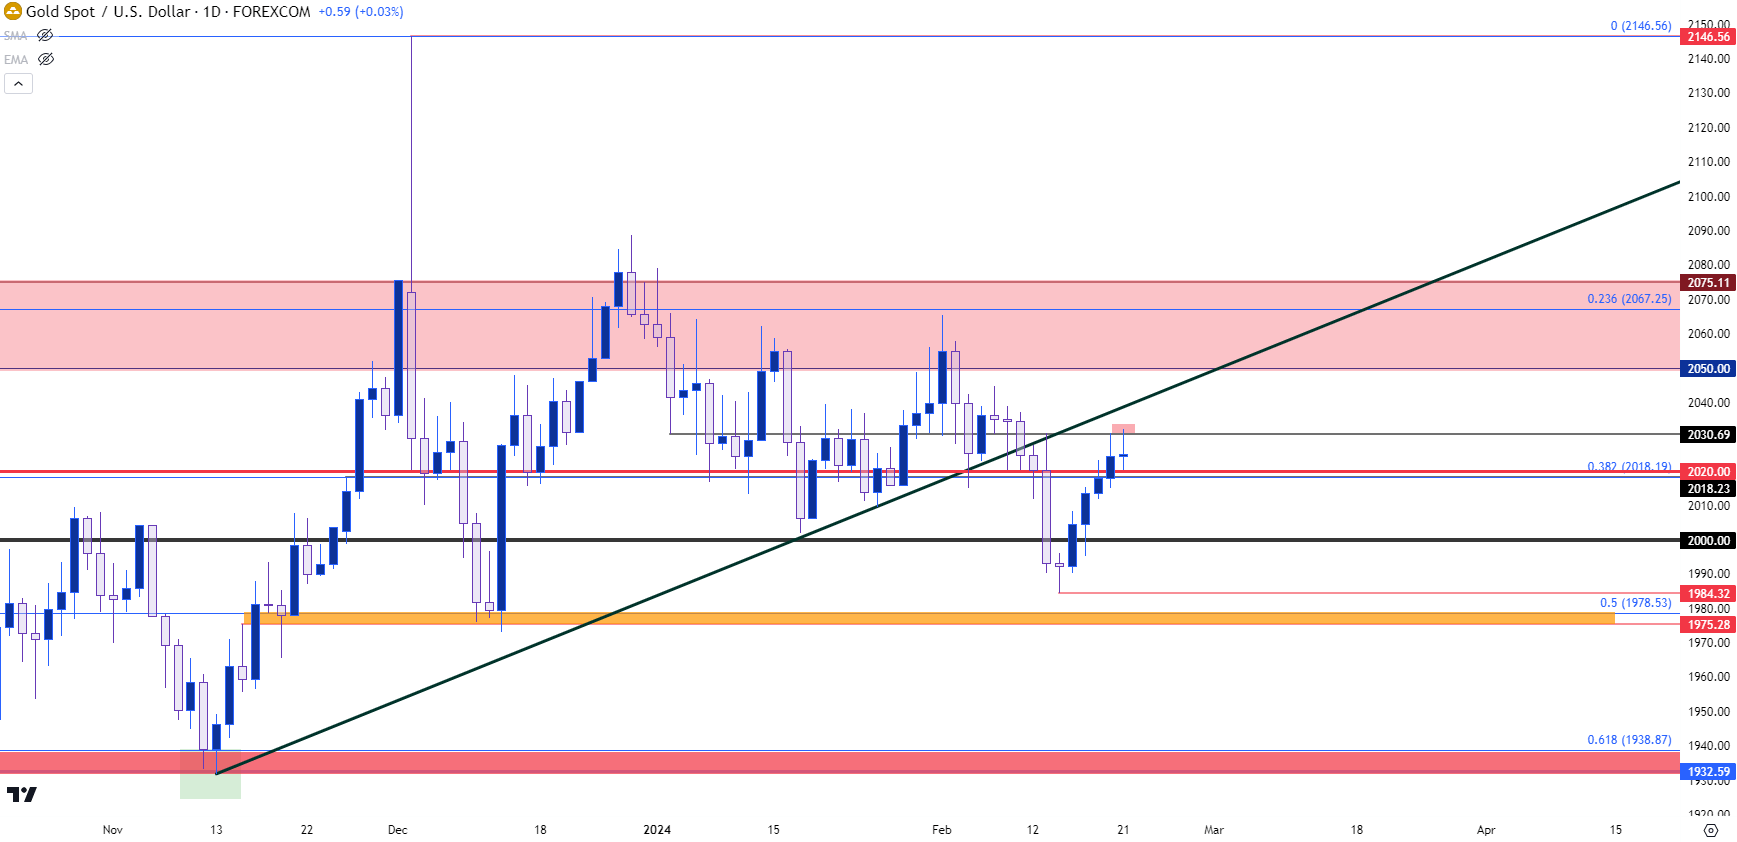 Chart prepared by James Stanley, Gold on Tradingview
--- written by James Stanley, Senior Strategist


