
US Dollar, EUR/USD, Gold, USD/CAD Talking Points:
- The US Dollar is pulling back after setting a fresh 2023 high last Tuesday.
- In the prior webinar I had looked at the oversold state of major markets like EUR/USD, Gold and SPX. Those have since pulled back and the question now is whether sellers use that pullback to continue the bearish trend(s).
- I’ll be discussing these themes in-depth in the weekly webinar on Tuesday at 1PM ET. It’s free for all to register: Click here to register.
The US Dollar set a fresh yearly high last Tuesday and, as of this writing, is working on its fifth consecutive daily loss since then. As we talked about in last Tuesday’s webinar the USD had become overbought from multiple vantage points and the post-FOMC sell-off in stocks had priced in very quickly.
This led to some outlier items like oversold RSI readings on the daily chart of both EUR/USD and SPX. In both cases, that was the first such occurrence in 2023 trade. Gold saw RSI drop to below-20 on the daily chart, something that’s only happened three other times in the past 22+ years. As I had said last week, the bar for sellers to continue those trends was incredibly high, and since then there’s been pullback, even with what was a strong NFP report.
The question now is whether that’s it, whether this pullback in EUR/USD, Gold, SPX and the USD have already run their course or whether there’s more room to run.
In the US Dollar the big item on the calendar for this week is inflation data, with PPI set to release tomorrow morning and CPI on Thursday morning. We’ve already seen the Dollar trying to work support from the 105.69-105.88 zone that I had looked at last Friday. There are more items of interest below, with the 105 level looming large as a possible support level in the event of a deeper pullback move.
From the weekly chart – last week was the first bearish week for DXY since mid-July, when the currency had attempted to breakdown. The weekly bar closed as a gravestone doji, which can highlight pullback potential after a prolonged bullish move. So far this week, we’ve seen that pullback in process. The last time we had seen ten weeks or more of consecutive DXY gains, the USD took a two-week break before resuming the trend.
US Dollar - DXY Weekly Price Chart (indicative only, not available on Forex.com platforms)
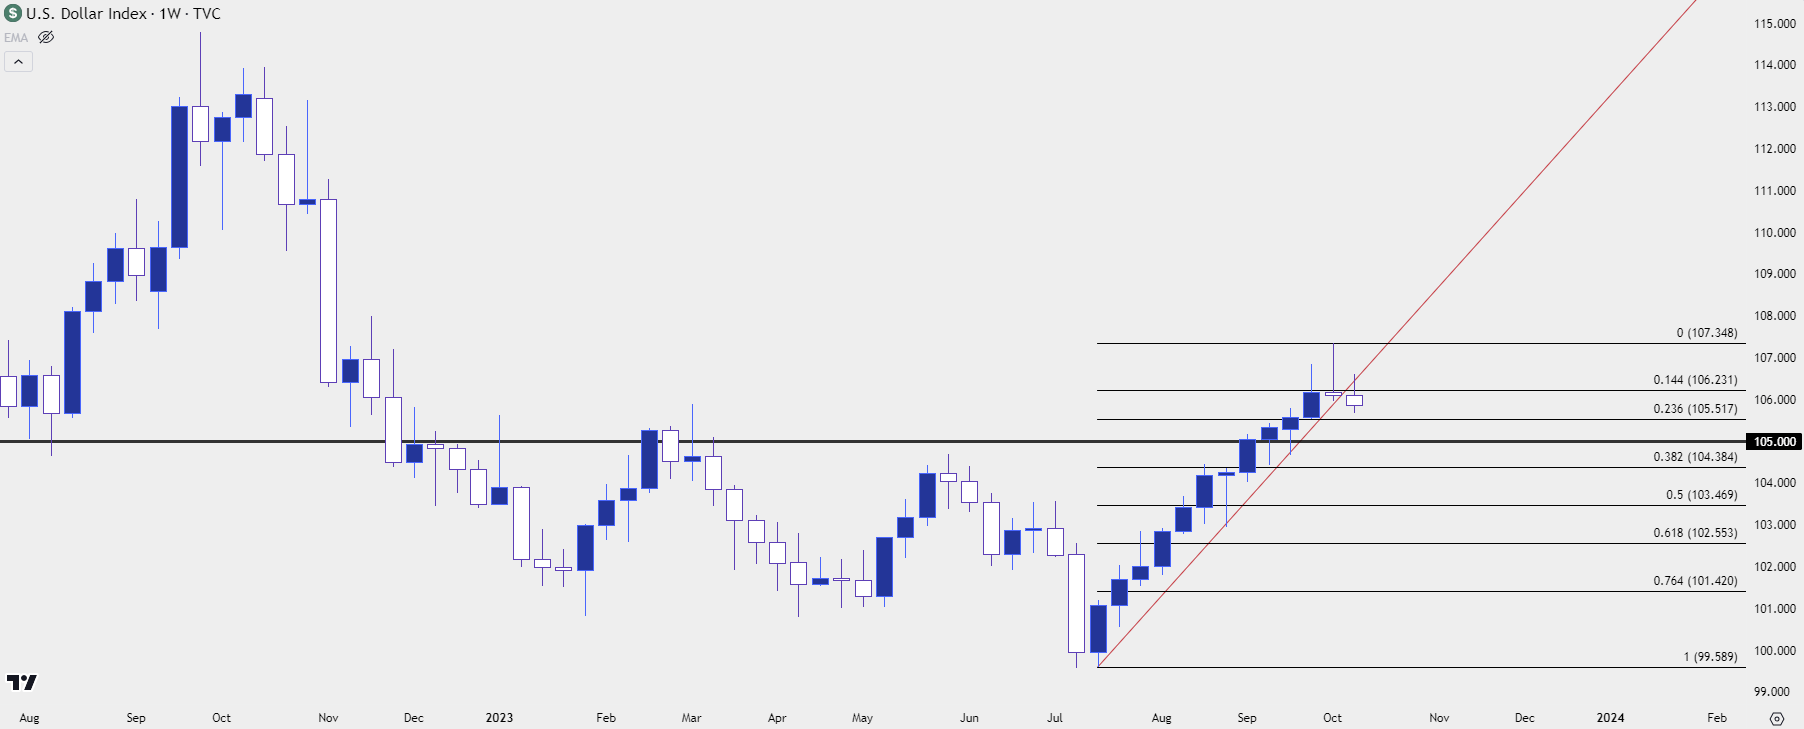 Chart prepared by James Stanley; data derived from Tradingview
From the daily chart, we can get a better view of current support in the 105.69-105.88 area. This is still very near the high from last week, so if we do see bulls show up to continue the trend from here we could be looking at a similar saga of overbought conditions at some point next week. So, there could be continued pullback while the bigger picture bullish trend retains potential.
Of issue will be the Thursday CPI report and in a related matter, whether EUR/USD can muster a deeper pullback.
US Dollar - DXY Daily Price Chart (indicative only, not available on Forex.com platforms)
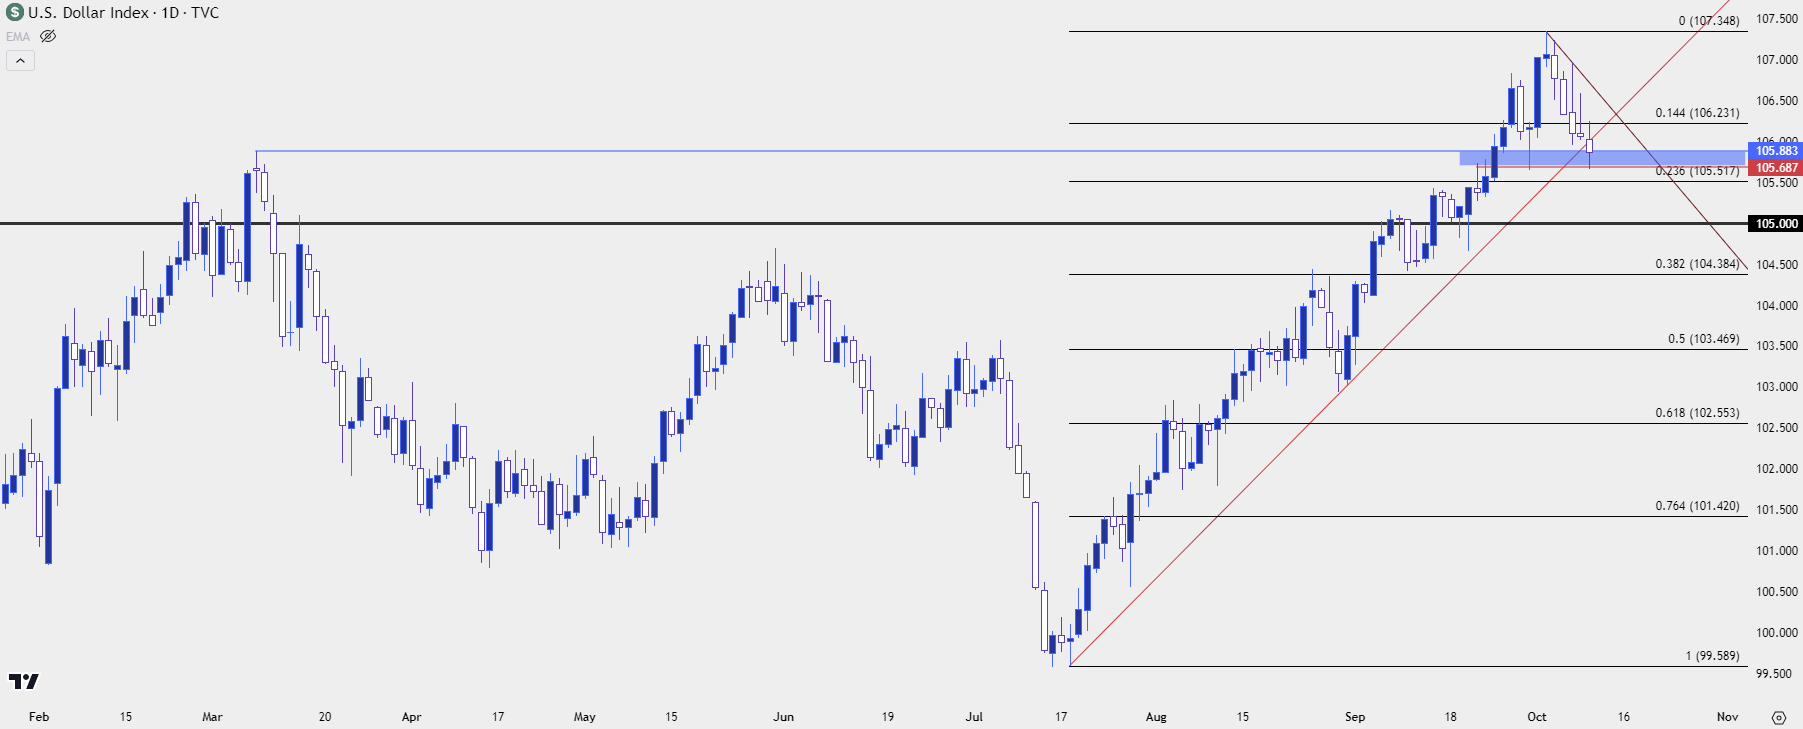 Chart prepared by James Stanley; data derived from Tradingview
EUR/USD 1.0500
In last week’s webinar I spoke for some time about psychological levels, specifically the 1.0500 test in EUR/USD. At the time, the bearish trend had begun to show stall just below the big figure and as I had shared then, such prices can sometimes take time and effort to finally give way.
EUR/USD started pulling back shortly after, but it was the showing around NFP that remains of interest today. Despite a very strong headline read the US Dollar continued to pullback, which highlights possible overbought concerns when a market fails to gain on positive news. In EUR/USD, that worked in the opposite direction as the NFP print brought a quick rush of USD-strength (and EUR/USD weakness), which essentially just built into the next swing.
EUR/USD has continued to pullback since, with another higher-low and another higher-high this morning.
The next resistance level is a big one at 1.0636. This was the swing low in March of 2020 and it came back into the picture in late-May, helping to set another swing low. That price is also nearing confluence with the bearish trendline taken from the July and late-August swing highs in the pair.
Bulls may have more scope to run, particularly if the CPI report falls in a particular way, as the pair had showed its first oversold RSI reading on the daily since just before it had bottomed last year. If bulls can force through 1.0636, there’s additional resistance potential at 1.0673 and then 1.0766.
EUR/USD Four-Hour Chart
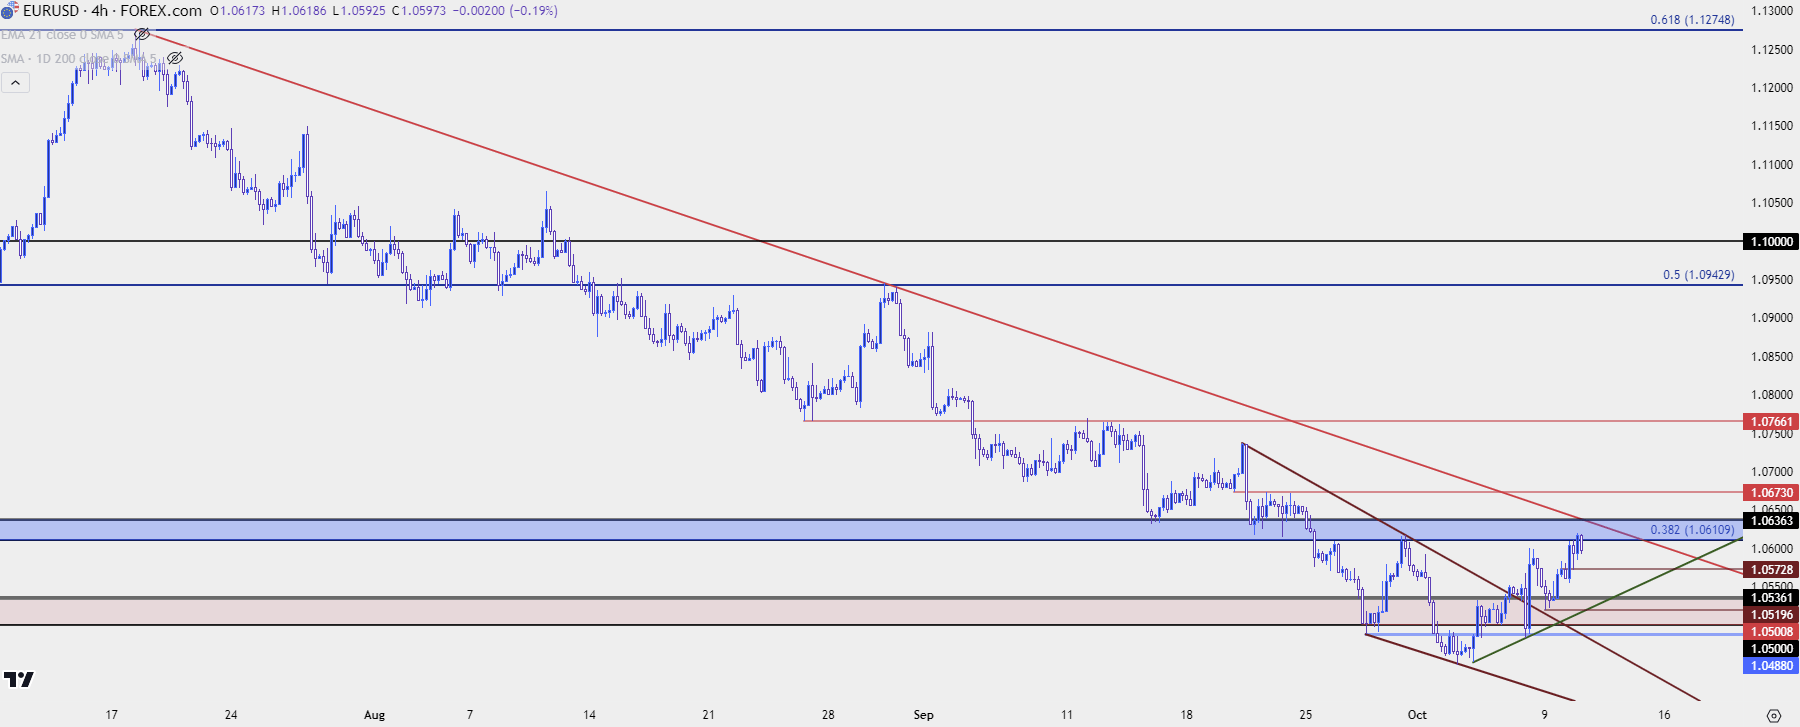 Chart prepared by James Stanley, EUR/USD on Tradingview
Gold: What Happens After Deep Oversold?
I talked about this one quite a bit last week. Gold put in a steep fall after the FOMC rate decision and given the move in rates there was a logical reason behind the move. But, as we saw elsewhere, matters had developed really fast; so fast, in fact, that RSI pushed below the 20 level on the daily chart, which is somewhat rate for spot Gold. I wrote about this last Thursday, but spot Gold had only shown a daily RSI close below 20 three times prior to last week’s instance.
Oversold RSI, of course, does not prevent fresh sellers from entering the market. But, it does highlight caution from chasing and given the spinning top for last Tuesday’s daily bar, followed by two dojis, the door was starting to open for pullback.
That led into yesterday’s outing, which was the largest one-day gain for spot gold in more than five months. This sets the stage where short-term strength meets a longer-term trend, and the question is whether sellers use this bounce to take on shorts and continue the bearish trend. RSI is no longer oversold on the daily chart and now that price has perched closer to prior support levels, there remains opportunity for sellers – with the very viable question as to whether they’ll jump at the chance or wait for a deeper pullback.
The next key resistance in gold is the 1880-1885 area that had previously helped to set support. If bulls can’t get all the way up there, there is a possible spot at 1873. If they can breach through that zone, the next level of interest appears around 1903.
Spot Gold (XAU/USD) Daily Chart
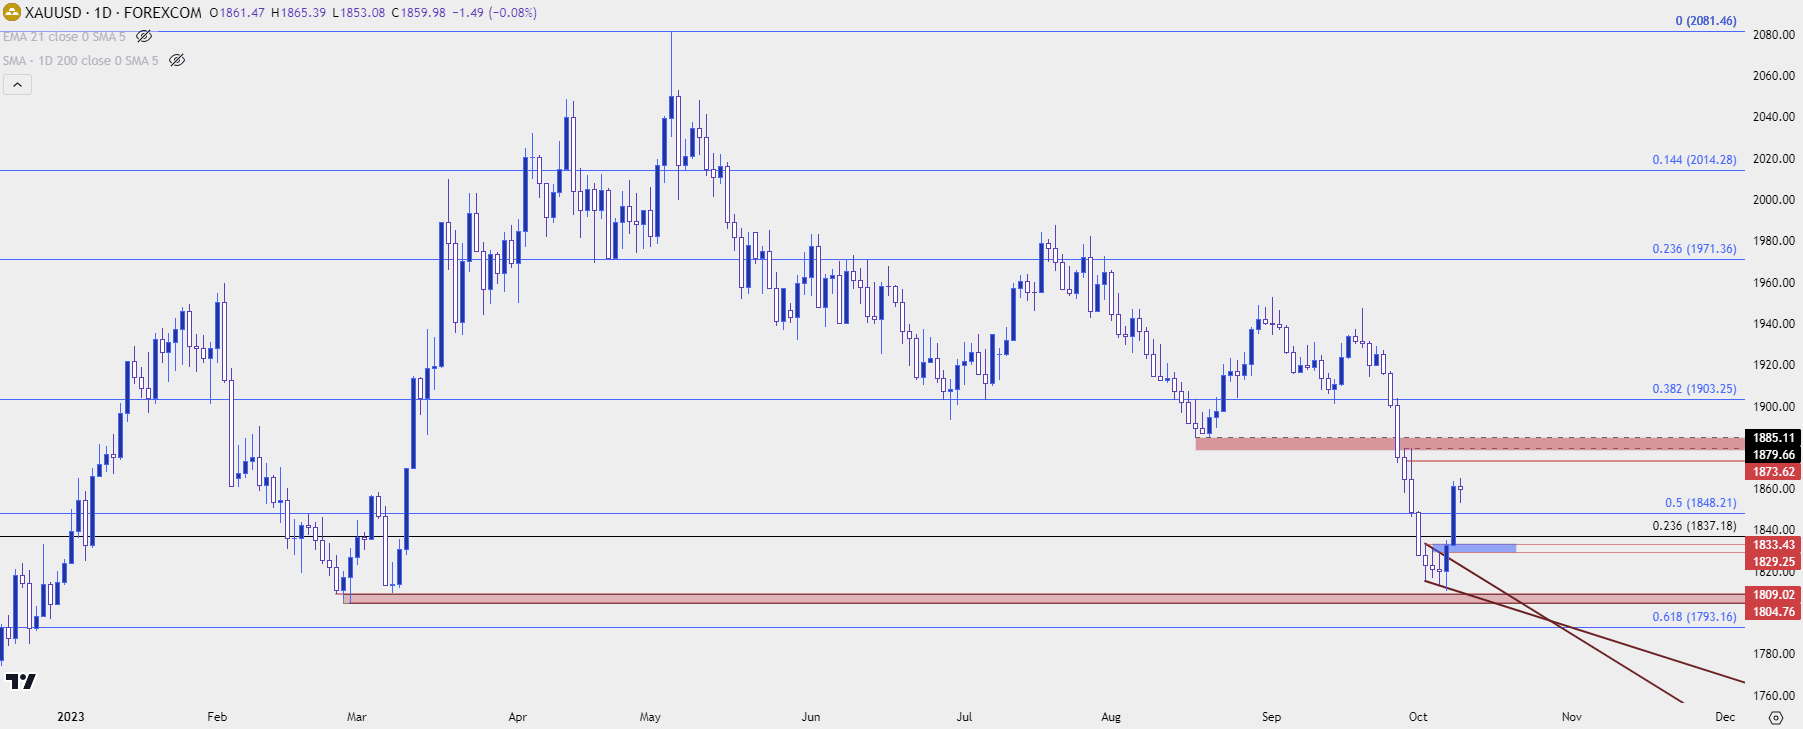 Chart prepared by James Stanley, Gold on Tradingview
USD/CAD
USD/CAD is of interest for a few reasons, especially if the USD bullish trend remains on its back foot for a while longer.
I had talked about this yesterday, but USD/CAD gained as much as 5.29% from the July low up to last week’s high. This is less than the 7.79% in DXY or the -7.34% move in EUR/USD over the same time frame. The explanation for the lagging performance in the pair is the inclusion of CAD-strength, which could make the USD pair a sub-optimal venue to track themes of USD-strength continuation.
It could, however, possibly make an argument for looking to with themes of Euro or British Pound weakness for those that are looking to incorporate CAD-strength into their approach.
In USD/CAD, there remains bullish scope as price is coming off of a fresh higher-high and there’s higher-low potential at the 1.3500 psychological level.
USD/CAD Daily Chart
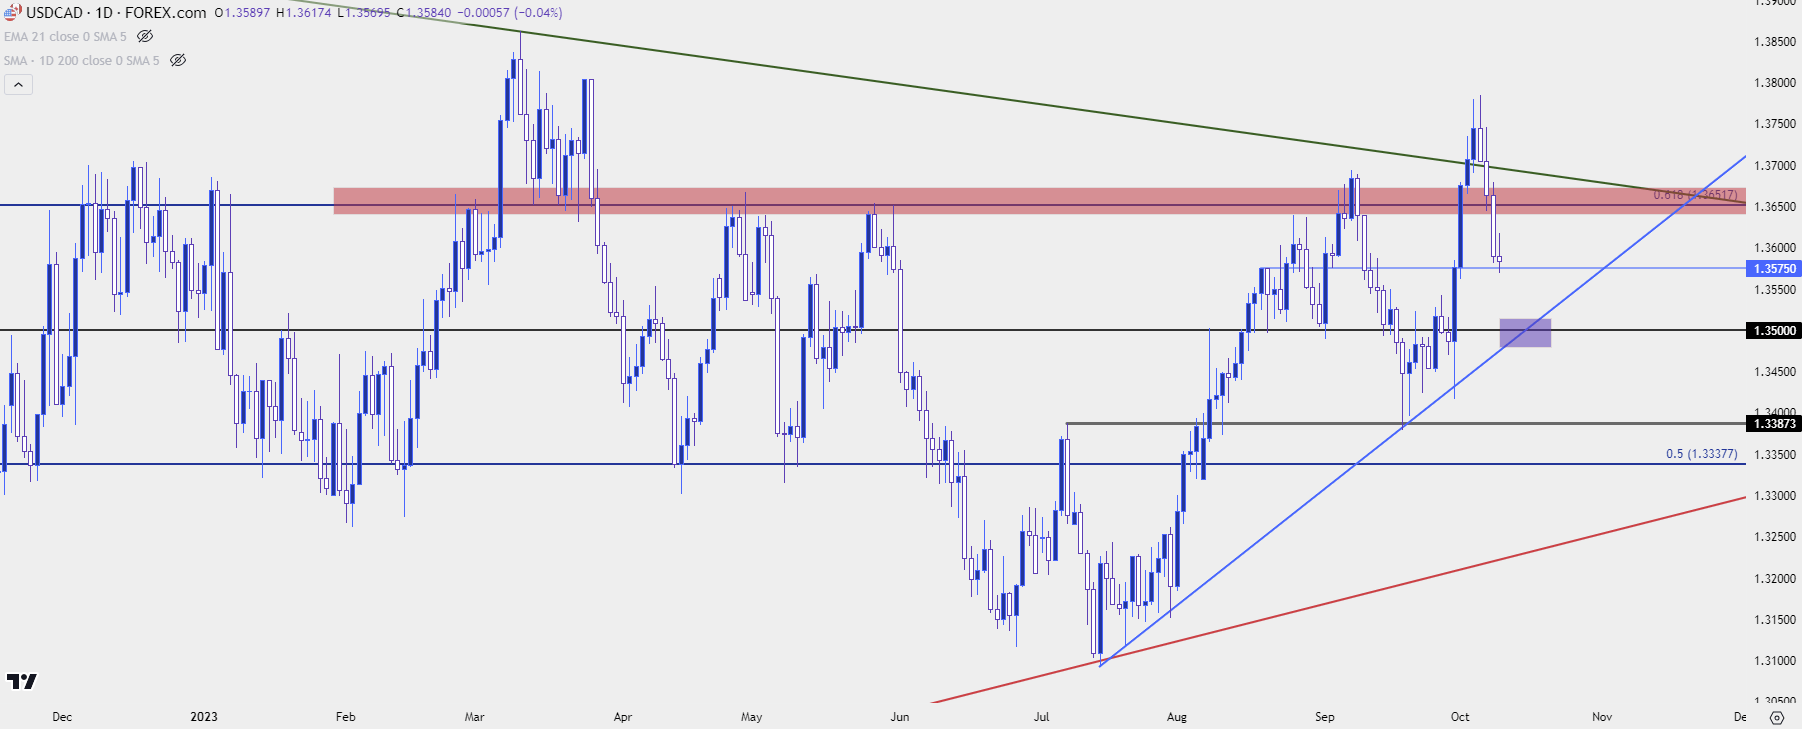
Chart prepared by James Stanley, USD/CAD on Tradingview
EUR/CAD
From the weekly chart, we can see price attempting to drive fresh 2023 lows just a couple of weeks ago which was met with a dragonfly doji. That led to strength last week, with the 1.4500 resistance level coming back into the picture. A hold of resistance at that level can keep the door open as a lower-high following the lower-low a couple of weeks ago.
EUR/CAD Weekly Price Chart
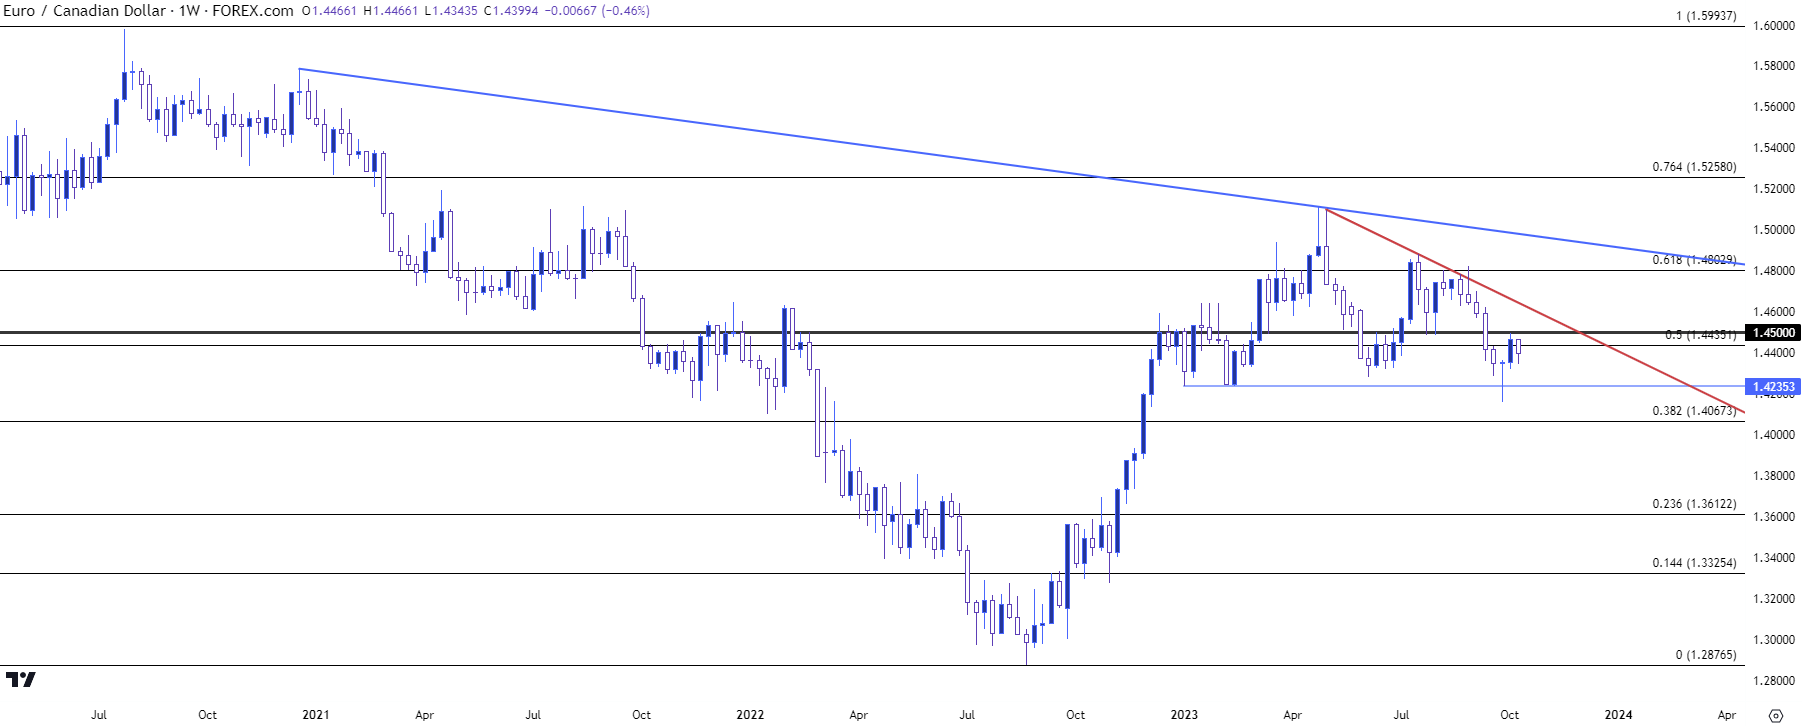 Chart prepared by James Stanley, EUR/CAD on Tradingview
--- written by James Stanley, Senior Strategist


