US Dollar Price Action Setups:
- The US Dollar extended its sell-off last week, grinding into support in the latter portion of the week.
- That support was the same that was in-play through Q2, and on the other side of the Greenback EUR/USD is now near its own range resistance. GBP/USD has pushed a strong breakout as it nears a re-test of the 1.3000 handle, and USD/JPY is grasping on to a trendline after last week’s suspected intervention from the BoJ.
- I’ll be looking into these setups in tomorrow’s price action webinar, and you’re welcome to join. Click here to register.
The US Dollar extended its Q3 sell-off last week with another push on the Thursday release of US CPI data. Inflation showed another iteration of progress, and this pushed rate cuts bets in the US, with markets now expecting three rate cuts by the end of the year to a current probability of 57.7%, as of this writing.
Rate Probabilities by End of the Year
 Chart prepared by James Stanley; data derived from CME Fedwatch
With scant expectations for any material changes at the rate decision later this month, deductively, that would spell rate cuts at three consecutive meetings around the US general election. Three consecutive rate cuts would be an aggressive stance as the bank usually preferred to go slower with policy moderation, reading data after a move to gauge impact. To cut thrice in a row wouldn’t be unheard of, but it would illustrate a Central Bank concerned about economic growth and looking to gain a boost through lower rates.
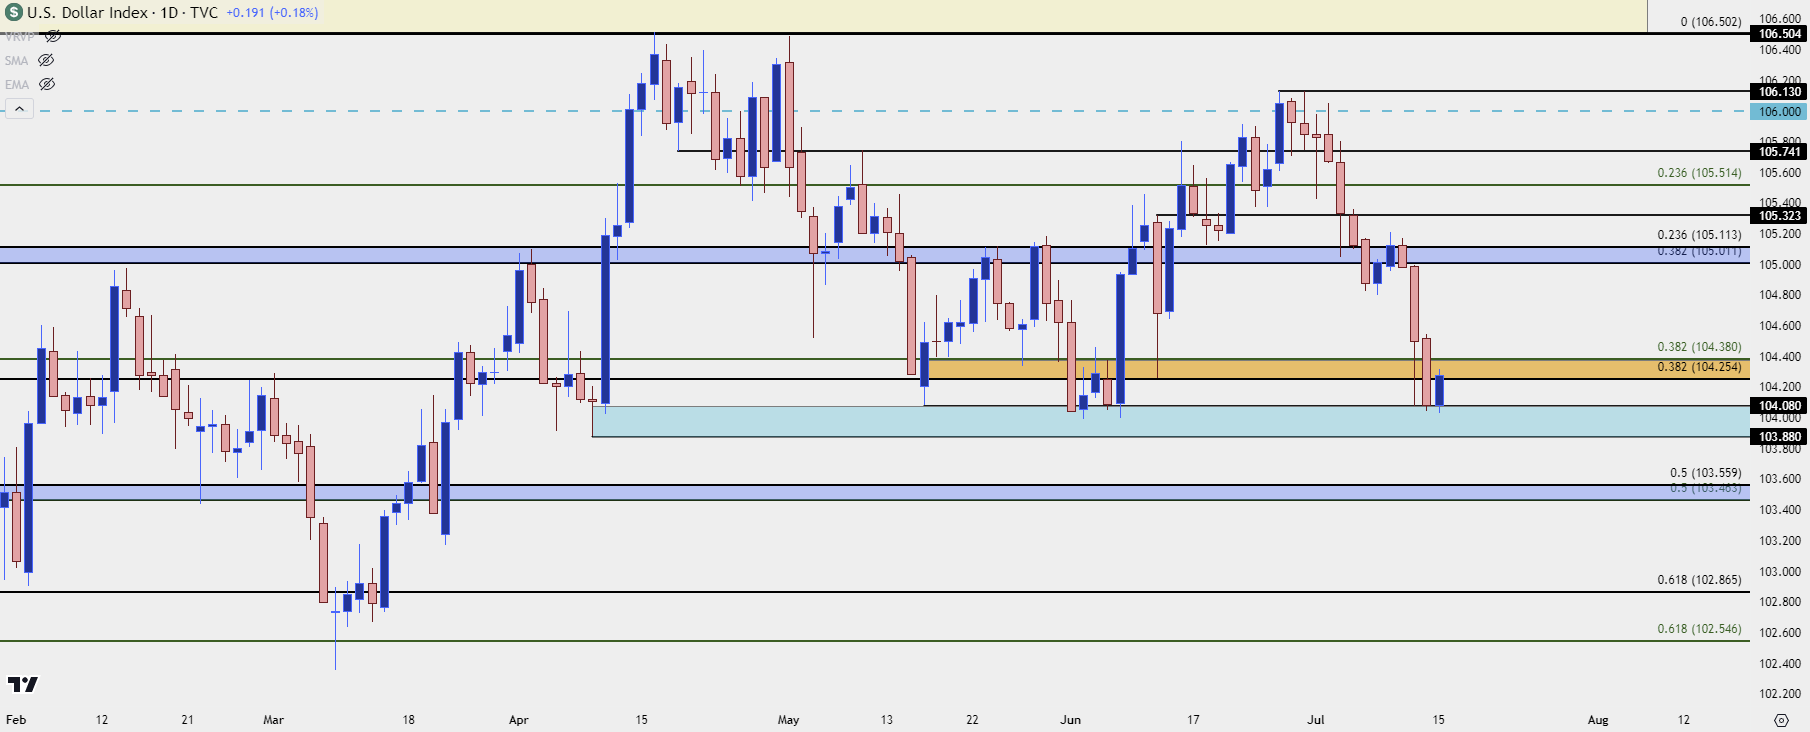
So far in Q3, the US Dollar has been in a hard bearish backdrop; and this comes after the USD had pushed up to range resistance in late-June trade. Since stalling at 106, the USD has been down for ten of the past 12 completed daily candles.
Support showed at a familiar spot on Thursday after the CPI release. The 104.08 level in DXY helped to hold the lows in late-May and early-June. It also held the low on Friday into the end of last week and so far to start this week, it’s still in-play.
US Dollar Daily Price Chart
 Chart prepared by James Stanley; data derived from Tradingview
EUR/USD
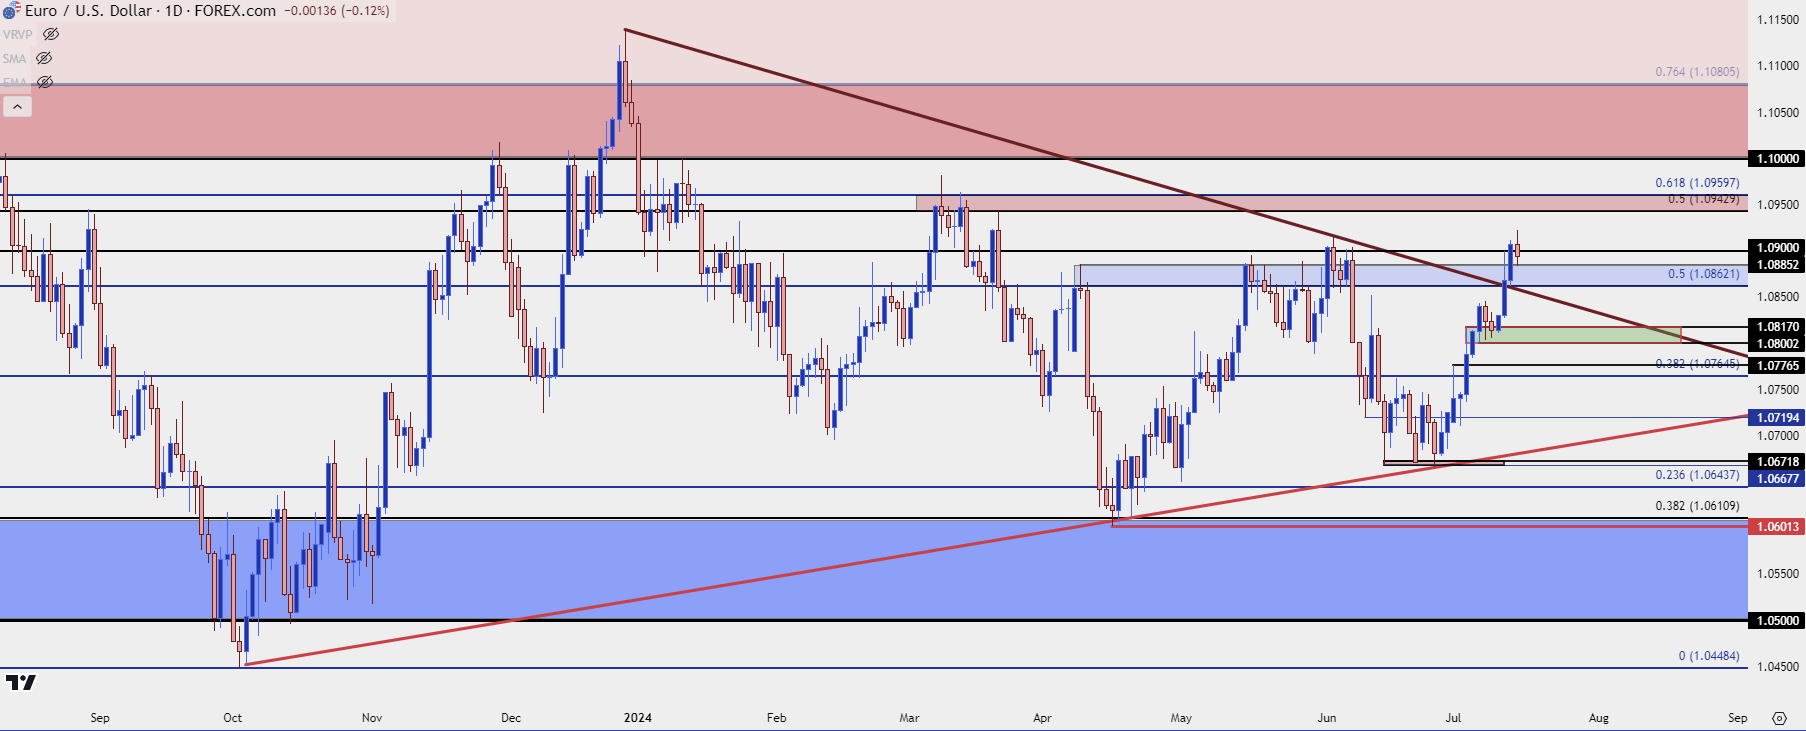
For USD counterparts, the Euro has continued to show strength. I had highlighted this one early last week as the pair was testing support at prior resistance. That led to a bounce on Wednesday that extended into a breakout on Thursday on the heels of the US CPI report. Friday saw continuation as bulls grinded through the 1.0900 handle that was a stall point last month, and there’s more resistance overhead at the 1.0943-1.0960 zone that was resistance back in March as the range in EUR/USD continued to compress.
This could be a difficult move to chase as the pair looks extended and overbought from shorter time frames but if it does pose continuation, particularly if that happens quickly, there’s reversal potential off of the deeper resistance zone.
EUR/USD Daily Price Chart
 Chart prepared by James Stanley, EUR/USD on Tradingview
GBP/USD
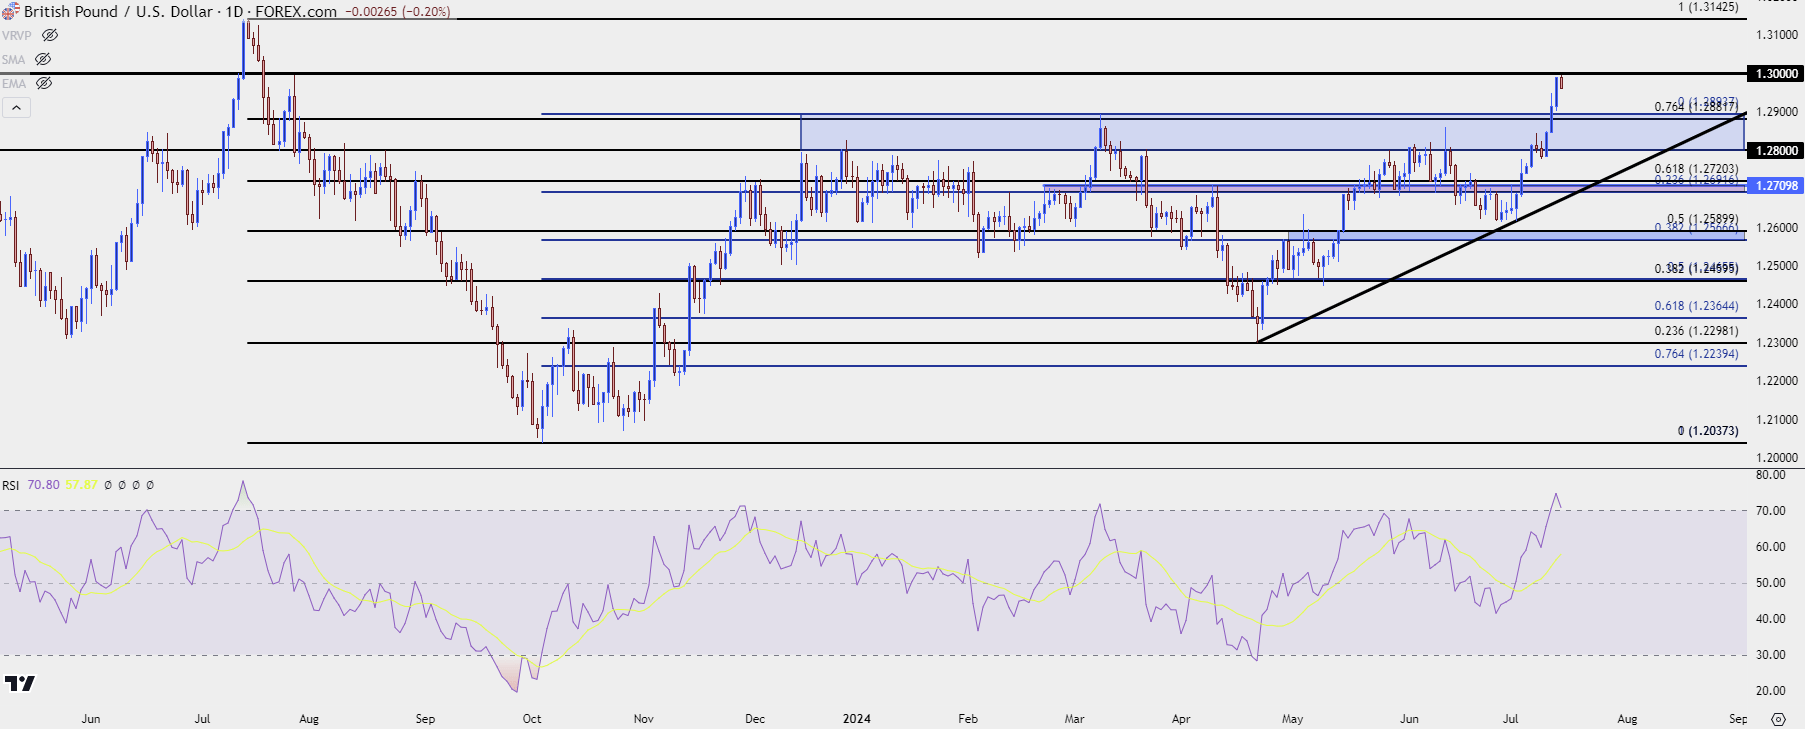
GBP/USD put in a strong breakout last week. I looked into this in the Tuesday webinar and at the time, a key zone of longer-term resistance was being tested. As the USD broke down later in the week, GBP/USD pushed through that resistance and made a fast run at the 1.3000 handle, which hasn’t been in-play since last July. And in that instance, it was a quick touch and go as the pair reversed off of the big figure.
Plotting a reversal of that nature can be a challenge, largely because we would be considering a complete 180 of the status quo; but there’s some context here as RSI on the daily chart has pushed into overbought territory, and the last time the indicator was this overbought was last July, just ahead of the bearish reversal.
GBP/USD Daily Price Chart
 Chart prepared by James Stanley, GBP/USD on Tradingview
USD/JPY
This is the contentious one after last week’s suspected intervention. USD/JPY was slammed after the CPI report last week and that wouldn’t be out of the norm as there were strong sell-offs in the pair after CPI reports released in November each of the past two years.
In those instances, USD-weakness reigned supreme and that brought with it the idea of carry unwind, and bulls that had been holding long in the move, clipping carry along the way, were suddenly incentivized to take profits before a larger reversal showed up.
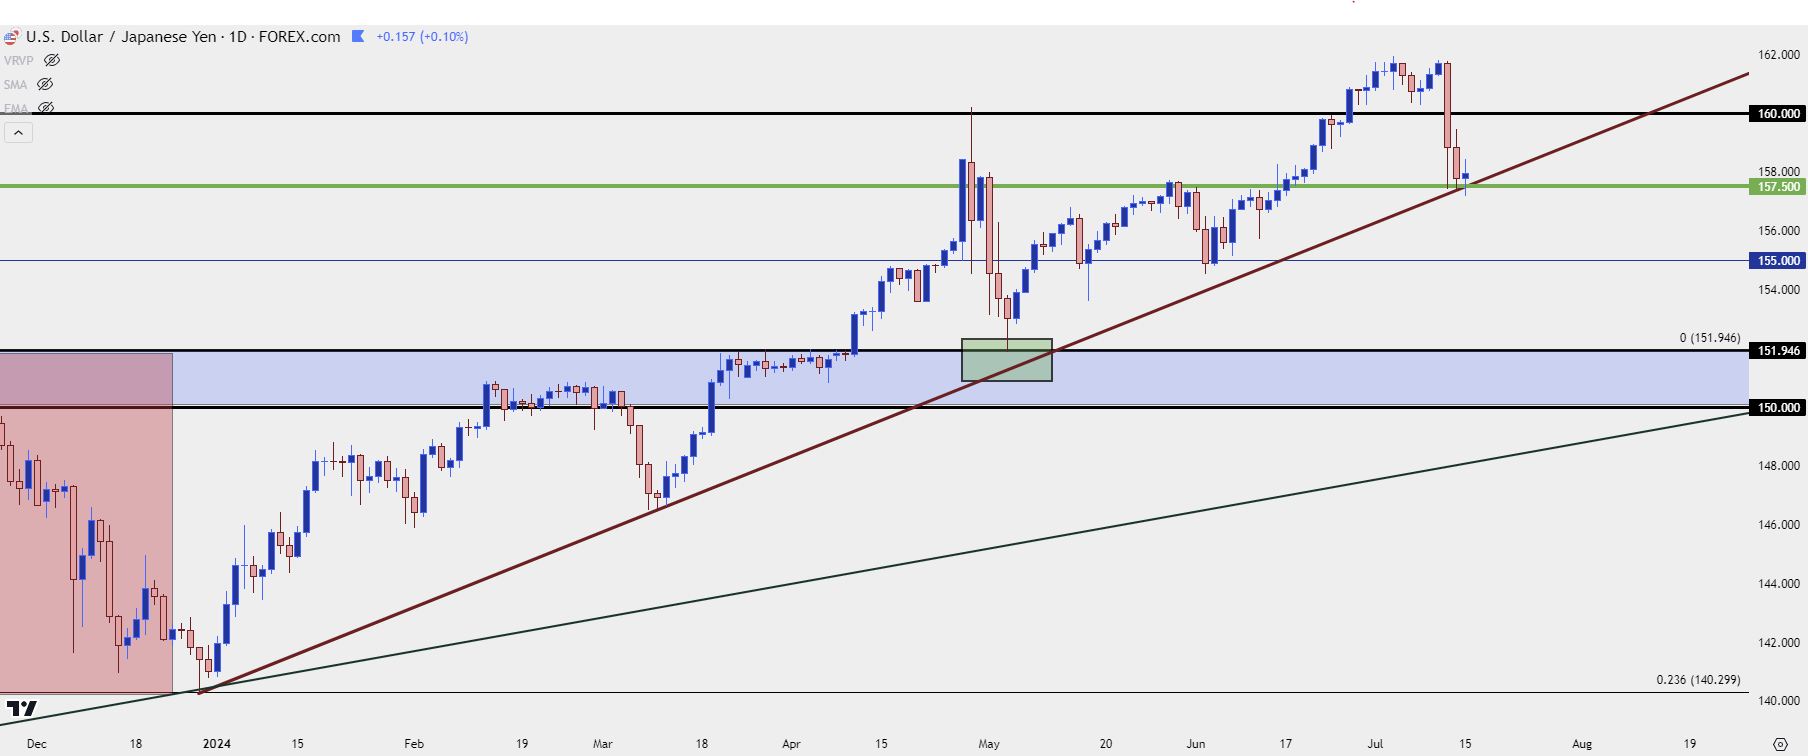
But, last week, there’s the suspected intervention from the Bank of Japan appeared to come in about ten minutes after the data was released, and this led to a strong sell-off in the pair. After a bounce developed from a trendline, there was another bearish push on Friday which also may have been intervention-driven.
To start this week, traders appear trepidatious on the matter as price remains at that confluent support, from around the 157.50 level and the bullish trendline drawn from last December and this March’s swing low.
In the past, those intervention pushes have set up pullbacks, with bulls coming back in and driving the pair back in the upward-sloping trend. The late-April/early-May instance is incredibly clear as the bank defended 160.00, with price in USD/JPY pulling back to test support at prior resistance of 152; and then bulls loading the boat over the next two months to go right back above 160.00.
Is this a surefire pullback into bullish continuation? No, it’s markets, and anything can happen. The bear scenario here would probably need an additional push of USD-weakness, giving longer-term longs in USD/JPY the fear that the carry trade may be unwinding. And if that scenario plays, the sell-off can be fast such as we saw in Q4 each of the past two years.
But for now, the focus is on support to watch if it holds, and if it does, given the continued carry setup where the long side can earn and the short side is forced to pay, there’s built-in incentive for the trend via the rollover relationship.
USD/JPY Daily Price Chart
 Chart prepared by James Stanley, USD/JPY on Tradingview
--- written by James Stanley, Senior Strategist


