Weekly Technical Trade Levels on USD Majors, Commodities & Stocks
- Technical setups we are tracking into the weekly open / April-open
- Next Weekly Strategy Webinar: Monday, April 22 at 8:30am EST
- Review the latest Weekly Strategy Webinars on my YouTube playlist.
In this webinar we take an in-depth look at the technical trade levels for the US Dollar (DXY), Euro (EUR/USD), British Pound (GBP/USD), Australian Dollar (AUD/USD), Canadian Dollar (USD/CAD), US Treasury Yields, Japanese Yen (USD/JPY), Swiss Franc (USD/CHF), New Zealand Dollar (NZD/USD), Gold (XAU/USD), Silver (XAG/USD), Crude Oil (WTI), S&P 500 (SPX500), Nasdaq (NDX), and Dow Jones (DJI). These are the levels that matter on the technical charts heading into the weekly open.
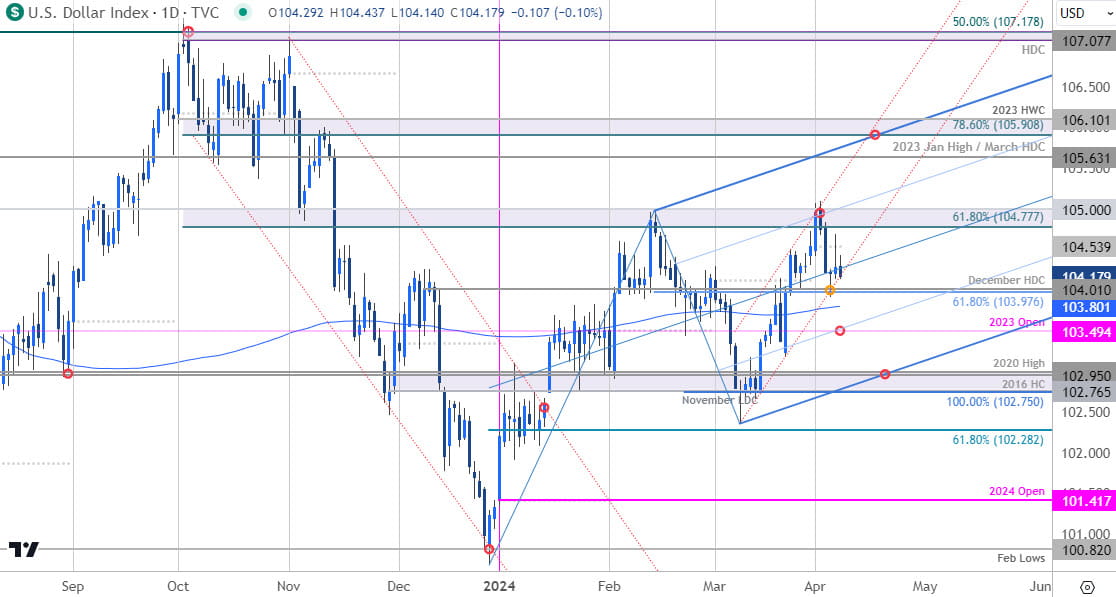
US Dollar Price Chart – USD Daily (DXY)

Chart Prepared by Michael Boutros, Sr. Technical Strategist; DXY on TradingView
We highlighted this key resistance zone in last week’s webinar at “104.77-105 – a region defined by the 61.8% retracement of the October decline, the psychological 105 barrier and a pair of upslopes we’ve been tracking for weeks now. Looking for a reaction into this threshold early in the week.”
The Dollar registered a close-high at 104.96 before reversing sharply lower with the index exhausting into confluent support last week at 103.97-104.01. The focus is on this test of support early in the week – a break / close below would threaten a larger correction within the uptrend towards subsequent support objectives at the 200DMA (currently ~103.80) and the 2023 yearly open at 103.49. Broader bullish invalidation steady at 102.75/95.
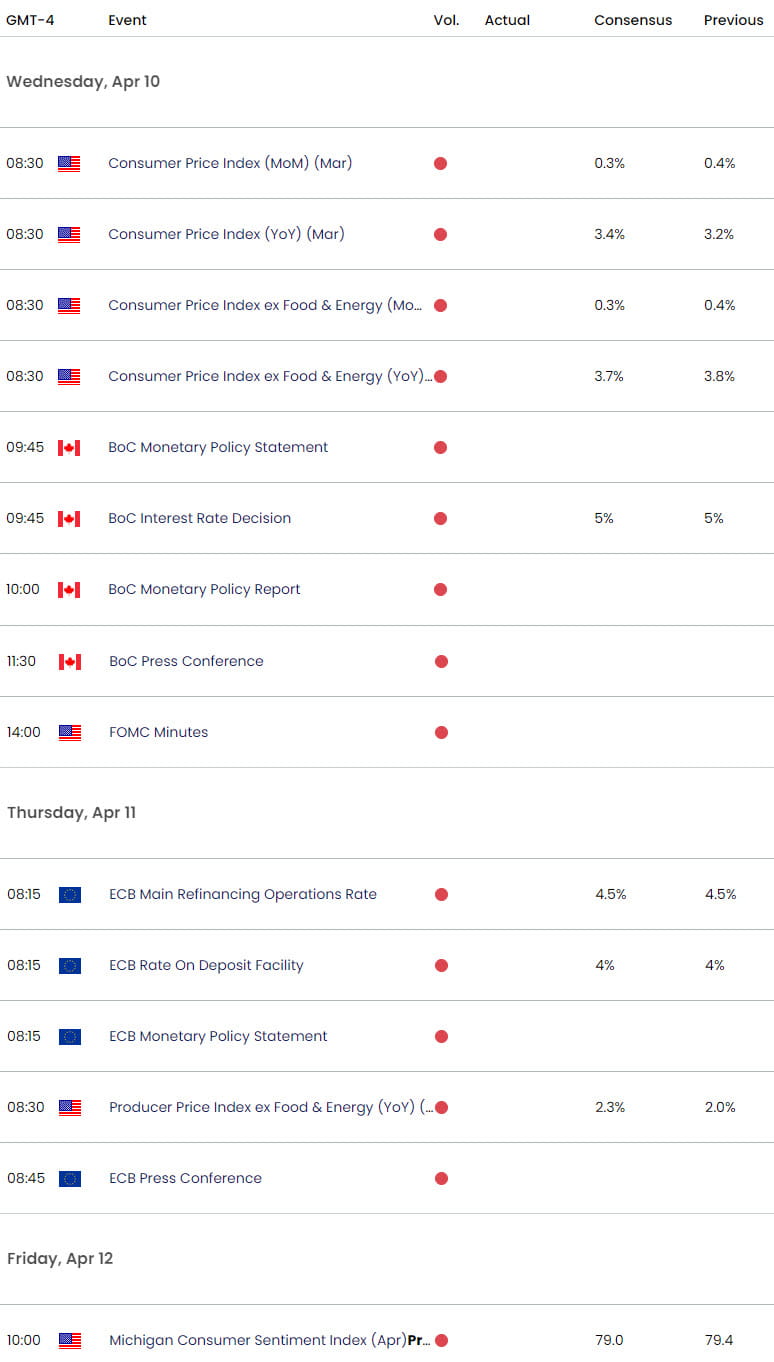
Monthly-open resistance eyed at 104.53 with a breach / close above 105 needed to mark uptrend resumption towards the 2023 January high / March high-day close (HDC) at 105.63 and key resistance 105.90-106.10. Keep in mind that we get the release of key US inflation data on Wednesday with the BOC and ECB on tap- watch the weekly close here.
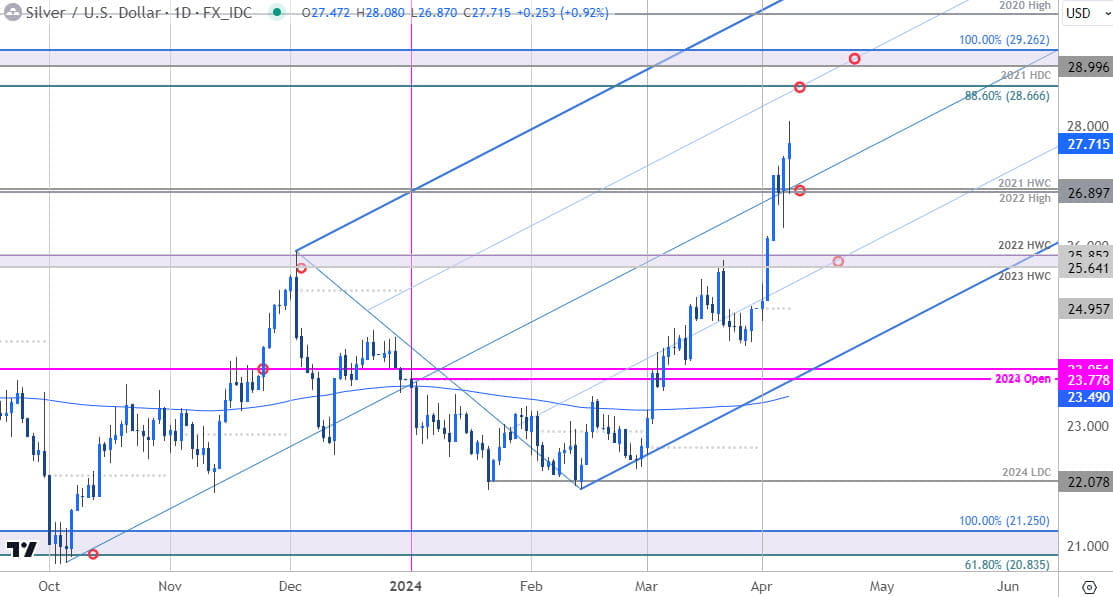
Silver Price Chart – XAG/USD Daily

Chart Prepared by Michael Boutros, Sr. Technical Strategist; Silver on TradingView
Silver broke a major resistance zone last week at 25.64/85- a region defined by the 2023 & 2022 high-week closes (HWC). XAG/USD has now rallied more than 18% year-to-date with this most recent advance extending more than 28% off the yearly lows. Initial resistance is eyed at the 88.6% retracement at 28.66 with a more significant confluence zone just higher at the 2021 high-day close (HDC) / 100% extension of the 2022 advance 28.99-29.26- look for a larger reaction there IF reached. Initial weekly support now back at the 2021 HWC / 2022 high (26.90/94) with medium-term bullish invalidation now raise to 25.64.
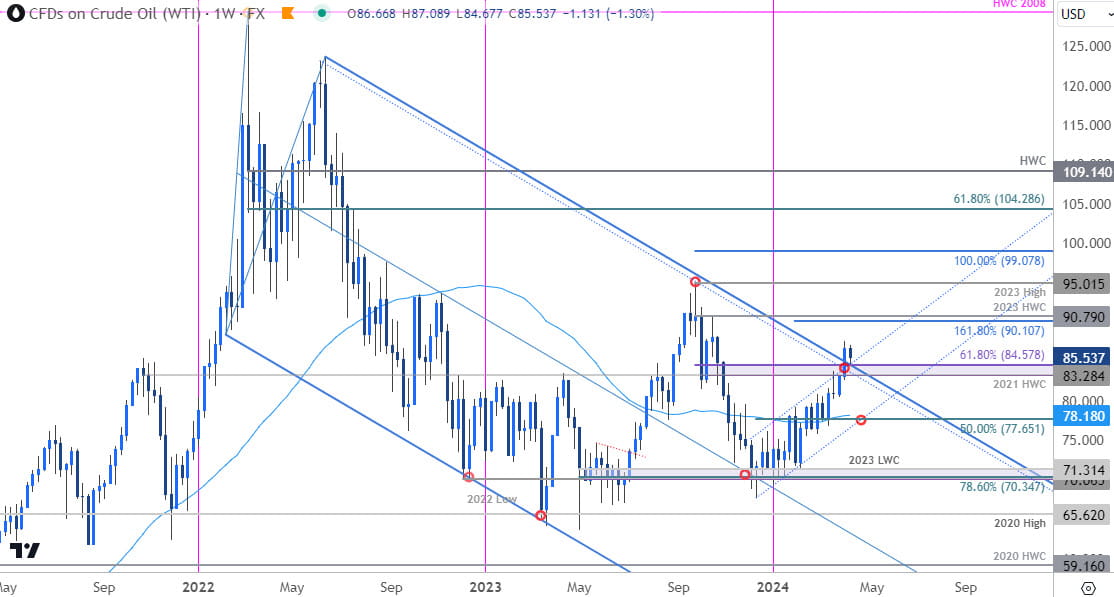
Oil Price Chart – WTI Weekly

Chart Prepared by Michael Boutros, Technical Strategist; WTI on TradingView
Crude oil has broken (and closed) above a critical resistance confluence we’ve been tracking since the start of the year at 83.28-84.57- a region defined by the 2021 high-week close (HWC) and the 61.8% Fibonacci retracement of the September decline. If this breakout is legit, losses should be limited to this threshold. Broader bullish invalidation now raised to the 50% retracement / 52-week moving average at 77.65-78.18.
The next major resistance hurdle is eyed at the 1.618% Fibonacci extension of the December advance / 2023 HWC at 90.10/79- look for a larger reaction there IF reached with a close above needed to keep the focus on the highs at 95-handle.
Economic Calendar – Key USD Data Releases

Economic Calendar - latest economic developments and upcoming event risk.
--- Written by Michael Boutros, Sr Technical Strategist with FOREX.com
Follow Michael on X @MBForex


