Weekly Technical Trade Levels on USD Majors, Commodities & Stocks
- Technical setups we are tracking into the weekly open – US CPI on tap
- Next Weekly Strategy Webinar: Monday, May 20 at 8:30am EST
- Review the latest Weekly Strategy Webinars or Stream Live on my YouTube playlist.
In this webinar we take an in-depth look at the technical trade levels for the US Dollar (DXY), Euro (EUR/USD), British Pound (GBP/USD), Australian Dollar (AUD/USD), Canadian Dollar (USD/CAD), Japanese Yen (USD/JPY), Swiss Franc (USD/CHF), Gold (XAU/USD), Silver (XAG/USD), S&P 500 (SPX500), Nasdaq (NDX), and Dow Jones (DJI). These are the levels that matter on the technical charts heading into the weekly open.
Gold Price Chart – XAU/USD 240min

Chart Prepared by Michael Boutros, Sr. Technical Strategist; XAU/USD on TradingView
Gold prices are responding to confluent resistance early in the week at 2372/83- a region defined by the record high-close (daily) and the 61.8% Fibonacci retracement of the April decline. Near-term support rests at 2309/16- a break / close below this threshold would suggest a larger correction is underway towards 2283 and key support at 2224/28. Remember, our focus has been on identifying a more significant exhaustion low in the weeks ahead with a topside breach / daily close above 2383 needed to mark uptrend resumption towards the record highs at 2431 and beyond. Stay nimble into this week’s US inflation report and watch the weekly close here.
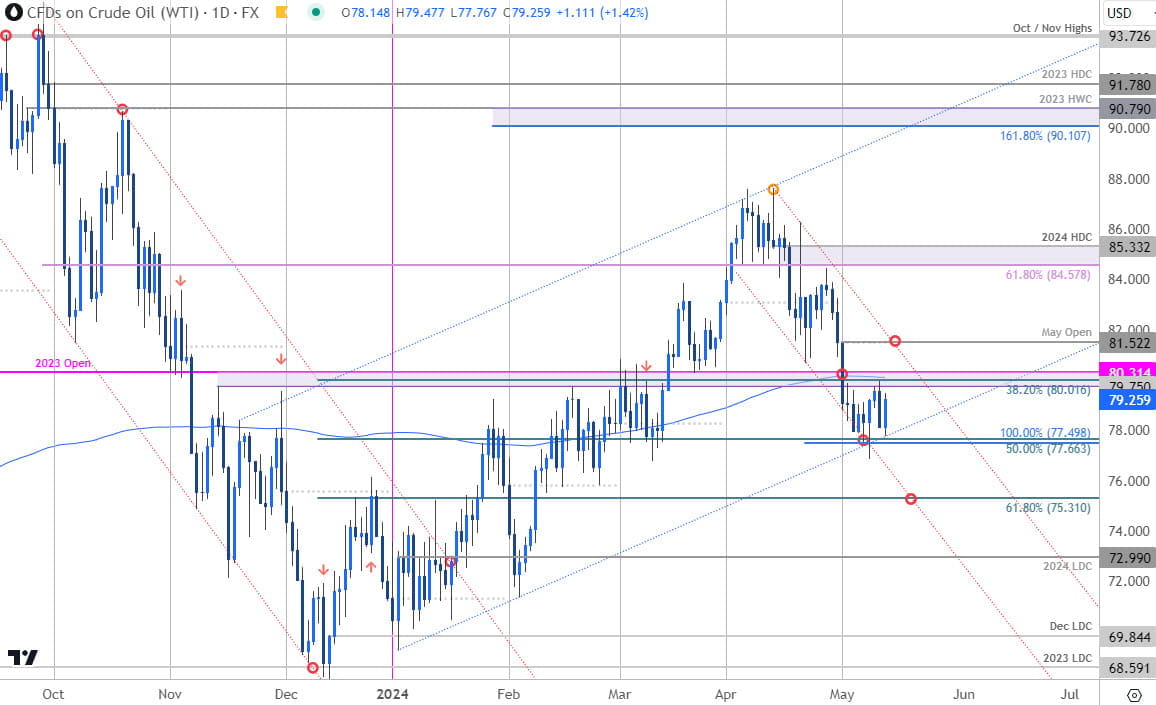
Oil Price Chart – WTI Daily (USOil)

Chart Prepared by Michael Boutros, Technical Strategist; WTI on TradingView
I didn’t get a chance to cover Oil prices today but wanted to highlight that WTI has held this critical support-zone we’ve been tracking for months now at the confluence of the 100% extension of the April decline and the 50% retracement around 77.49/66- note basic trendline support off the yearly low in blue. An outside-day reversal off this threshold on Wednesday keeps the focus on possible inflection / downside exhaustion here.
Key near-term resistance remains unchanged at 79.75-80.31- a region defined by the late-November / February highs, the 38.2% retracement of the December rally, the 200-day moving average, and the 2023 yearly open. Look for a reaction there IF reached with a topside breach / close above the objective monthly open at 81.52 needed to suggest a more significant low was registered last week.
A break below this key pivot zone would threaten a plunge towards the 61.8% retracement at 75.31 and the yearly low-day close (LDC) at 72.99. Bottom line: immediate focus is on a breakout of the 77.66-80.31 zone for guidance with the bears vulnerable while above yearly slope support- watch the weekly closes here.
S&P 500 Price Chart – SPX500 Daily

Chart Prepared by Michael Boutros, Sr. Technical Strategist; S&P 500 on TradingView
Cleaned up this SPX500 chart a bit after the webinar- the focus into the start of the week is on confluent technical resistance at the 100% extension of the October rally / record high-day close (HDC) at 5223/47- a topside breach / weekly close above this threshold is needed to keep the immediate advance viable / fuel the next leg higher towards the 1.618% extension at 5330 and the highlighted slope confluence near ~5420s.
Look for initial support around 5123 with medium-term bullish invalidation now raised to the monthly open / 61.8% retracement at 5028/49. Bottom line- technical risk for a setback here, but ultimately looking for support within the multi-week advance before breaking higher.
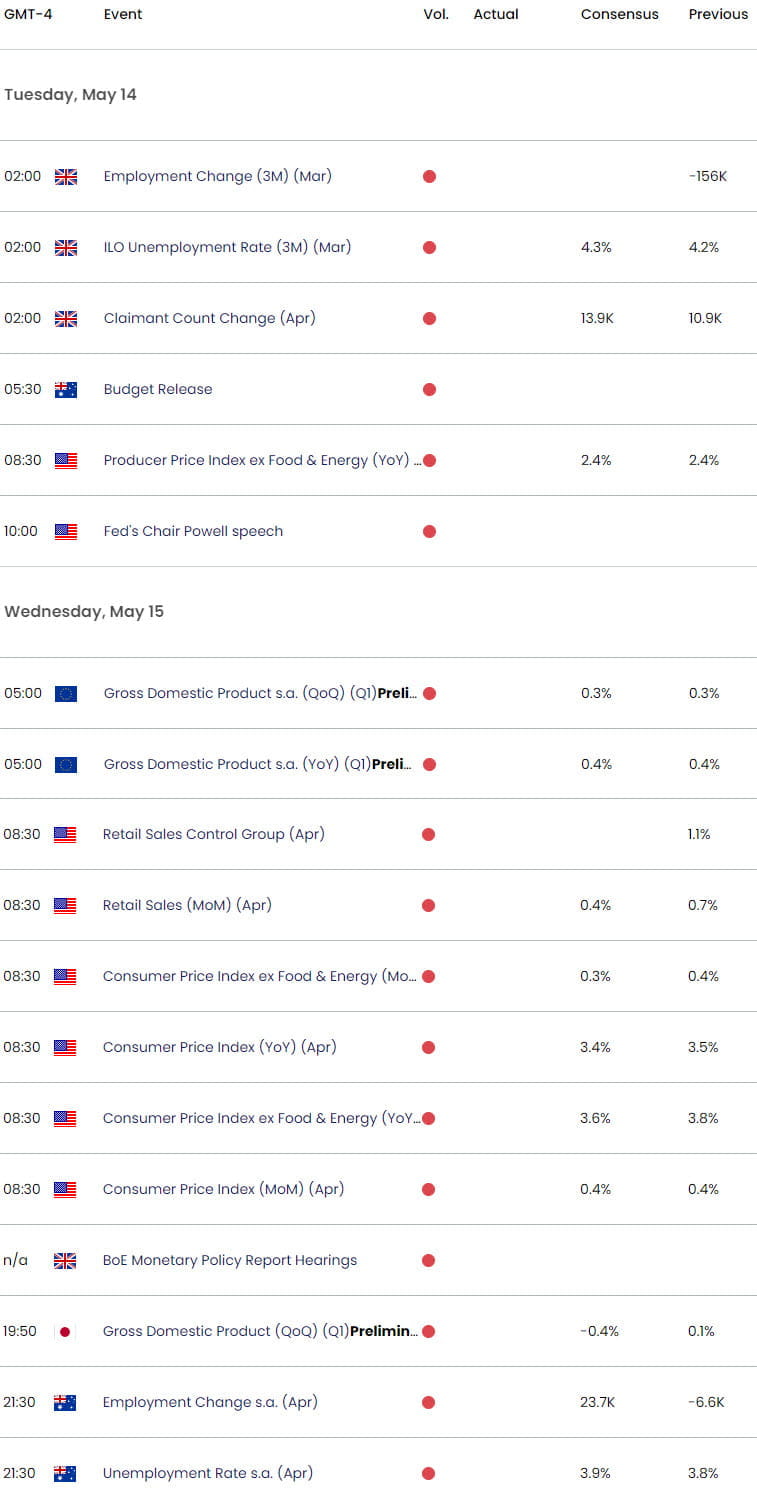
Economic Calendar – Key USD Data Releases

Economic Calendar - latest economic developments and upcoming event risk.
--- Written by Michael Boutros, Sr Technical Strategist with FOREX.com
Follow Michael on X @MBForex


