Weekly Technical Trade Levels on USD Majors, Commodities & Stocks
- Technical setups we’re tracking into the weekly open
- Next Weekly Strategy Webinar: Monday, October 16 at 8:30am EST
- Review the latest Weekly Strategy Webinars on my YouTube playlist.
In this webinar we take an in-depth look at the technical trade levels for the US Dollar (DXY), Japanese Yen (USD/JPY), Euro (EUR/USD), British Pound (GBP/USD), Canadian Dollar (USD/CAD), Swiss Franc (USD/CHF), Crude Oil (WTI), Gold (XAU/USD), Silver (XAG/USD), S&P 500 (SPX500), Nasdaq (NDX) and Dow Jones (DJI). These are the levels that matter on the technical charts heading into weekly open.
US Dollar Price Chart – USD Weekly

Chart Prepared by Michael Boutros, Sr. Technical Strategist; DXY on TradingView
The US Dollar exhausted into confluent resistance last week around the 50% retracement of the 2022 decline at 107.18. While the broader outlook remains constructive, the immediate advance may be vulnerable while below this threshold. Initial weekly support rests at 105.39/67- look for a reaction there IF reached with a break / close below needed to suggest a larger correction is underway towards the 52-week moving average / median-line at ~104.03.
A topside breach / weekly close above this resistance zone would likely fuel another accelerated rally towards subsequent objectives at the 20001 low at 108.09 and the 61.8 Fibonacci retracement at 108.97.
Gold Price Chart – XAU/USD Daily

Chart Prepared by Michael Boutros, Sr. Technical Strategist; XAU/USD on TradingView
In last week’s webinar, we noted that gold was testing the objective yearly-open with, “support objectives eyed at the August 2022 pivot zone at 1807 and 1793/99- a region defined by the 61.8% retracement of the 2022 advance and the 100% extension of the yearly decline. Looking for possible downside exhaustion into this key zone IF reached.” Gold registered an intraday low at 1810 before mounding an outside-day reversal with price now rallying more than 2.4% off the lows. Is a near-term low in place? Pullbacks would need to be limited to the yearly open at 1823 IF price is heading higher here.
Look for initial resistance along the median-line (currently ~1867) with a breach / close above 1874/77 ultimately needed to suggest a large recovery is underway. Key resistance / broader bearish invalidation eyed at 1903/14. From a technical standpoint, a break below confluent support into 1793 would be extremely damaging with such a scenario threatening a plunge towards the August 2021 low-day close at 1729.
Crude Oil Price Chart – WTI 240min

Chart Prepared by Michael Boutros, Technical Strategist; WTI on TradingView
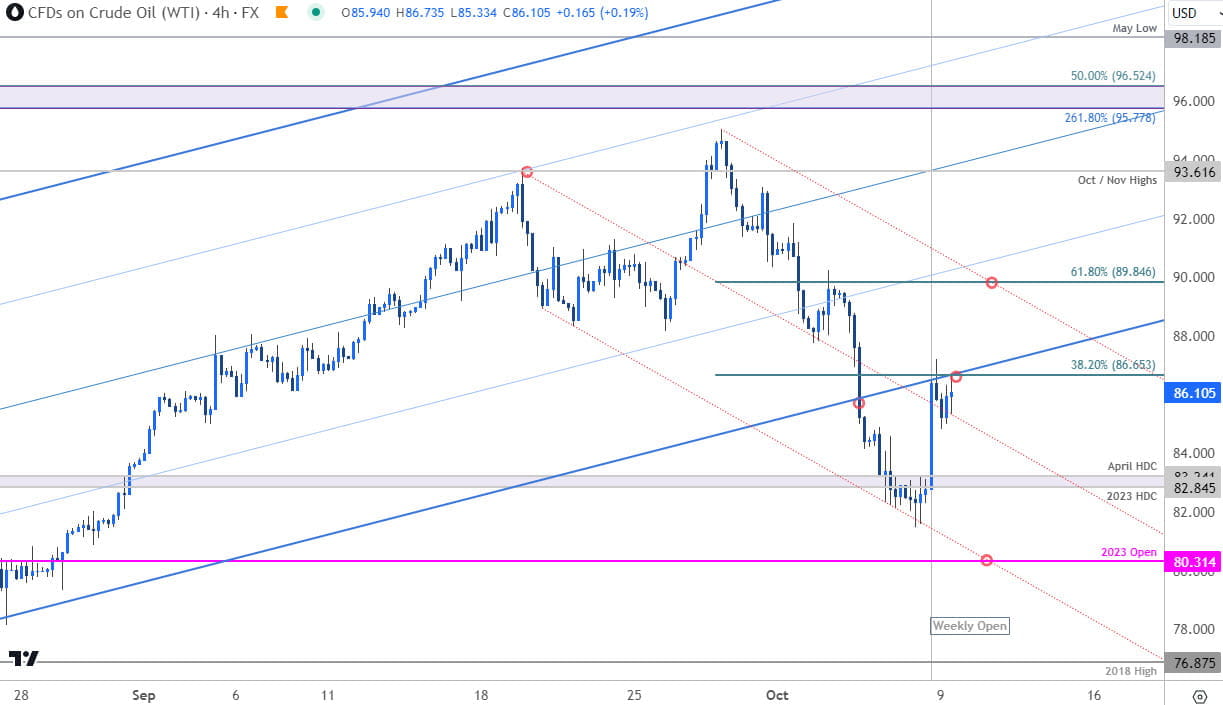
Crude oil prices pivoted back above a key inflection zone we’ve been tracking at 82.84-83.27 on the heels of this weekends attack on Israel. The rally takes price into confluent resistance here at former support – 86.65. A breach / close above the 61.8% retracement at 89.84 (bearish invalidation) would be needed to mark resumption of the broader uptrend.
Key near-term support unchanged at the objective yearly open at 80.31- a close below this threshold would threaten another accelerated decline towards the 2018 high at 76.87.
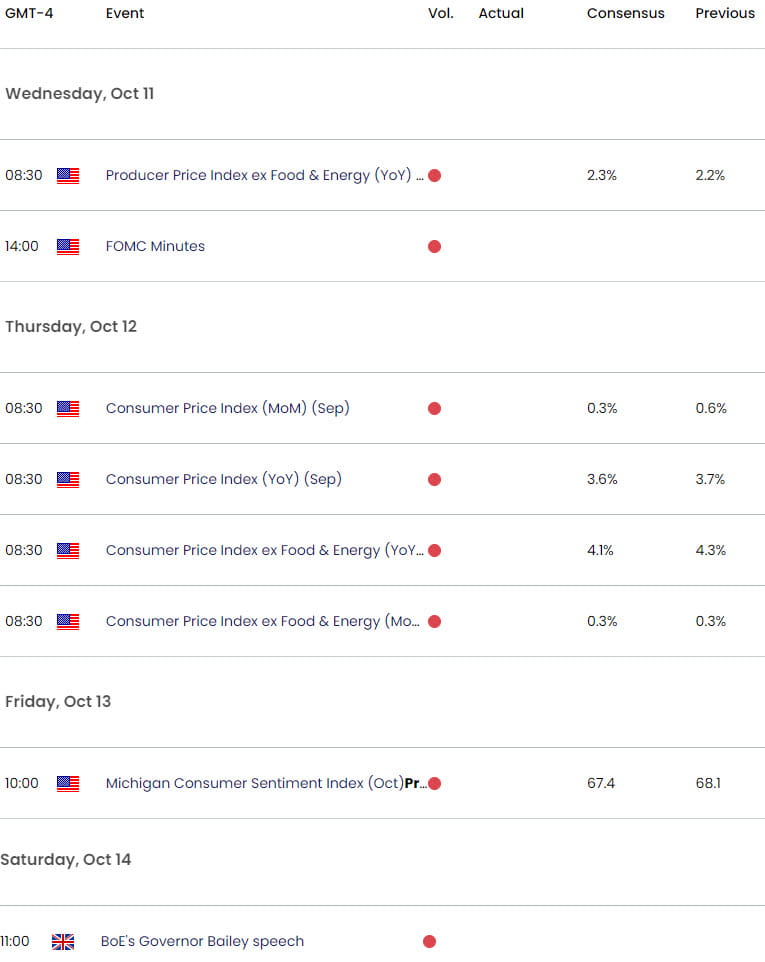
Economic Calendar – Key USD Data Releases

Economic Calendar - latest economic developments and upcoming event risk.
--- Written by Michael Boutros, Sr Technical Strategist with FOREX.com
Follow Michael on Twitter @MBForex


