Weekly Technical Trade Levels on USD Majors, Commodities & Stocks
- Technical setups we’re tracking into the weekly open / November close
- Next Weekly Strategy Webinar: Monday, December 11 at 8:30am EST
- Review the latest Weekly Strategy Webinars on my YouTube playlist.
In this webinar we take an in-depth look at the technical trade levels for the US Dollar (DXY), Euro (EUR/USD), Bitcoin, British Pound (GBP/USD), Canadian Dollar (USD/CAD), Japanese Yen (USD/JPY), Australian Dollar (AUD/USD), Swiss Franc (USD/CHF), Gold (XAU/USD), Crude Oil (WTI), S&P 500 (SPX500), Nasdaq (NDX), and the Dow Jones (DJI). These are the levels that matter on the technical charts heading into the weekly open.
Gold Price Chart – XAU/USD Daily

Chart Prepared by Michael Boutros, Sr. Technical Strategist; XAU/USD on TradingView
An explosive gold breakout into the weekly open reversed sharply just ahead of confluent resistance at 2151 with XAU/USD plunging more than 5.8% off the highs. An outside-day reversal today marks the largest single-day range in gold since August 2020- three-days after the record high was registered. In that instance, gold went sideways into a consolidation pattern for more than month before breaking lower. Bottom line, this immediate decline might not have much more on this immediate stretch.
Initial support rests at the May high-week close / 38.2% retracement of the October rally at 2016/18 with near-term bullish invalidation raised to the April 14th reversal close at 2004 (note that this level converges on basic slope support). Losses should be limited to this threshold IF price is heading higher on this stretch. Resistance at 2050 backed by 2066/75- a breach / close above is needed to fuel another run at the highs again.
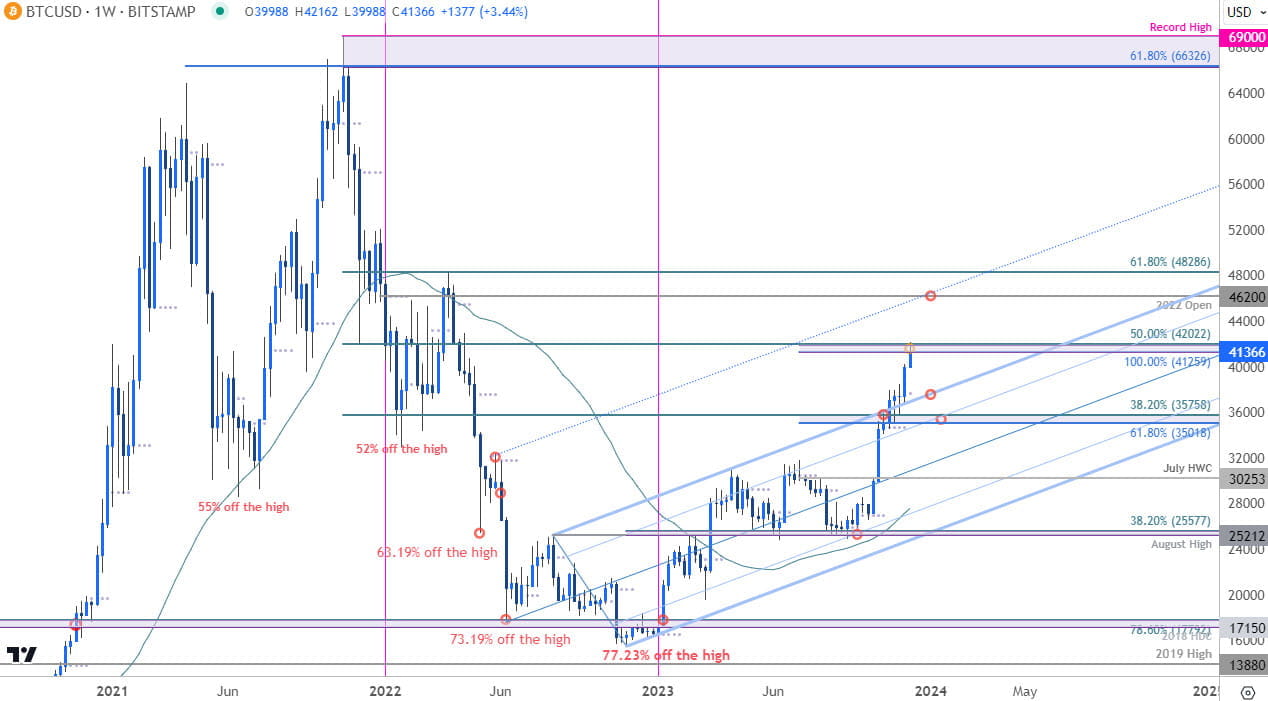
Bitcoin Price Chart – BTC/USD Weekly

Chart Prepared by Michael Boutros, Sr. Technical Strategist; Bitcoin on TradingView
The Bitcoin breakout we highlighted a few weeks ago is now testing confluent resistance here into the 100% extension / 50% retracement at 41256-42022- risk for possible exhaustion / price inflection here. Monthly-open support rests at 37731 and is backed by medium-term bullish invalidation at the highlighted Fibonacci confluence near 35018/758- losses should be limited to this threshold IF price is heading higher on this stretch. A topside breach / close higher keeps the focus on the 2022 objective yearly-open at 46200.
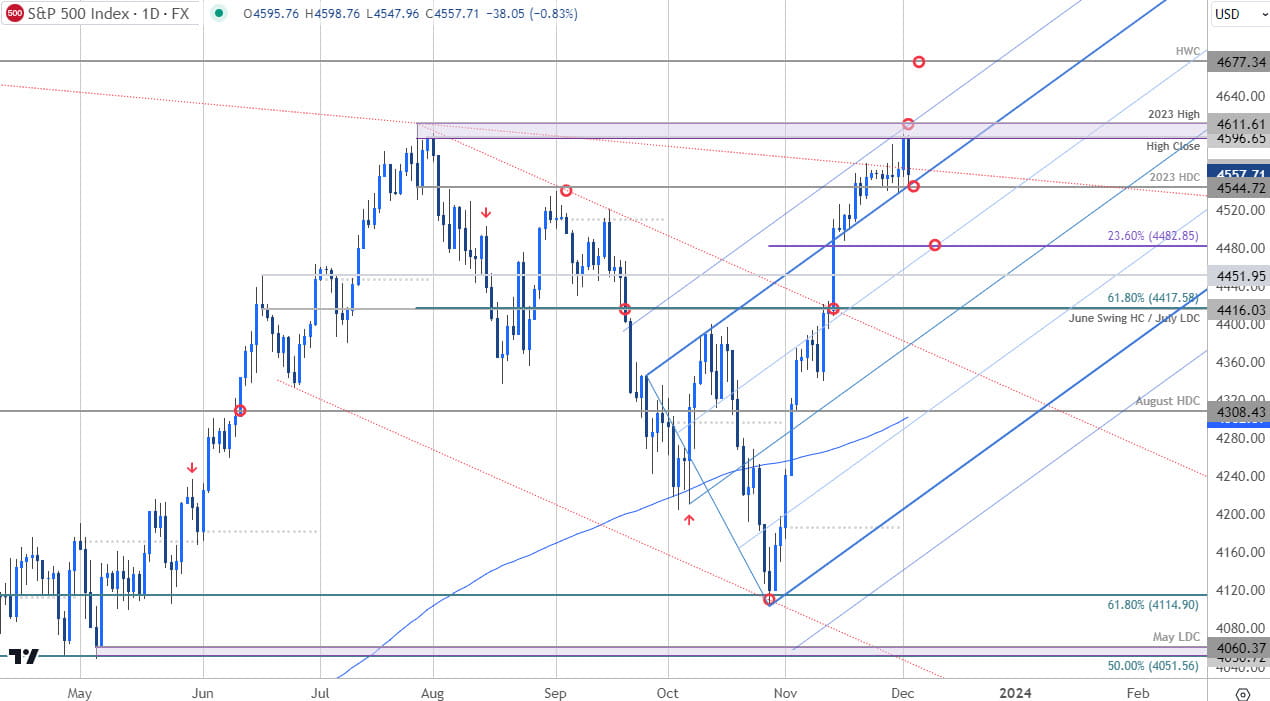
S&P 500 Price Chart – SPX500 Daily

Chart Prepared by Michael Boutros, Sr. Technical Strategist; SPX500 on TradingView
The S&P 500 failed at confluent uptrend resistance today at the yearly high-close / swing high at 4596-4611. The index is now testing initial support near the high-day close at 4544- looking for a reaction here. A break / close lower threatens a deeper setback towards the 23.6% retracement at 4482. Ultimately, a topside breach / close above this key hurdle is needed to mark uptrend resumption towards the record high-week close at 4677.
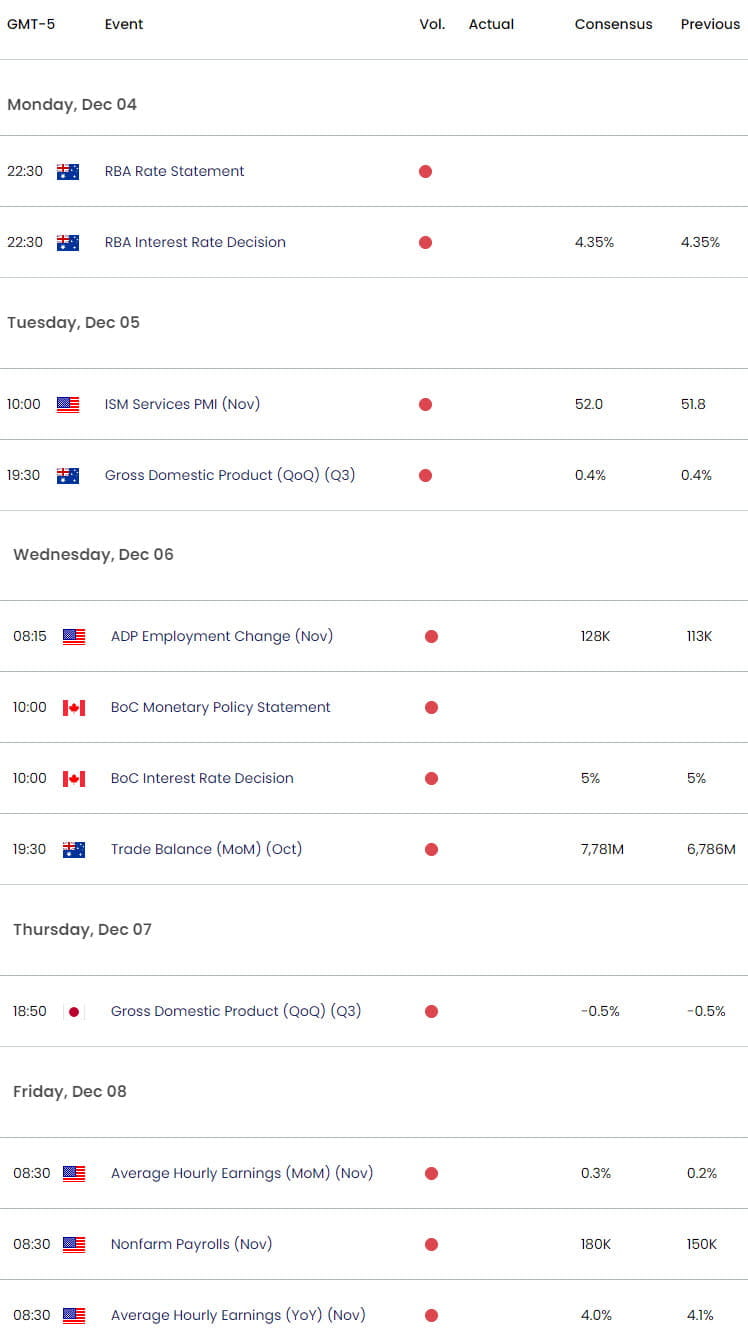
Economic Calendar – Key USD Data Releases

Economic Calendar - latest economic developments and upcoming event risk.
Written by Michael Boutros, Sr Technical Strategist with FOREX.com
Follow Michael on X @MBForex


