Weekly Technical Trade Levels on USD Majors, Commodities & Stocks
- Technical setups we are tracking into the weekly open
- Next Weekly Strategy Webinar: Monday, March 11 at 8:30am EST
- Review the latest Weekly Strategy Webinars on my YouTube playlist.
In this webinar we take an in-depth look at the technical trade levels for the US Dollar (DXY), Euro (EUR/USD), British Pound (GBP/USD), Australian Dollar (AUD/USD), Canadian Dollar (USD/CAD), Japanese Yen (USD/JPY), GBP/JPY, Swiss Franc (USD/CHF), Bitcoin (BTC/USD), Gold (XAU/USD), Crude Oil (WTI), S&P 500 (SPX500), Nasdaq (NDX), and the Dow Jones (DJI). These are the levels that matter on the technical charts heading into the March open.
Bitcoin Price Chart – BTC/USD Weekly

Chart Prepared by Michael Boutros, Sr. Technical Strategist; BTC/USD on TradingView
The Bitcoin breakout has now extended a staggering 73.4% off the January lows with BTC/USD now up six of the past seven-weeks. The advance takes price into a critical resistance zone this week at 65510-6900 – a region defined by the record high-week close (HWC), the 2.618% extension of the late-2022 advance and the record swing high. Looking for a reaction into this threshold this week with a breach / close above needed to keep the bulls in control towards the 100% extension of the broader 2019 advance at 81310.
Monthly open support now 65510 and is backed by the 1.618% extension oat 51109. Broader bullish invalidation now raised to the 61.8% Fibonacci retracement of the 2019 decline at 48286. Bottom line, the advance may be vulnerable here near-term – watch the March opening-range break for guidance here with a close above 6900 needed to fuel the next leg higher in piece.
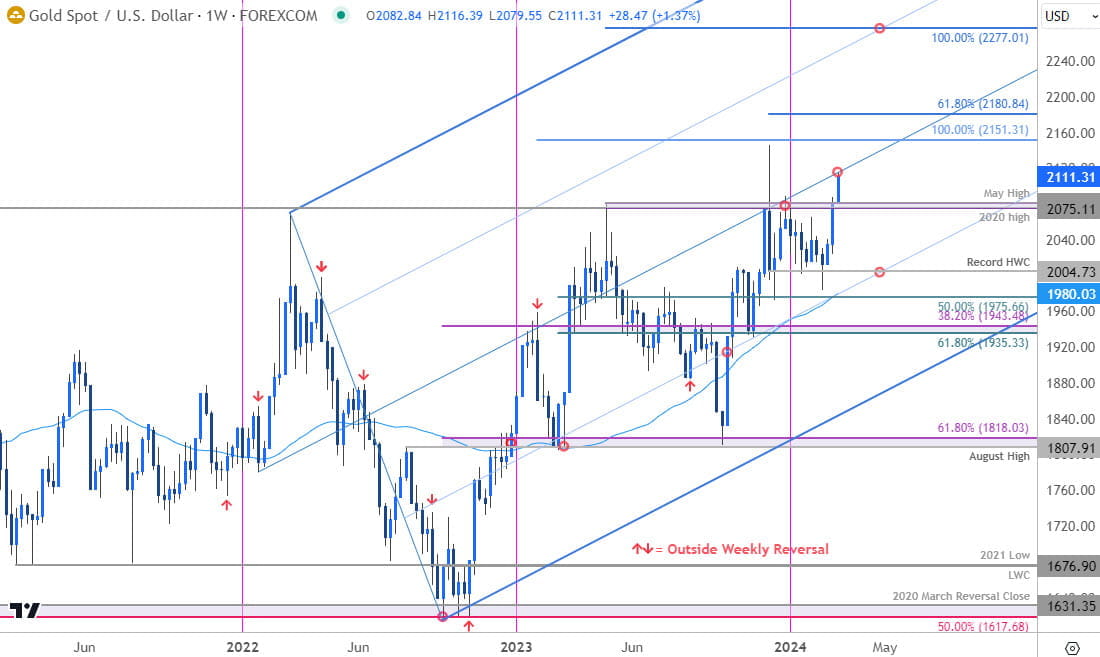
Gold Price Chart – XAU/USD Weekly

Chart Prepared by Michael Boutros, Sr. Technical Strategist; XAU/USD on TradingView
Gold has broken above a key resistance zone we’ve been tracking for months now at 2075/81 – a region defined by the 2020 swing high, the May swing high, the 2023 close high, and the 2024 yearly opening-range high. The breakout is now testing uptrend resistance at the median-line of the ascending pitchfork we’ve been tracking since 2022- looking for possible inflection here.
A topside breach keeps the focus on 2151 and the 61.8% extension of the September advance at 2180- look for a larger reaction there If reached. Initial weekly support now back at 2075 with broader bullish invalidation raised to the record high-week close at 2004.
Economic Calendar – Key USD Data Releases

Economic Calendar - latest economic developments and upcoming event risk.
--- Written by Michael Boutros, Sr Technical Strategist with FOREX.com
Follow Michael on X @MBForex


