
Japanese Yen Talking Points:
- USD/JPY touched the 145 level last week which is currently helping to mark resistance. When this price came into play during the bullish trend in 2022, it held the highs for about a month before bulls were able to evoke a breakout up to 150, after which the Ministry of Finance ordered and intervention in the currency.
- EUR/JPY and GBP/JPY are both showing overbought RSI readings on the daily, weekly and monthly charts, while USD/JPY is currently showing overbought on the daily. The bigger question is whether this will matter in Q3, as bullish trends remain in all three markets.
- I’ll be discussing these themes in-depth in the weekly webinar on Tuesday at 1PM ET. It’s free for all to register: Click here to register.
As the door opens to Q3 and the second half of 2023, the trend in the Japanese Yen remains extreme from several vantage points. The big question, of course, is whether any change might be on the horizon for the Bank of Japan but, to date, there’s been no indication of such. As many other developed Central Banks have already lifted rates multiple times, the BoJ remains as loose and passive as they were in the depths of the Covid pandemic.
Last year, when the Fed was hiking aggressively, this led to a strong bullish run in USD/JPY as the carry trade was pricing-in along with what was already a aggressive topside trend, allowing USD/JPY to jump up to 30-year highs. But it was around the 145 level when that move began to stall, as that price helped to hold the bullish breakout at bay for a month before buyers were ultimately able to push up to the 150 level.
That price is back in the equation as of last Friday, and the question now is whether we’ll hear more grumblings of intervention or see fears of such taking a toll on price, similar to what appeared last year around the same price level.
USD/JPY Daily Price Chart
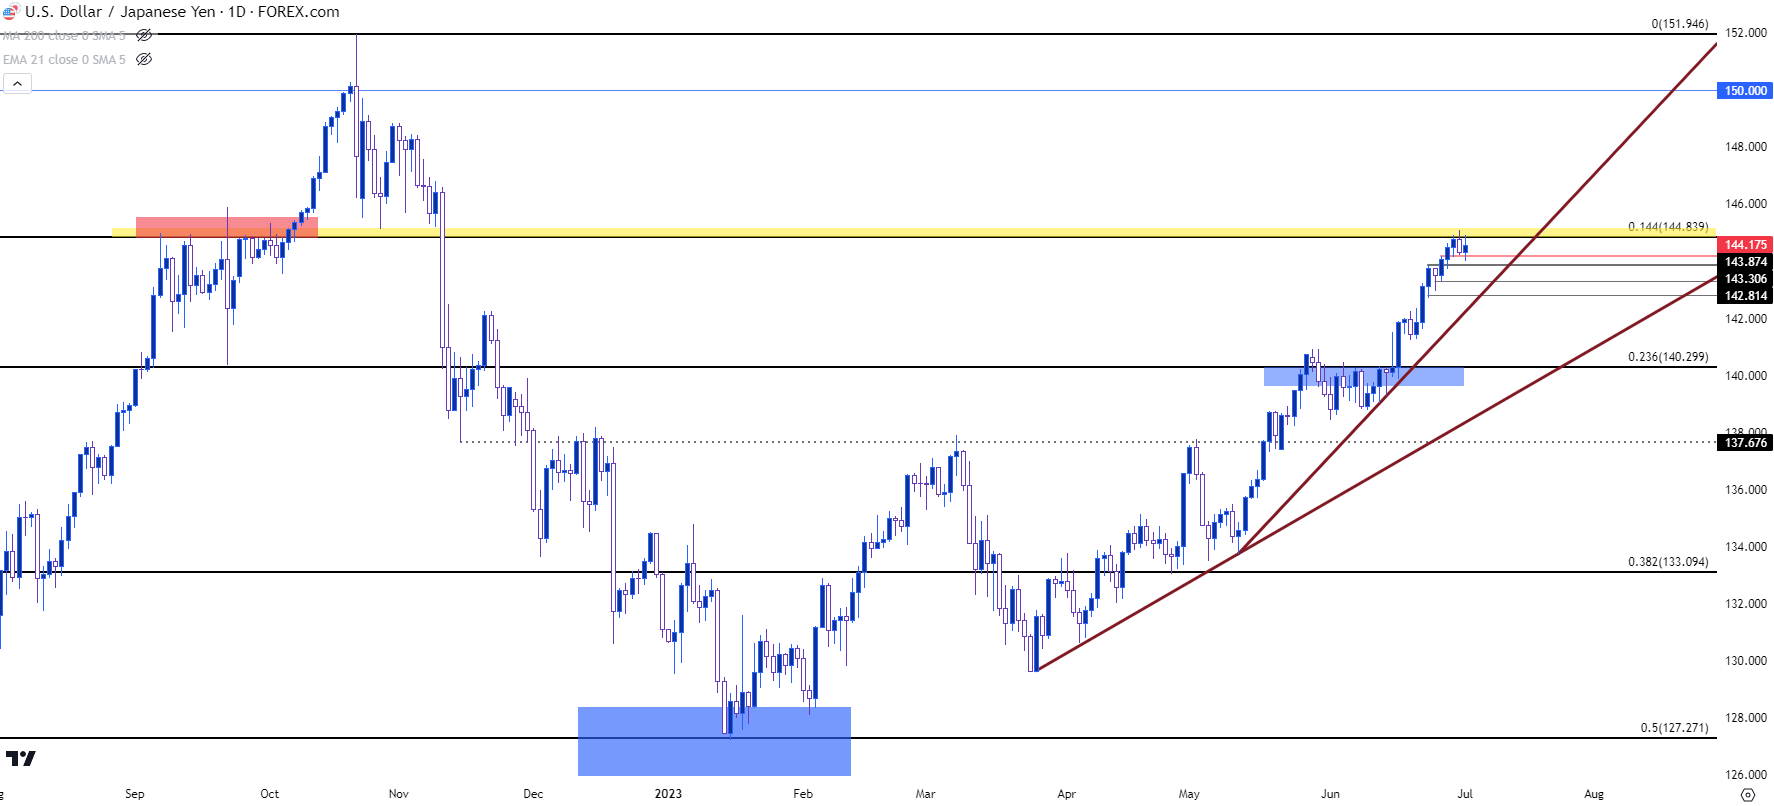 Chart prepared by James Stanley, USD/JPY on Tradingview
USD/JPY Shorter-Term
At this point the 145 level has come into help hold the highs, but sellers haven’t exactly had much run yet, either. The Friday inflection at 145 allowed for prices to pullback to a higher-low at 144.20, and a lower-high this week led to a quick test of a lower low but that’s been bid so far, so there’s still lacking evidence of deeper pullback potential.
But there is some pre-existing support structure that can help with following pullback scenarios. There are possible supports at 143.87, 143.31 and 142.81 that all retain a bit of relevance, and where and how buyers react or incorporate those supports can give evidence to just how aggressive bulls remain to be.
And if 145 is traded through in short order, the next look for resistance moves to the 150 handle which helped to mark the top in the pair last year.
USD/JPY Four-Hour Chart
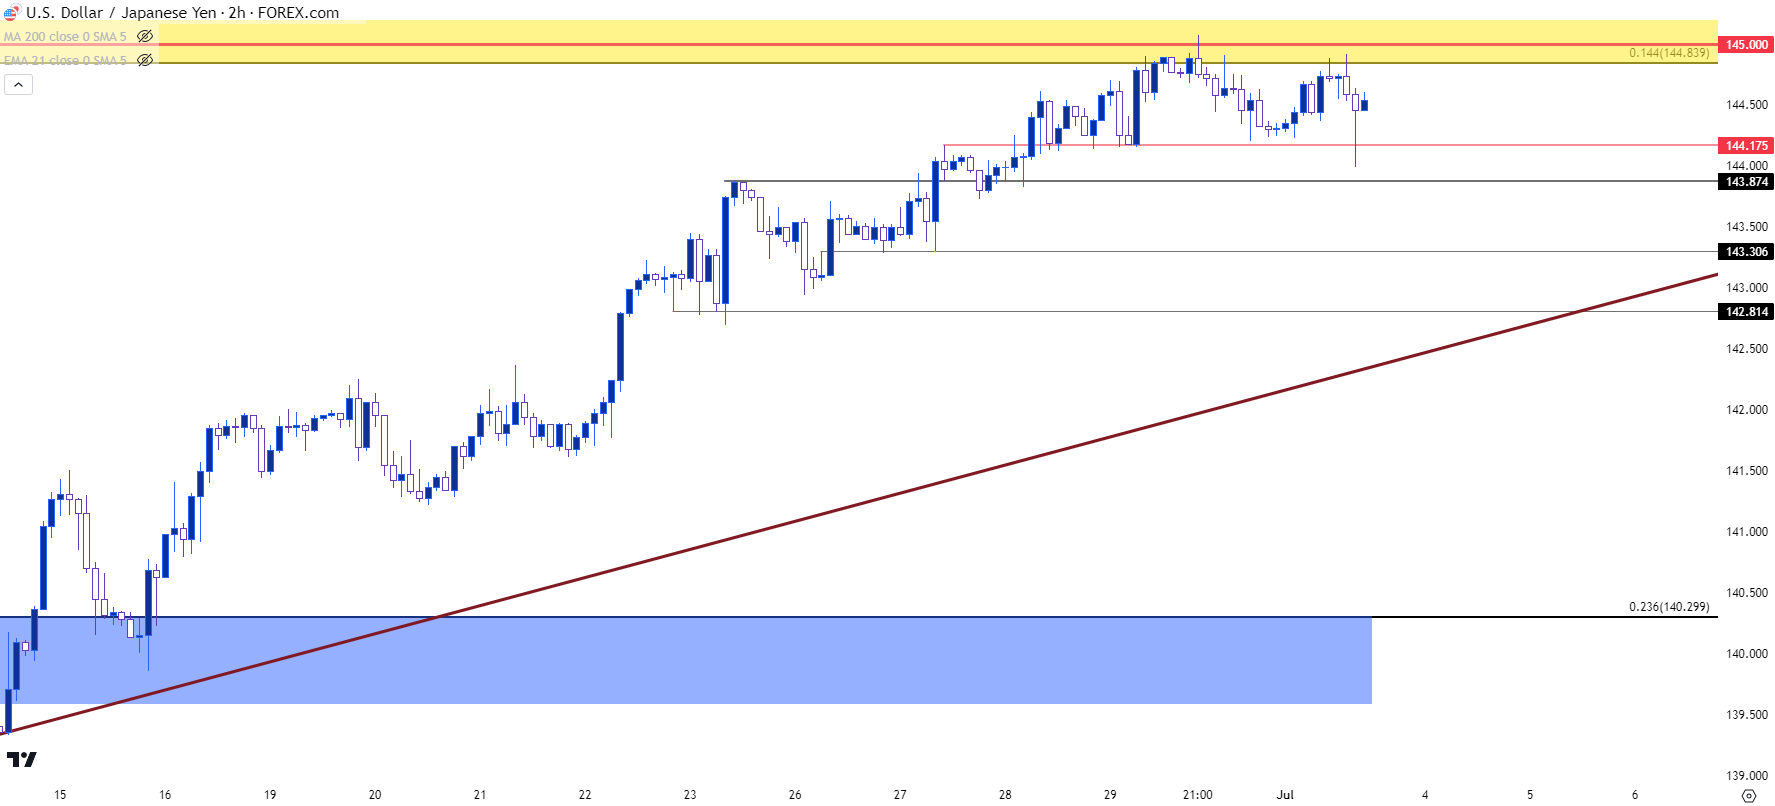 Chart prepared by James Stanley, USD/JPY on Tradingview
EUR/JPY
While USD/JPY remains well inside of last year’s high, EUR/JPY is trading near a 15-year high as Euro strength has come online since last year’s outlay. The Euro bottomed in September and that was around the time that USD/JPY topped at the 150 handle, so both JPY and Euro were strong against the USD through Q4 and into the New Year. But that theme has shifted aggressively to the upside as a persistently hawkish European Central Bank has helped to buoy the single currency against the US Dollar.
The big question for the second half of the year is whether the ECB can keep up that hawkish trajectory or whether data demands that the bank cool their rate hike plans. And much like we saw last year with USD/JPY, a hint of change can aggressively turn the trend in the other direction.
After all, the Fed still hiked after USD/JPY had topped, even with the BoJ indicating no change on the horizon. But it took about three months to erase 50% of a trend that took 21 months to build, highlighting the ‘up the stairs, down the elevator’ theme that can be commonplace with elongated trends.
There’s no clear evidence of EUR/JPY having topped at this point, but we’re nearing some psychological levels that haven’t been traded at in quite some time, and this does highlight vulnerability if we see European data continuing to disappoint, which could open the door to a similar scenario as what showed in Q4 of last year, when USD-weakness took over on the back of falling inflation data.
Last month was the strongest monthly performance in EUR/JPY since 2013, which was on the heels of Shinzo Abe’s announcement of ‘Abe-nomics.’ This further illustrates that we may not be at that point of topping just yet; but it also highlights a theme that could be prone to some fast reversal potential if we do see the underlying fundamentals shift.
EUR/JPY Monthly Price Chart
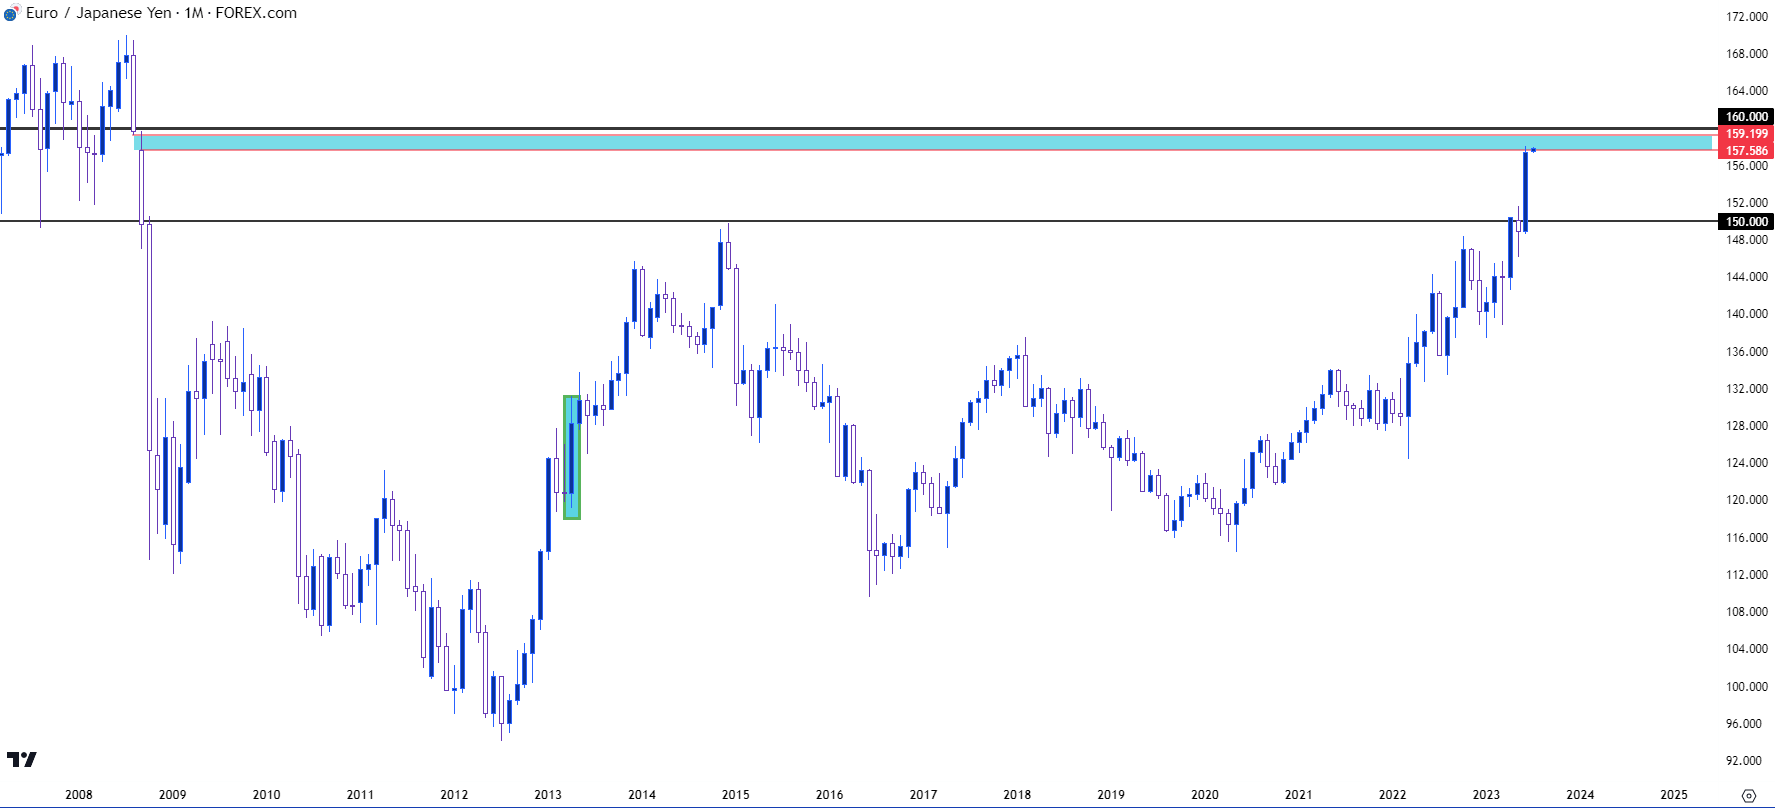 Chart prepared by James Stanley, EUR/JPY on Tradingview
EUR/JPY Shorter-Term
Going down to the daily chart highlights an extreme move with relative strength at its highest level on the daily chart since June of 2020. There’s short-term support potential at 154.04, 155.22, 155.92, and 156.79, each of which are prior swing lows. And with a strong bullish trend, each of those can be an excuse for buyers to plot re-entry.
The more entertaining scenario is if they don’t respond to those levels, which can start to highlight deeper pullback potential as price has made a fast approach at the 160 handle.
EUR/JPY Daily Chart
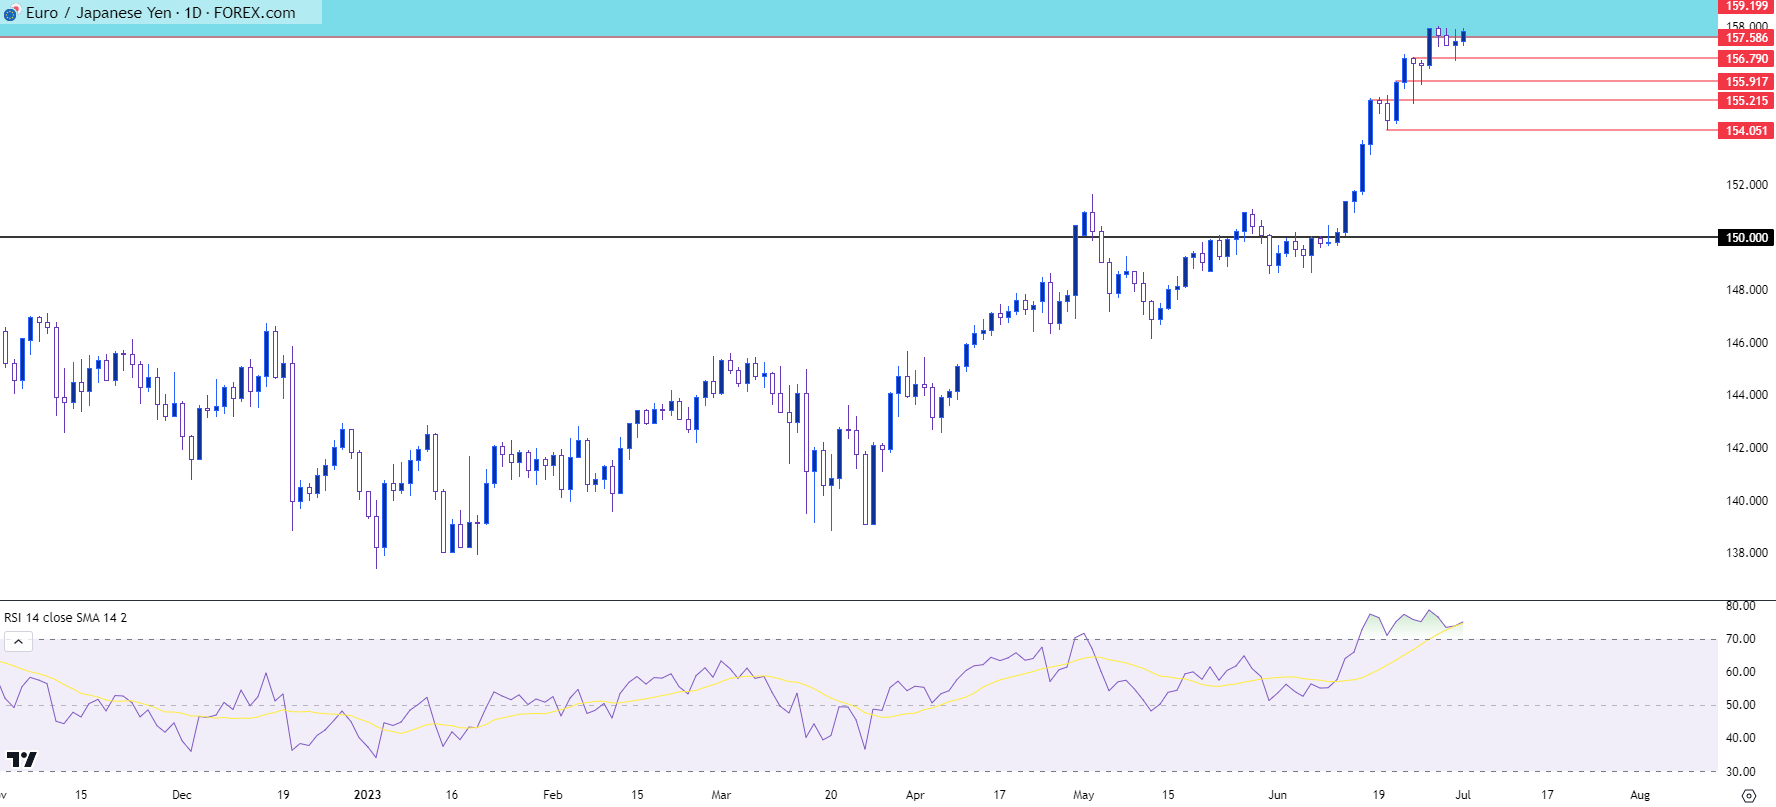 Chart prepared by James Stanley, EUR/JPY on Tradingview
GBP/JPY
GBP/JPY has been gripped by a similar flavor of euphoria of late, allowing the pair to breakout to some historically extreme levels as there hasn’t been a trade above 180 in the pair since before the Brexit referendum. This is a bit more tempered than above, however, as GBP/JPY is working on fresh seven-year highs while EUR/JPY is at 15 year highs.
There’s also some nearby resistance reference, as the 50% mark of the 2007-2011 move plots at 183.94.
GBP/JPY Monthly Chart
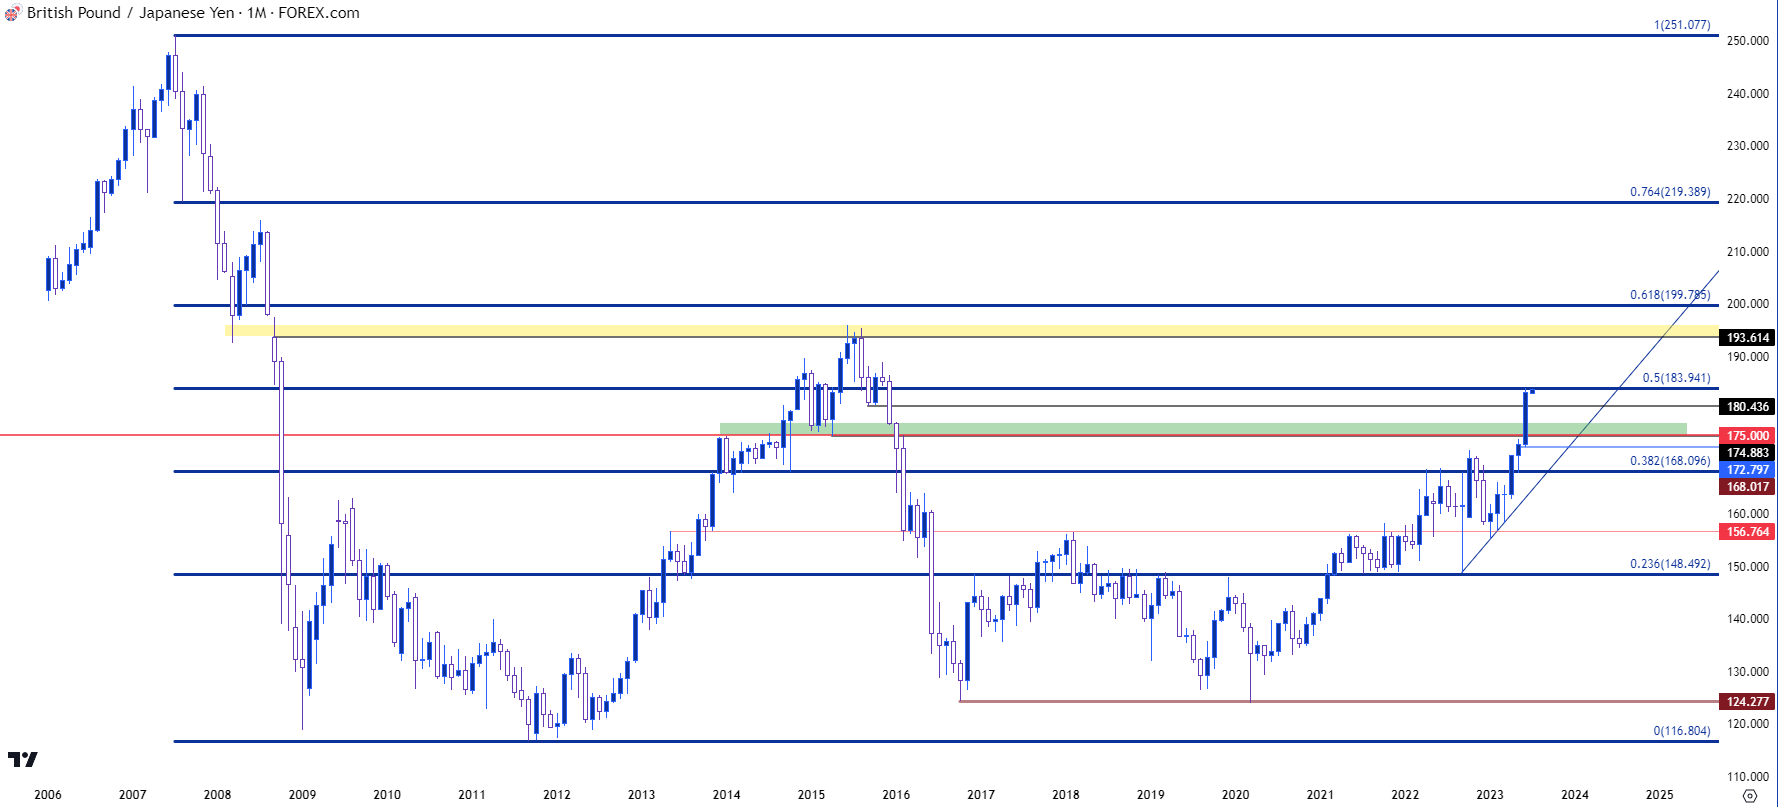 Chart prepared by James Stanley, GBP/JPY on Tradingview
GBP/JPY Shorter-Term
On a shorter-term basis there’s similarly no evidence of topping yet in GBP/JPY. There has been a slower response from bulls with price at or near highs, which can lead to the build of a rising wedge if that can continue. Last Friday saw the build of a morning star formation which is often approached with aim of bullish reversals. Ideally, such formations are in-play after a moderate pullback, which did not happen here as price remained very near the highs, but this could be lead-in to another breakout test, at which point we can get a read from bulls as to how aggressive they remain to be.
I’m tracking key support here around the 180 handle and if bears can elicit a push below that level at some point in the next couple of weeks, the door opens for a deeper push towards the 175 level. But, for now the trend remains bullish, even if overbought from a variety of timeframes (monthly, weekly and daily).
GBP/JPY Daily Price Chart
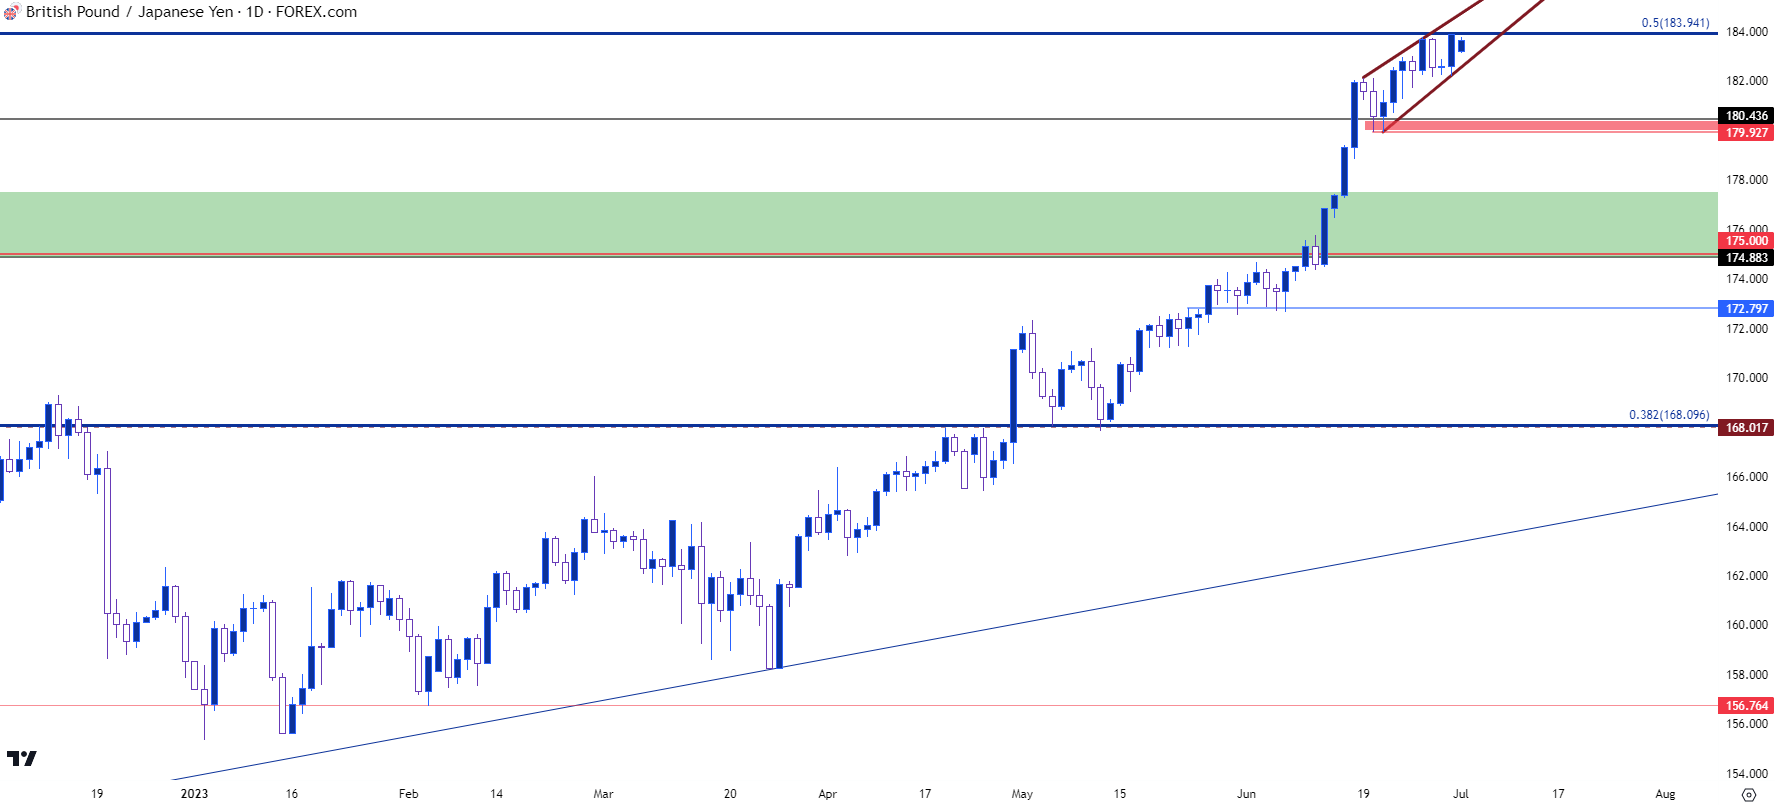 Chart prepared by James Stanley, GBP/JPY on Tradingview
--- written by James Stanley, Senior Strategist


