EUR/USD Talking Points:
- A critically important week is before us: The Bank of Japan hosts a rate decision later tonight and then we have the FOMC on Wednesday, Bank of England on Thursday and US Non-farm Payrolls on Friday. And then on the US equity front, we hear from four of the Mag 7 with earnings calls: MSFT reports tomorrow after the bell, Meta on Wednesday after the Fed and then Apple and Amazon on Thursday.
- EUR/USD has been relatively quiet amidst the volatility elsewhere which is why I wanted to focus on that this morning. The pullback from 1.0943 Fibonacci resistance has continued and this morning saw a support test at the 200-day moving average.
- If you’d like to learn more about trading, I created the Trader’s Course, with six sections and more than seven hours of content. The first three installments are completely open and available: To learn more, the following link will explain further - The Trader’s Course
It’s been a busy couple of weeks across markets, drawing back to the US CPI report on the 11th of July. And it may not be entirely driven by that CPI report as a Bank of Japan intervention in the minutes after the release has unsettled what was previously one of the world’s most consistent major market trends.
I’m talking about the USD/JPY carry trade that’s driven from a 2021 low of 102.59 up to a 2024 high of 161.95. That’s a whopping 57.86% move and this is in a non-levered currency pair: The ramifications of such a trend can have consequence on both sides of the trade, with a weak Yen leading to a boost to Japanese inflation while a strong USD acts as a drag on their own inflation, and possibly even growth.
But it’s not just the USD/JPY move that's garnered attention, as we’ve also seen an aggressive pullback in the Nikkei to go along with a fast sell-off in the Mag 7 group of stocks that was at the forefront of US equities’ bullish push for the past year-and-a-half.
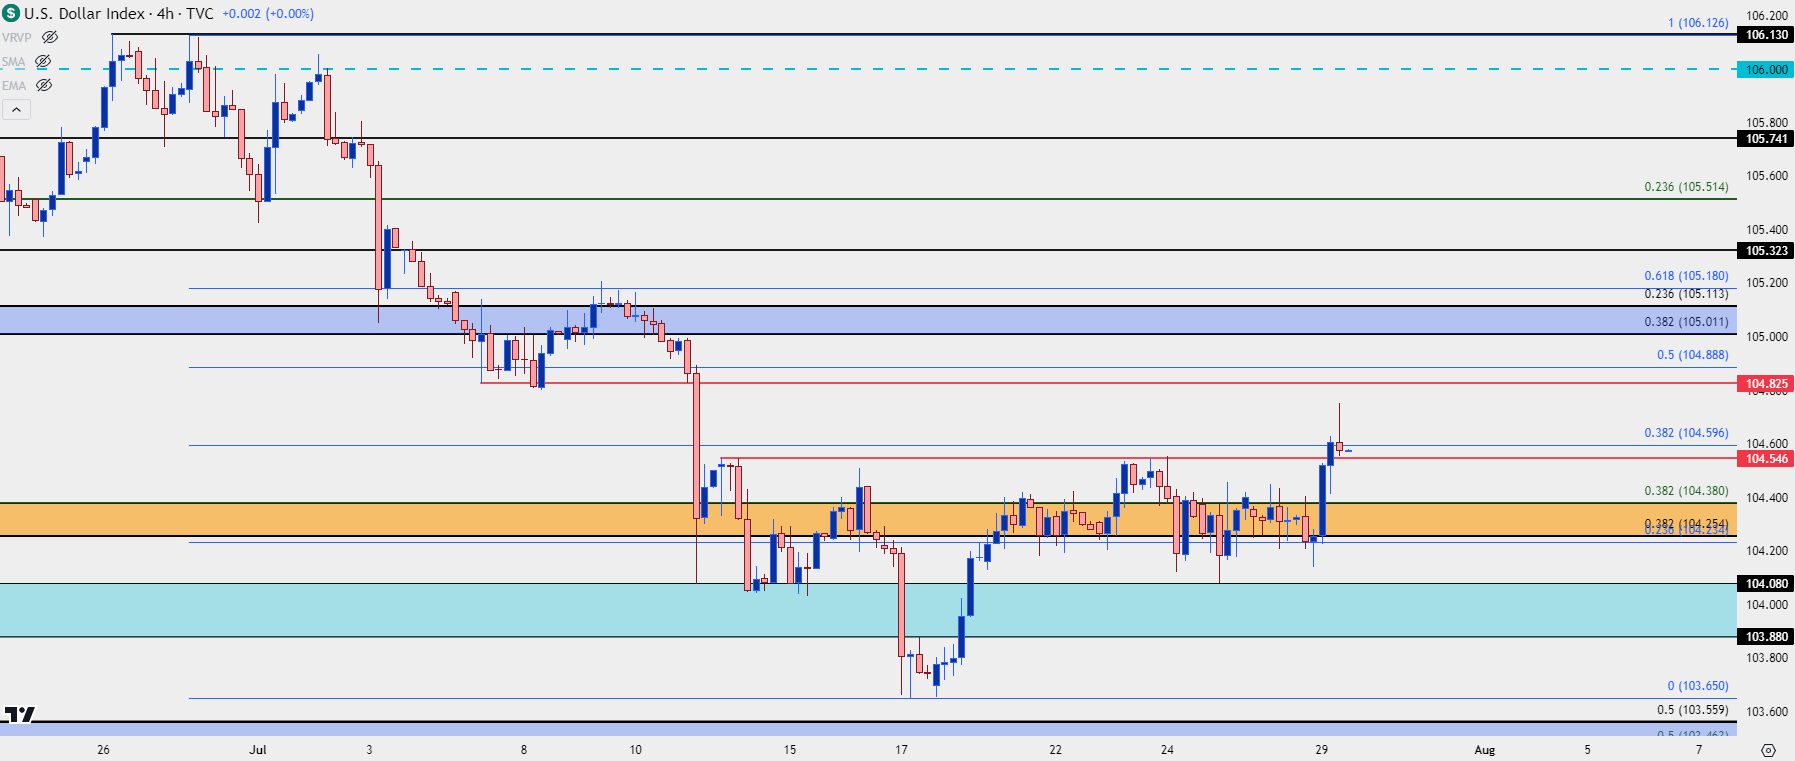
In the US Dollar, the inverse head and shoulders pattern that I looked at in the webinar last Tuesday yielded to breakout to start this week. And, going along with that, a pullback in EUR/USD developed with a key spot of support coming into play.
The big question now is continuation potential, and the BoJ rate decision can have impact here, along with the FOMC rate decision and Non-farm Payrolls drivers on the calendar for later this week.
US Dollar Four-Hour Price Chart
 Chart prepared by James Stanley; data derived from Tradingview
USD Bigger Picture
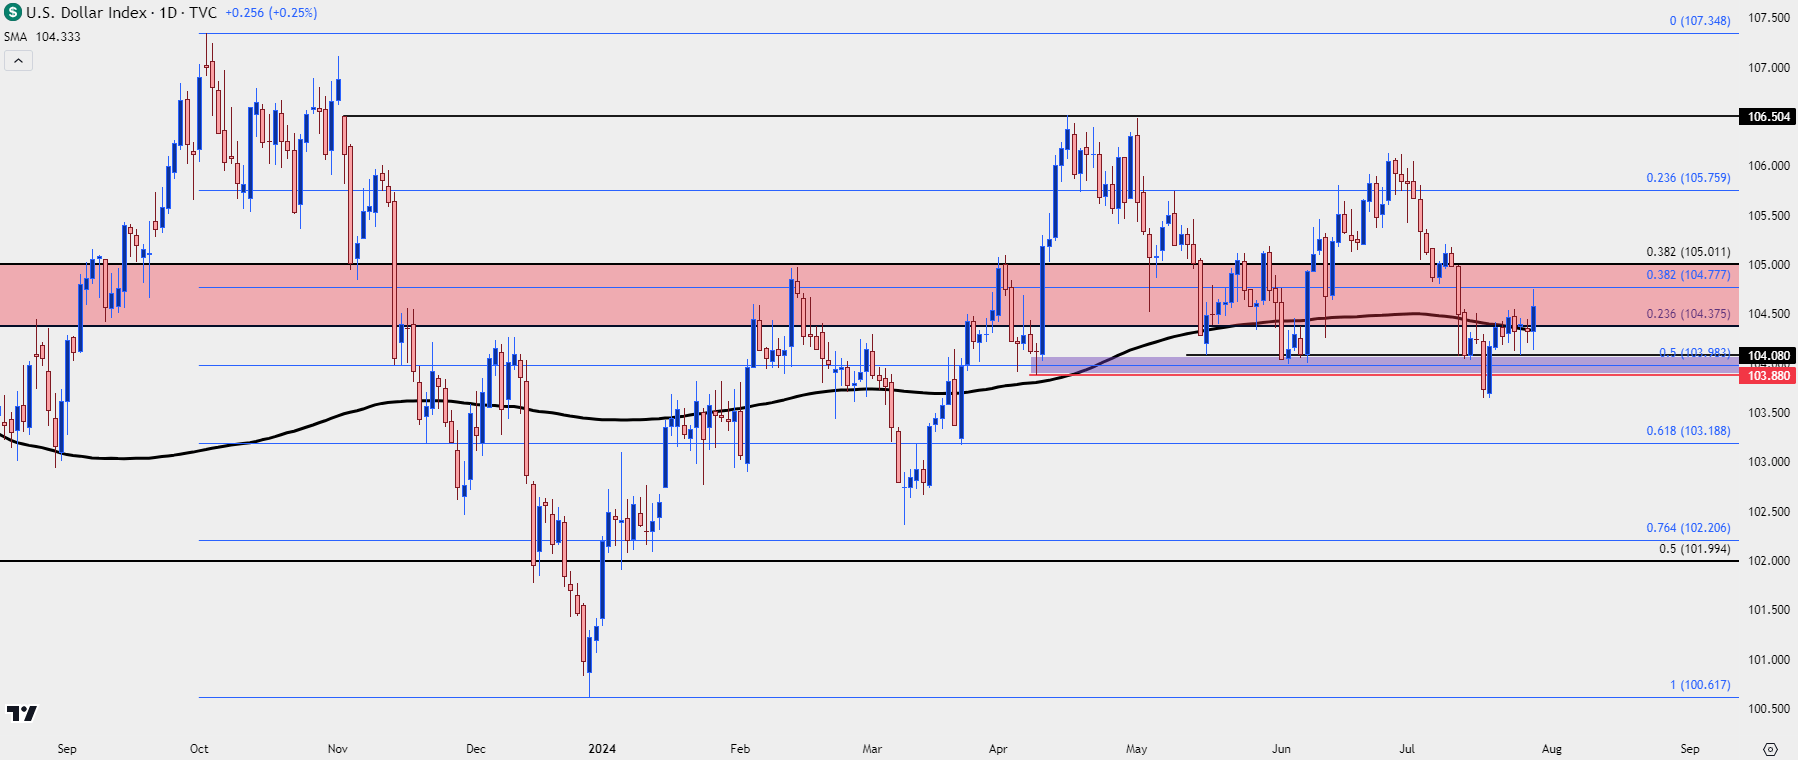
At this point, DXY is trading at its highest level since that CPI release on July 11th. And, longer-term, the range that’s built over the past 18 months remains in-play, with the USD posing a push above its 200-day moving average.
There’s a major spot of resistance sitting overhead at 105, which was a key point of contention for DXY in the first half of the year. If USD bulls can force a push, that’s a significant level that they’ll have to contend with.
US Dollar Daily Price Chart
 Chart prepared by James Stanley; data derived from Tradingview
EUR/USD
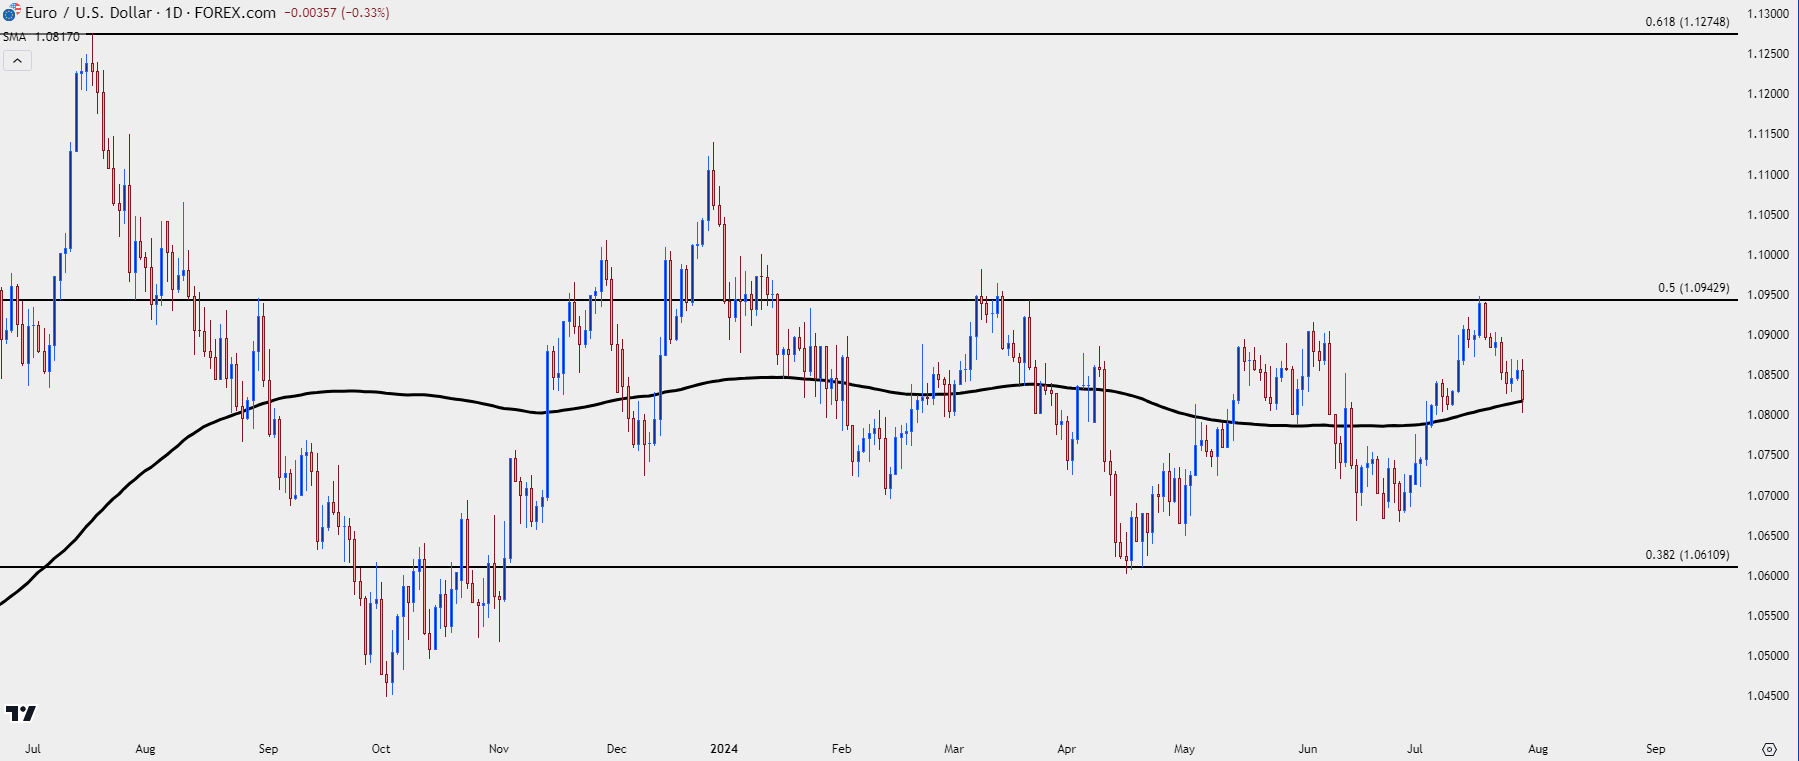
Going along with that recent strength in the USD, there’s been a building pullback in EUR/USD since the test at the Fibonacci level of 1.0943. That’s the 50% mark from the same study that helped to catch the 2023 high at 1.1275 (the 61.8% retracement) and the current 2024 low at 1.0611 (the 38.2% retracement).
This similarly echoes mean reversion and at this point, price is testing near the middle of the recent range with the 200-day moving average coming into play this morning.
EUR/USD Daily Price Chart
 Chart prepared by James Stanley, EUR/USD on Tradingview
EUR/USD Shorter-Term
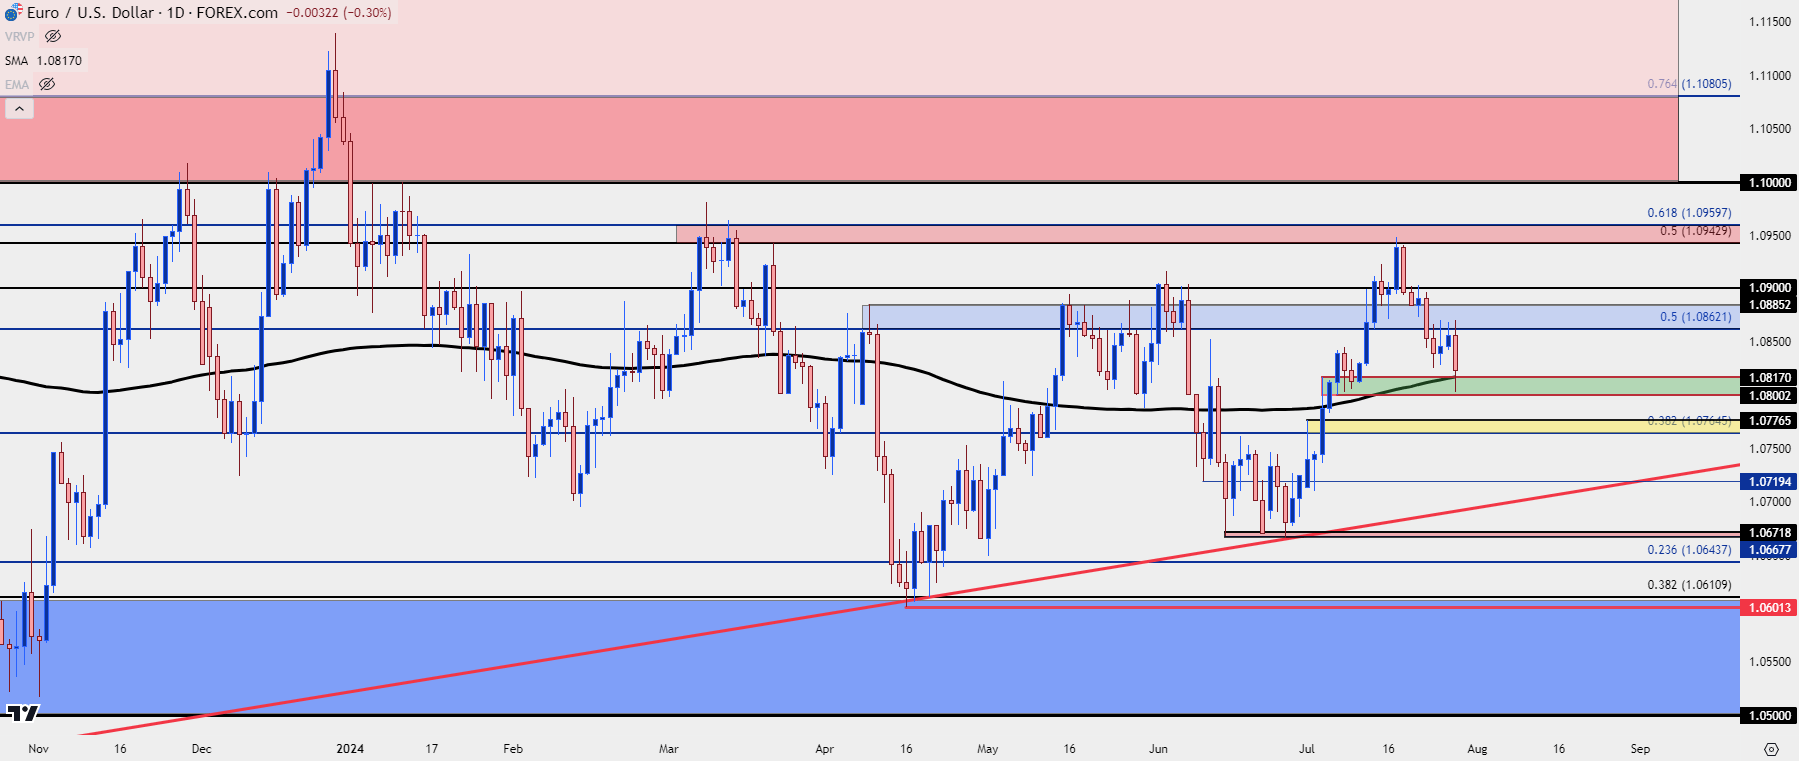
There’s more going on around that 200-day moving average in EUR/USD, as this is also a test of prior resistance in the same zone that held a higher-low earlier in the month.
This runs from the 1.0800 psychological level up to the 1.0817 prior swing-high. While this support does represent a possible spot for a swing, there’s also been a recent entrance of lower-lows and highs, showing bearish price structure since the 1.0943 Fibonacci level came into play two weeks ago.
This would highlight 1.0862 as a level of importance for bears, as there’s now been four days of resistance at that spot and this is the level that would need to be defended by sellers to keep that bearish sequence intact.
Below support in the 1.0800 zone, there’s a Fibonacci level spanned to a swing-high that runs from 1.0766 up to 1.0777, and then another price swing of note at the 1.0719 level. For key support, I’m marking the spot around 1.0670 which held the lows for two weeks in June before the topside trend took over. And below that, we have the longer-term range support spanning from 1.0500 up to the 1.0611 Fibonacci level that held support in April.
EUR/USD Daily Price Chart
 Chart prepared by James Stanley, EUR/USD on Tradingview
--- written by James Stanley, Senior Strategist


