Canadian Dollar, USD/CAD Talking Points:
- USD/CAD broke down last month below range support after a surprise rate hike from the Bank of Canada. And then the pair put in a bearish outside bar last Friday after strong Canadian employment data drove another run of CAD-strength.
- The Bank of Canada has another rate decision on Wednesday of this week and the pair has been showing a shorter-term bullish tendency after a falling wedge breakout two weeks ago. Can bulls continue to push price back into the prior range, or will BoC compel another push towards the 1.3000 handle?
- I’ll be discussing these themes in-depth in the weekly webinar on Tuesday at 1PM ET. It’s free for all to register: Click here to register.
It was a surprise when the Bank of Canada hiked rates last month. The BoC had previously paused rate hikes back in March, which had led to a bullish breakout in USD/CAD as the pair ascended above a key level at 1.3652, and this happened after an ascending triangle formation had set the stage for breakout. Prices in the pair moved up for a resistance test at 1.3855, which ultimately capped the highs a couple of days later before prices reverted right back into their prior range. By April, range support had come back into play, and after price set up a falling wedge formation there was another trip to the resistant Fibonacci level at 1.3652.
Last month saw that theme in reverse, as the Fed paused and the BoC hiked, which led to a breach of support as sellers pushed the pair below the 1.3338 level, which is relevant as this is the 50% retracement of the same major move from which the 61.8% marked resistance ahead of that breakout in March. Sellers continued the push, eventually setting a fresh nine-month low in late-June.
But, that was around the time that sellers started to show some stall, as I had shared in the webinar two weeks ago. That allowed for the build of a falling wedge formation, and that started to give way shortly after, with last week seeing expansion in that bullish move into Friday, at which point employment data from both the US and Canada was released.
USD/CAD Four-Hour Price Chart
 Chart prepared by James Stanley, USD/CAD on Tradingview
USD/CAD Big, Bad Daily Bar
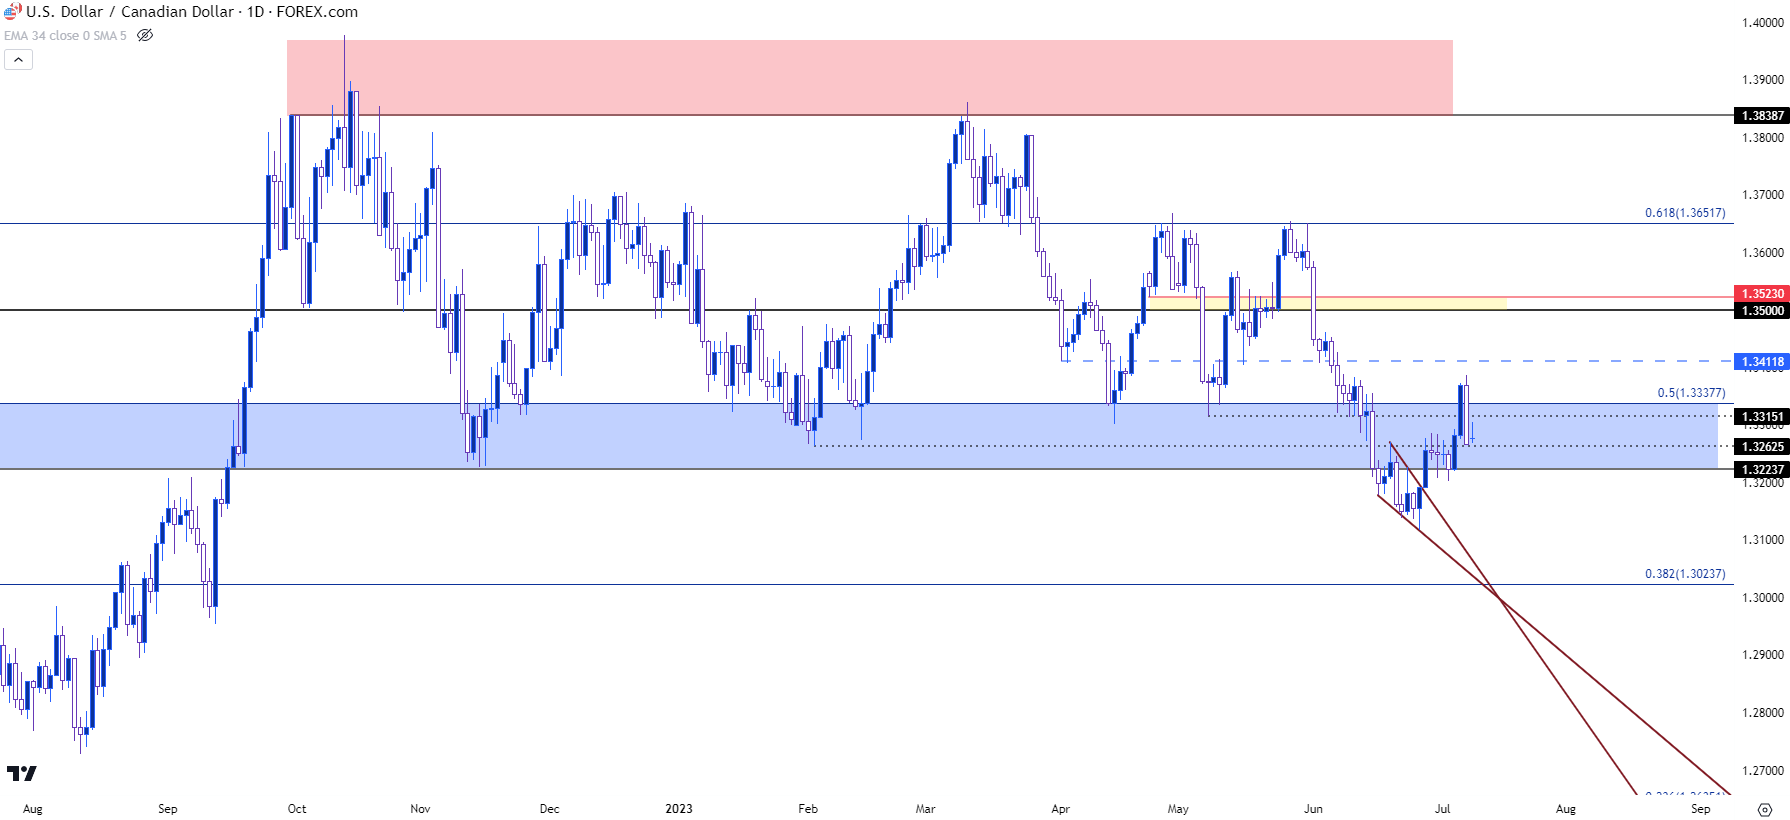
The Friday outing in USD/CAD was an aggressive sell-off. It wasn’t quite a bearish engulfing candlestick as the close of Thursday’s candle matched perfectly with the open of Friday’s candle, but it was an outside bar, which entails full coverage of the prior day’s candle, wick included. Outside bars are often approached with a similar aim as engulfs, however, in that a big statement was made during that period.
The outside bar moved right down to a key support level at 1.3263, which was the swing-low from early-February. That has since helped to hold the lows as today’s candle is currently showing as a doji, but it does bring question to the bullish reversal theme after what a fairly strong showing was otherwise.
From the daily chart below, we can see that level at 1.3263 coming into offer near-term support, with additional support a little lower, around 1.3224 which is a spot of resistance-turned-support.
USD/CAD Daily Price Chart
 Chart prepared by James Stanley, USD/CAD on Tradingview
USD/CAD Longer-Term
Taking a step back to investigate the bearish side of the argument, it would seem as though bears would need to make a move at some point this week to keep the door open to bearish trend potential in USD/CAD.
After the nine-month-low was set a few weeks ago, the weekly chart printed a bullish outside bar which led to continuation last week, until Friday, at least. That Friday reaction would seem to give bears an open door to test fresh lows, which could then open the door to a move down towards another Fibonacci level of interest from the same study that plots at 1.3024, which was last in-play as resistance-turned-support in September of last year. A breach of 1.3223 opens the door for a push down towards the nine-month-low at 1.3117, after which the Fibonacci level comes into the picture.
USD/CAD Weekly Price Chart
 Chart prepared by James Stanley, USD/CAD on Tradingview
--- written by James Stanley, Senior Strategist


