Weekly Technical Trade Levels on USD Majors, Commodities & Stocks
- Technical setups we are tracking into the weekly / monthly opens- US Elections, RBA, BoE, Fed on tap
- Next Weekly Strategy Webinar: Monday, November 11 at 8:30am EST
- Review the latest Video Updates or Stream Live on my YouTube playlist.
In this webinar we take an in-depth look at the technical trade levels for the US Dollar (DXY), Euro (EUR/USD), British Pound (GBP/USD), Australian Dollar (AUD/USD), Canadian Dollar (USD/CAD), Japanese Yen (USD/JPY), Gold (XAU/USD), Crude Oil (WTI), Silver (XAG/USD), S&P 500 (SPX500), Nasdaq (NDX) and the Dow Jones (DJI). These are the levels that matter on the technical charts heading into a historic week of event risk. .
US Dollar Index Price Chart – USD Daily (DXY)

Chart Prepared by Michael Boutros, Sr. Technical Strategist; DXY on TradingView
US Dollar dropped into confluent support into the start of the week at the 103.74/84- a region defined by the July low-day close (LDC), the 200-day moving average, and the 61.8% retracement of the Juned decline. Note that the median-line converges on the objective 2023 yearly open at 103.49 and losses would need to be limited to this level IF price is heading higher on this stretch.
Resistance is eyed with the October high-close at 104.42 with a more significant technical confluence eyed just higher at 104.87/97- look for a larger reaction there IF reached. US Elections are on tap tomorrow with the Federal Reserve interest rate decision slated for Thursday- watch the weekly close here for guidance.
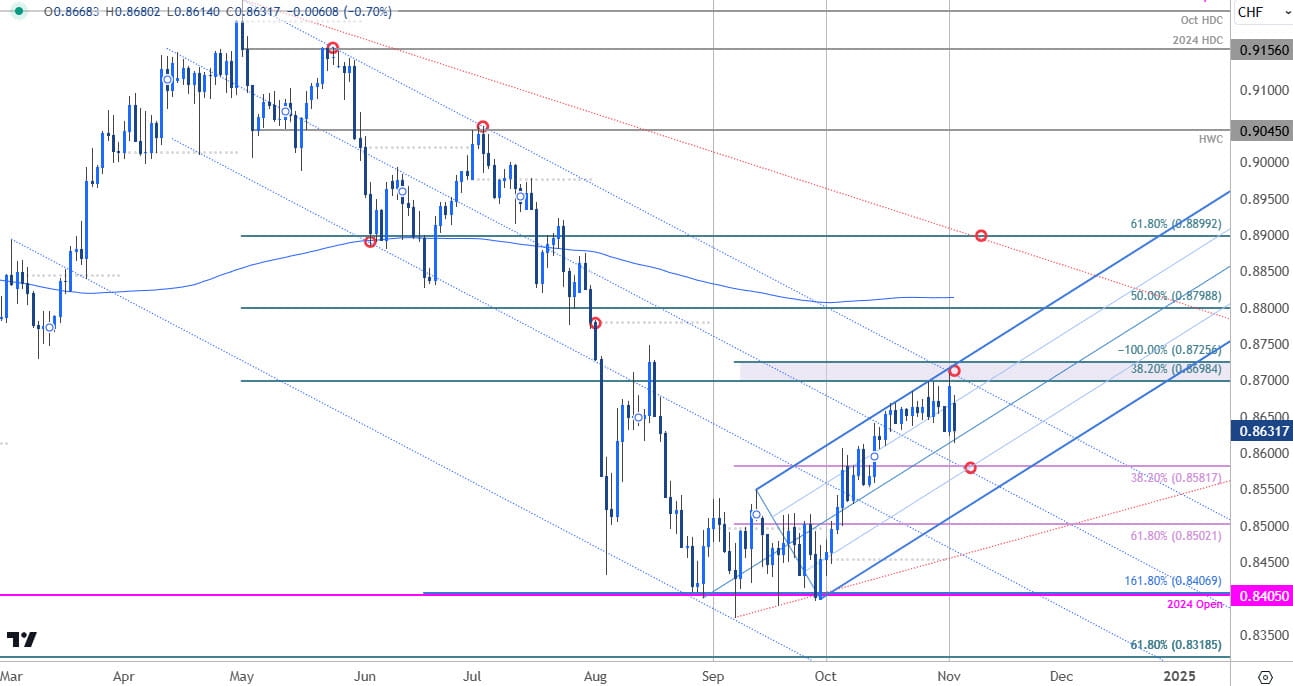
Swiss Franc Price Chart – USD/CHF Daily

Chart Prepared by Michael Boutros, Technical Strategist; USD/CHF on TradingView
A three-week rally stretched / failed into resistance last week at 8698-8725- a region defined by the 100% extension of the September range breakout and the 38.2% retracement f the 2024 range. USD/CHF has already pulled-back more than 1% from the Friday high and the focus is on median-line support here into the start of the week.
Bottom line: looking for signs of downside exhaustion early in the month. Initial support rests with the 38.2% retracement at 8582 with the trade constructive while within this formation. A breach / close above this resistance hurdle would be needed to fuel the next leg higher towards the 88-handle.
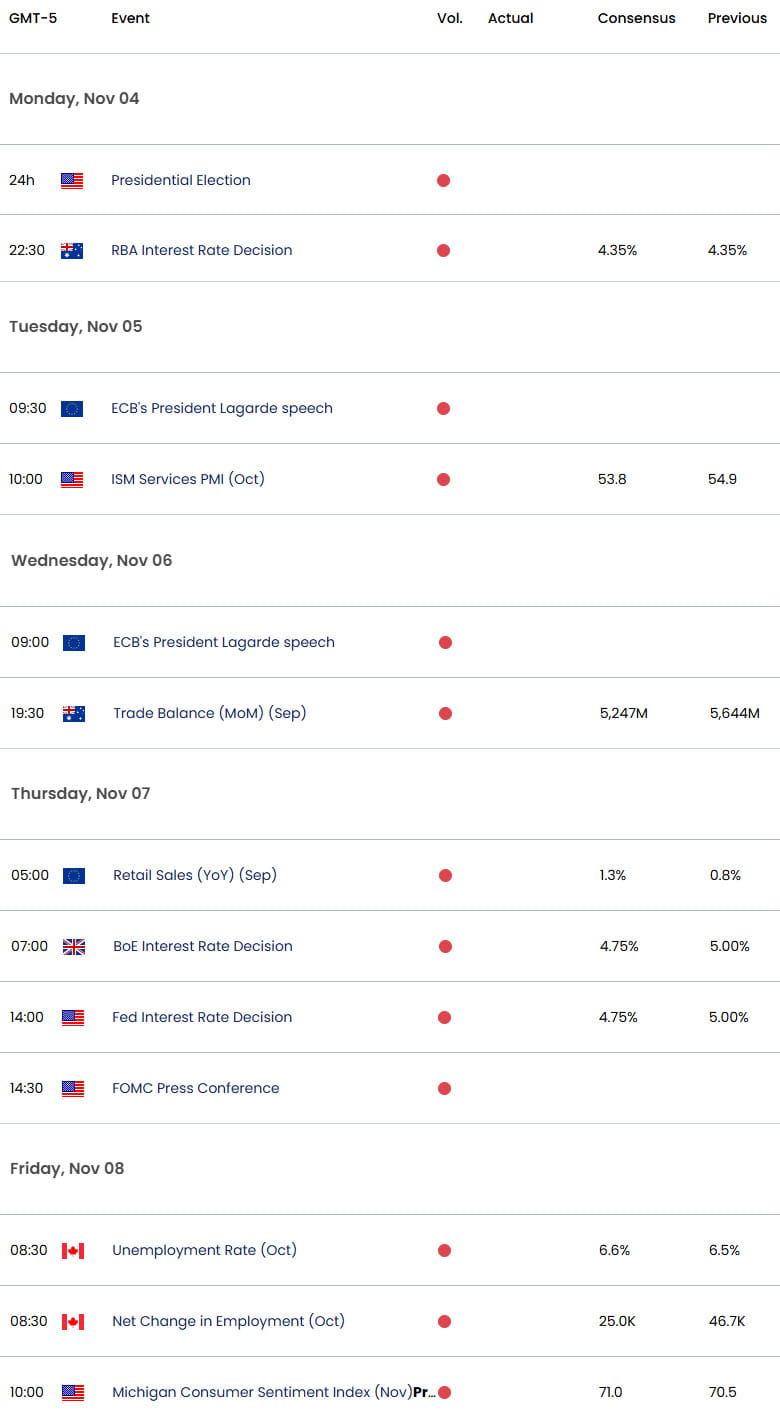
Economic Calendar – Key USD Data Releases

Economic Calendar - latest economic developments and upcoming event risk.
--- Written by Michael Boutros, Sr Technical Strategist
Follow Michael on X @MBForex


