The pendulum of market sentiment swings ever back and forth between fear and greed, euphoria and despondency. Lately, it seems like the time it takes to shift from one to the other is about a year, at least when it comes to the world’s reserve currency.
Back when we flipped our calendars from 2017 to 2018, longer-term positioning data showed that traders were extremely bearish on the US dollar’s prospects following a disappointing year for the world’s reserve currency, making it a smart contrarian bet to look for strength in the greenback.
As it turns out, the buck fell against every one of its major rivals except for the yen, and traders are once again betting on continued dollar strength. According to the CFTC’s Commitment of Traders (COT) report, speculative futures traders are long the US dollar index to the tune of nearly 40k contracts, near highest level since May 2017 and approaching the most bullish level since 2015.
Fundamentally speaking, the US economy may be the proverbial “best house in a bad global neighborhood,” but with the US yield curve flattening, fiscal stimulus from last year’s tax cut fading, and “trade war” tariffs starting to take a bite out of economic activity, the Fed will likely have to tap the brakes on further interest rate increases in 2019.
Conversely, the market’s expectations for any progress from other G7 economies and central banks are extraordinarily low. While those subdued outlooks may indeed come to pass, the odds favor a better-than-expected year for some of the dollar’s major rivals, especially the euro and the yen, where traders have amassed their most bearish positions in over a year.
In other words, we're presented with the mirror image scenario from the start of last year (which, in turn, was the mirror image of the situation at the start of 2017). The pendulum of market sentiment has shifted from extreme bearishness with low expectations to extreme bullishness with high expectations, potentially setting up dollar bulls for disappointment.
Technical View
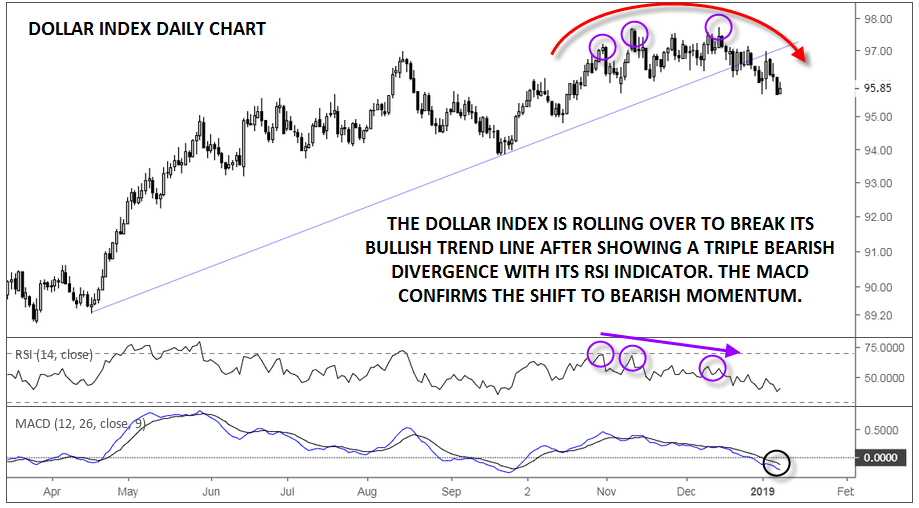
As the chart below shows, the technical outlook for the dollar index has been deteriorating for the last couple of months. The index showed a triple bearish divergence with its RSI indicator through November and December, signaling waning momentum despite the marginal new highs in the value of the index itself. Now, DXY has formed a “rounded top” pattern to break below its bullish trend line, and the lagging MACD indicator is trending lower below both its signal line and the “0” level, showing that the momentum has shifted to the bears.
In the short term, bears have the upper hand and will likely look to sell any bounces back toward 97.00. To the downside, the next levels to watch will be the October and September lows near 95.00 and 94.00 respectively. For more on the technical outlook for EUR/USD, the biggest component of the dollar index, see my colleague Fawad Razaqzada’s note “Could EUR/USD break higher?” from earlier today.

Source: TradingView, FOREX.com


