US Dollar Talking Points:
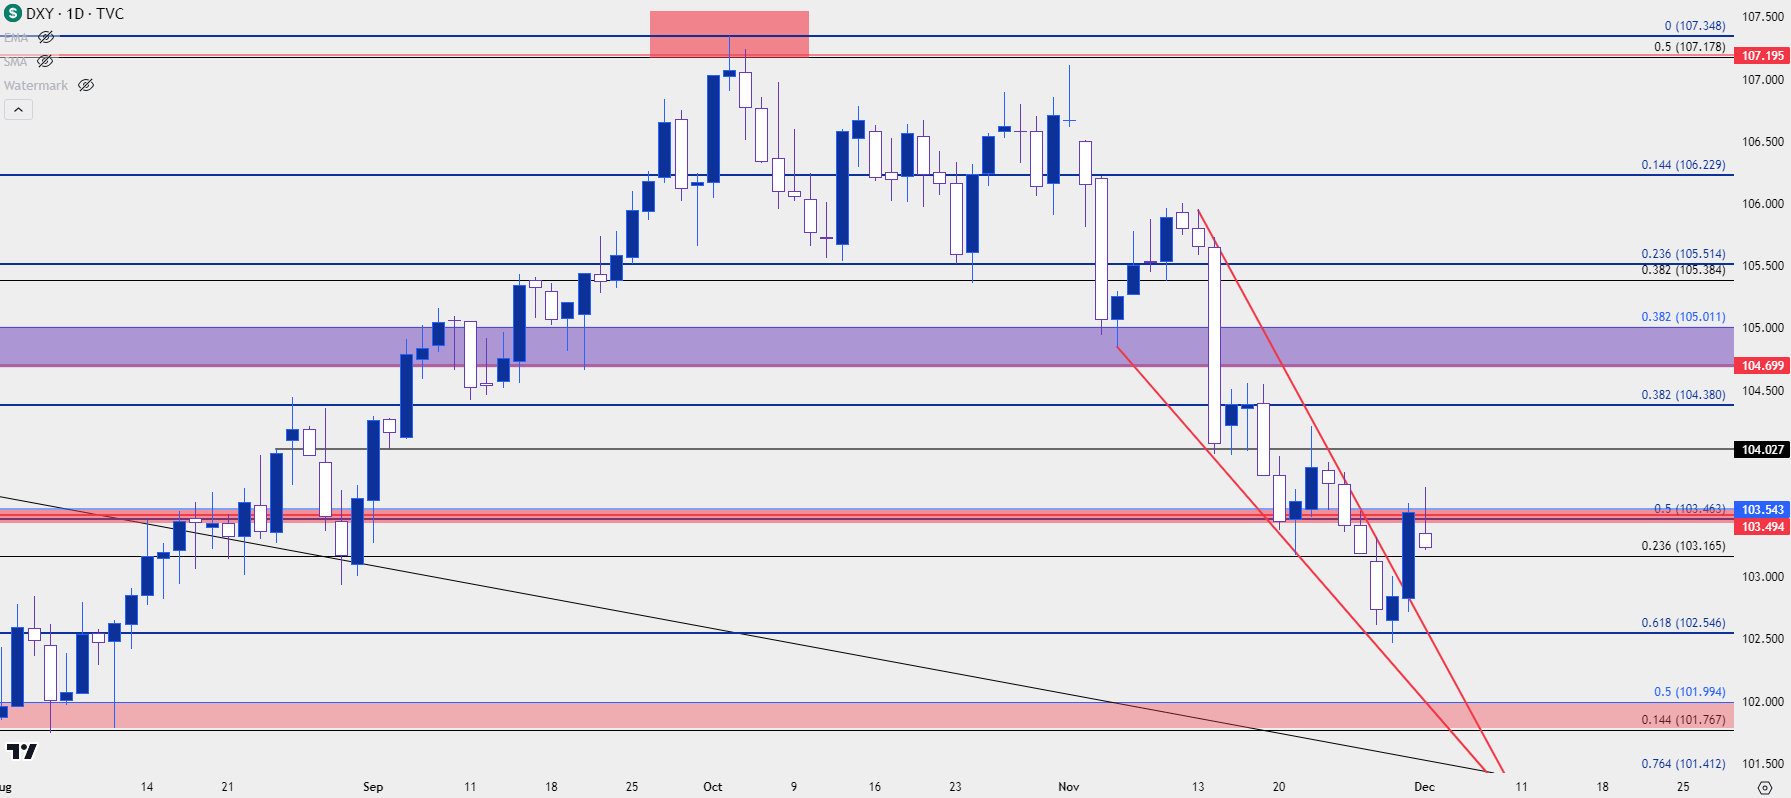
- The US Dollar set a fresh three-month low this week before putting in a support bounce on Wednesday, helping to push DXY back to the 103.50 level, which has so far held as resistance for Friday trade.
- November was a brutal month for US Dollar bulls as DXY was down by -2.99%, making for the largest monthly loss since last November.
- The USD shied away from resistance on November 1st ahead of the FOMC rate decision, with bears taking a firmer hold after the NFP report that was released a couple of days later. But the large push happened around the release of CPI data on November 14th, and this had some similarity to the way matters played out last year.
- I’ll be discussing these themes in-depth in the weekly webinar. It’s free for all to register: Click here to register.
The sell-off has continued in the US Dollar for a third consecutive week, marking a change of pace from the range that had built in October on the heels of a strong bullish trend. And even going back to the beginning of November there’s been a shift taking place, which seemed to start around the FOMC rate decision on the first day of the month. At that press conference, Chair Powell didn’t sound all-too dovish in my opinion, directly stating that rate cuts aren’t even in the conversation right now. But as is often the case around such scenarios, market participants jumped on the phrases that they did want to hear (which can be a show of sentiment) and Powell’s remarks about how quickly inflation had fallen further drove hope that the Fed is finished with rate hikes for this cycle.
That helped the USD to pullback, but it was the NFP report that came out a couple of days later that really added to the push, and initially this brought in a support test at the 105.00 handle.
That bounce lasted for about a week, but sellers went on the attack after the release of CPI data on November 14th, pushing all the way down to the 104 handle, which led into further extension in the bearish move that held into this week.
Support for DXY finally appeared on Wednesday, right around a key Fibonacci level. The price of 102.55 is the 61.8% retracement of the bullish trend that began in July, and a few other levels from that same study have already shown some items of interest. The 50% mark of that major move is at 103.46, confluent with 103.50 which I’ll address here in a moment. The 38.2% retracement of that move is at 104.38, which held lower high resistance after the CPI-fueled breakdown move. And even the 23.6% retracement had some impact, as this had held a lower-low in late-October before bears ultimately went for the breakdown move.
US Dollar Daily Price Chart (indicative)
 Chart prepared by James Stanley; data derived from Tradingview
USD/DXY, 103.50
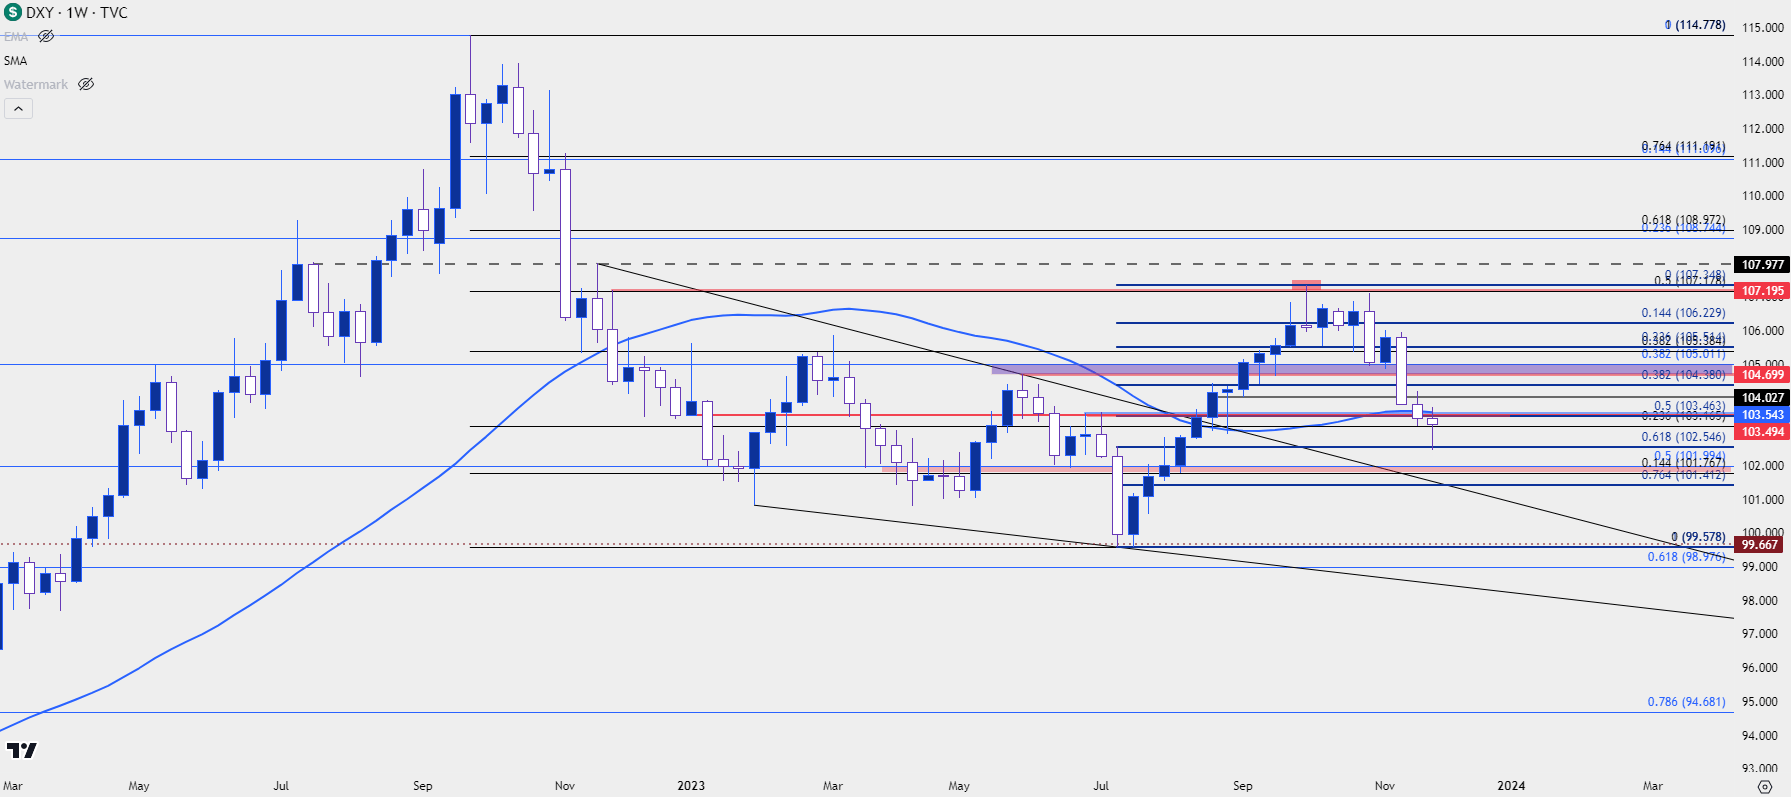
The level at 103.50 is a big spot for the US Dollar/DXY. This was the yearly open price and it’s also around the 50% marker of that recent bullish trend. But it’s also had some history, as this level helped to set a double top formation in July, just ahead of a breakdown attempt from bears.
Bears failed to hold the move and that’s what led into the slingshot-like move that started in July and ran through October. It’s also nearby the 200 day moving average, which had last come into the picture as higher-low support in August as USD bulls were getting back in the driver seat.
I have that plotted on the below weekly chart, which could be seen as a buffer or a decision point to the indecisive weekly candle that’s in the process of building.
US Dollar Weekly Chart (indicative)
 Chart prepared by James Stanley; data derived from Tradingview
US Dollar Shorter-Term
From the four-hour chart we can see what bulls trying to start a rally this week after that support had come into play off the 61.8% retracement. There was even an early-Friday attempt to breakout beyond 103.50, but that move has snapped back somewhat aggressively after some comments from FOMC Chair, Jerome Powell, which markets clearly took with a dovish read.
The big question now is whether sellers are too exhausted to continue the trend down to fresh lows or whether there remains some bullish potential. From the four-hour chart, there does remain some bullish structure given a recent higher-high, with the question now whether buyers will come into support higher-lows.
There are a few spots of interest for such, like the 103.17 level, after which a resistance-turned-support swing comes into the picture at 103.04.
US Dollar Four-Hour Price Chart
 Chart prepared by James Stanley; data derived from Tradingview
EUR/USD
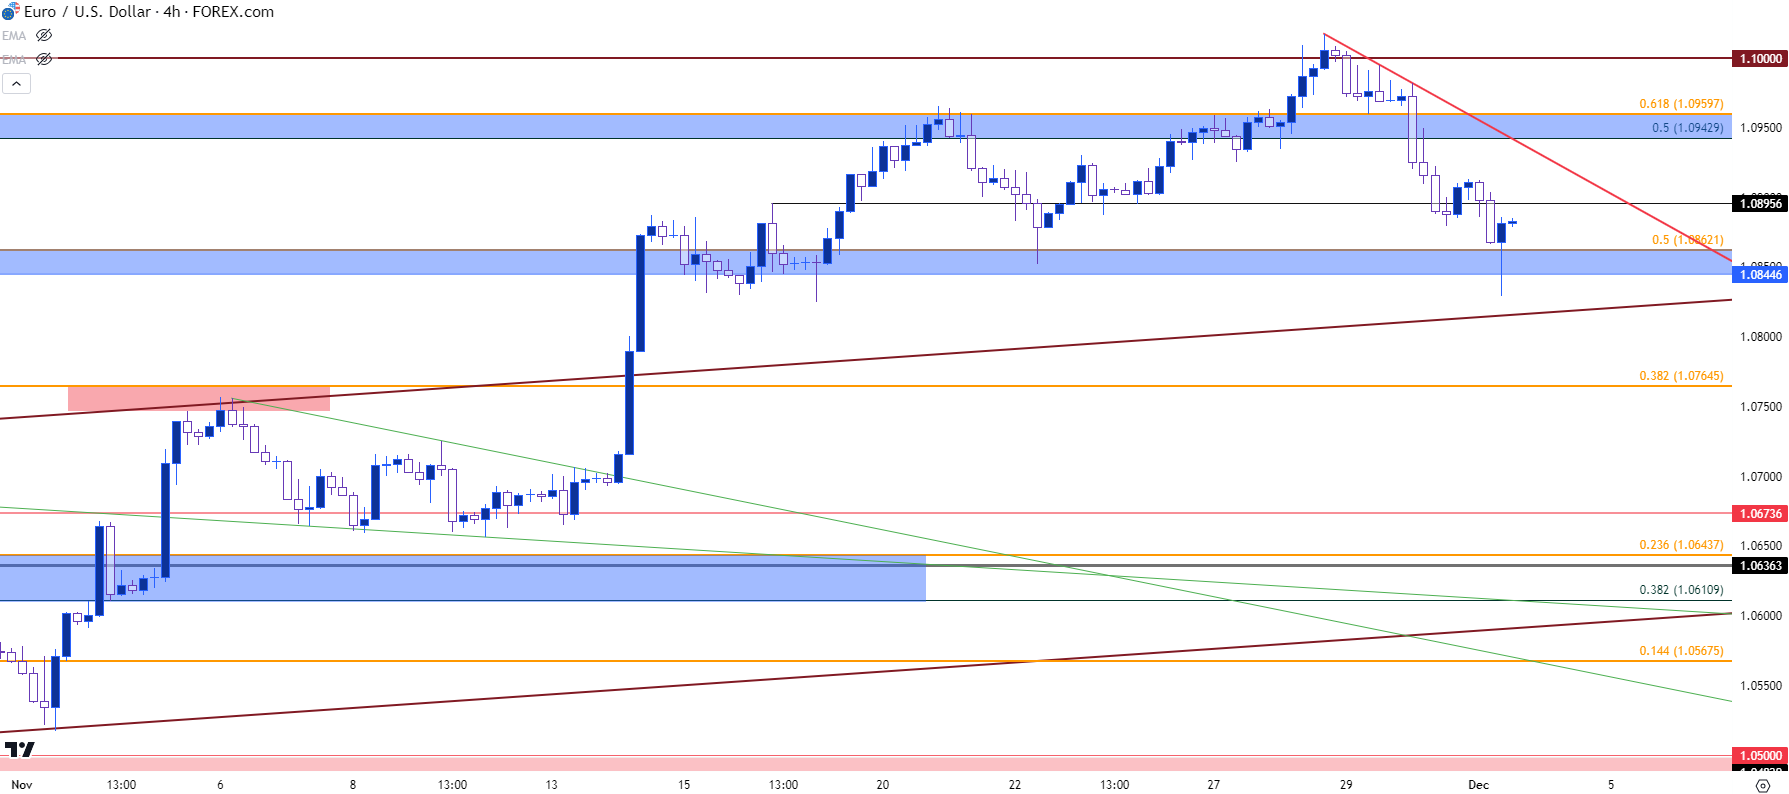
That early-Friday breakout attempt in the USD did have some assistance from elsewhere, as a remark by ECB policymaker Francois Villeroy de Galhau indicated that, absent any unforeseen shocks, that rate hikes at the ECB are completed. He also said that disinflation is even faster than expected, both of which would generally be perceived as euro-negative. And that negativity in EUR/USD helped to push a fresh two-week low, before Jerome Powell’s comments started to get attention on Friday. And similar to the early-November press conference, Powell sounded somewhat balanced in my opinion but the reaction certainly has not been as that prior breakout has quickly reversed.
In EUR/USD, this helped to build a hammer formation on the four-hour chart after that probe of support.
EUR/USD Four-Hour Price Chart
 Chart prepared by James Stanley, EUR/USD on Tradingview
EUR/USD Bigger Picture
As of this writing, the EUR/USD weekly bar is showing as a bearish engulf; but that may not hold given how quickly this bullish move has priced-in after the Powell speech. But, from the daily we can get some perspective that can provide some backdrop for early next week’s trade, namely the question of whether sellers show up to hold lower-high resistance.
The 1.1000 level is a major psychological level; and similar to how the 1.0500 level stalled the sell-off in September and through October until, eventually, matters could turn, the 1.1000 level could potentially present a similar stumbling block for bulls.
So, if we see sellers show up before that level comes into play, and there’s an operable zone for such between the Fibonacci levels at 1.0943-1.0960, then there could be a building case for a bearish reversal potential. But – if that spot does not hold the highs and bulls go back up to the 1.1000 handle for a re-test, then we may not have yet seen the end of this bullish trend.
EUR/USD Daily Price Chart
 Chart prepared by James Stanley, EUR/USD on Tradingview
GBP/USD
The bullish move in Cable really came alive in November, and I had looked at that in the Thursday article after a major zone of resistance had come into the picture which I had highlighted a couple of days earlier in the webinar. This zone runs from 1.2720-1.2758, and it held the highs on Wednesday as USD was probing for support, and that led into a noticeable pullback move on Thursday.
Collectively, price action between Tuesday and Thursday built an evening star formation, which is often approached with the aim of bearish reversal. Given Friday trade, however, it looks like bears are remaining on the hot seat as prices have quickly snapped back and are nearing a re-test of that key resistance zone. If the Wednesday high gets taken out at 1.2733, then the evening star formation is negated, and this would put focus on the 1.2758 level that sits atop that zone.
GBP/USD Daily Price Chart
 Chart prepared by James Stanley, GBP/USD on Tradingview
USD/JPY
I had noted this around the CPI release in November but, if the USD has topped and if Dollar-bears were going to push a larger move, then USD/JPY could be a point of interest given the potential for unwind of the carry trade.
While rate divergence can push a carry trade, the USD/JPY market is ultimately driven by supply and demand and rate divergence and supply/demand isn’t always the same thing. Last year illustrates this well, where a dizzying reversal developed that entailed a 2,400-pip pullback in three months even as rate policy remained the same for both the US and Japan.
That was largely driven by carry trades unwinding, which was driven by fear of a USD reversal, and the bearish trend held for three months despite the negative carry that would populate on the short-side.
If traders that have held long USD/JPY positions as driven by the carry, all the sudden, fear that the market might move the other way, this could provide motive for closing the position, which would lead to greater supply. And as prices begin to turn-lower, this could create even more supply, and less demand, as there’s a reversal beginning to show.
When this all took place last year in November the move was fast and aggressive. So far this year it’s been far slower and stickier, but there has been a similar pattern of lower-lows and lower-highs developing since the November 14th CPI release.
USD/JPY Weekly Price Chart
 Chart prepared by James Stanley, USD/JPY on Tradingview
Despite the similarities between this year and last, these are completely different scenarios and it’s worth also noting the differences. Namely, that sell-off showed up quickly last year and left little question as to what was happening after the release of that CPI data. But this year has instead showed the move as a building bearish trend, rather than an aggressive breakout. And more to the point, there have been some clear periods of strength, which may be indicating a continued bullish response given the still-positive carry backdrop.
From the daily chart below, we can see that recent build of lower-lows and lower-highs, with USD bears taking another shot at support today. The 145 level looms large and that’s confluent with a Fibonacci level that plots at 144.84. For lower-high resistance potential, 147.37 remains of interest, albeit very nearby current price, and there’s another possible spot a little higher, around 147.88.
USD/JPY Daily Price Chart
 Chart prepared by James Stanley, USD/JPY on Tradingview
--- written by James Stanley, Senior Strategist


