
US Dollar Talking Points:
- The US Dollar had a busy day last Wednesday on the heels of last week’s webinar, with a CPI-fueled sell-off getting faded after a hawkish FOMC outing. At the time of the webinar, DXY was attempting to hold support at the prior area of resistance at 105-105.13.
- For USD continuation, the big question now is whether EUR/USD is ready to test longer-term support.
- I’ll be discussing these themes in-depth in the weekly webinar. It’s free for all to register: Click here to register.
The US Dollar had a big outing in the back-half of last week, with a major push point from the FOMC rate decision. While the Fed had forecast 2-3 cuts back in March, they whittled that down to 1-2 cuts at last Wednesday’s meeting and given that this had taken place after the ECB had already cut rates, it allowed for USD-strength to re-appear. And interestingly, earlier in the morning CPI had come out below expectations again which furthered the theme from May when data had started to go their way.
The US Dollar had found support right at the 104.26 level looked at in last week’s webinar. That came into play after the CPI release and that held into the FOMC meeting later last Wednesday. And then as the Fed released their statement at 2 PM and then the press conference at 2:30, the USD rally continued to push.
Last Friday saw the US Dollar extend its run up to resistance at 105.74, which has since held the highs. And the pullback from that has remained as constructive thus far with 105-105.13 come into play just ahead of the start of the webinar.
US Dollar Daily Price Chart
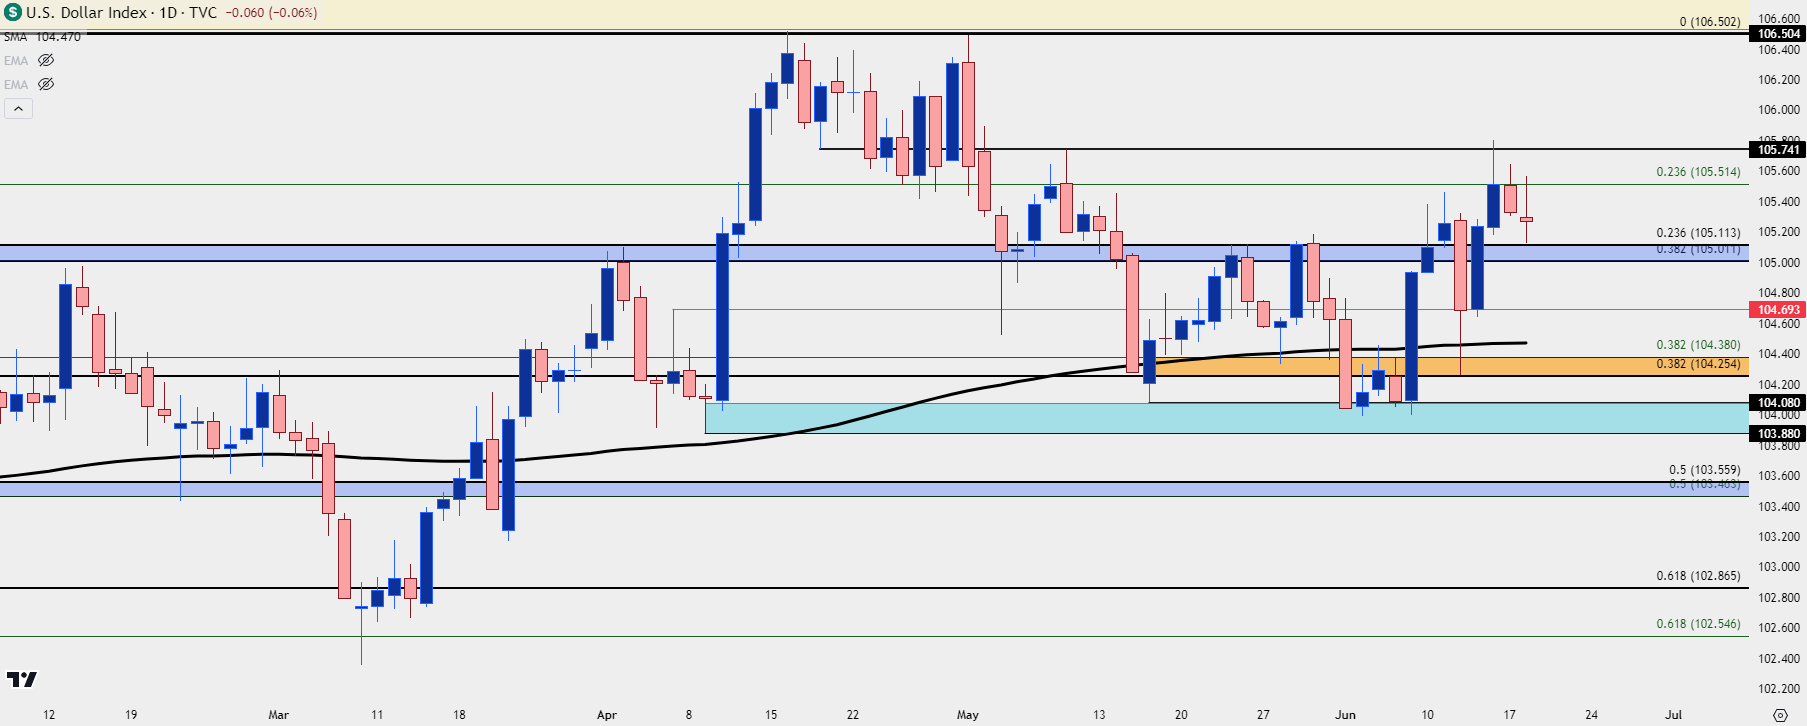 Chart prepared by James Stanley; data derived from Tradingview
USD Longer-Term
Notably, the US Dollar has held the 200-day moving average as support from the weekly chart for the past five weeks. This highlights a possible bigger-picture shift and overhead resistance at 106.50 is the next big line in the sand, as this set a double top formation that filled and completed during last month’s trade. But USD bears couldn’t establish any significant trends below the 200-dma after that formation completed, so the question now is whether bulls can make a mark on the longer-term chart.
US Dollar Weekly Price Chart
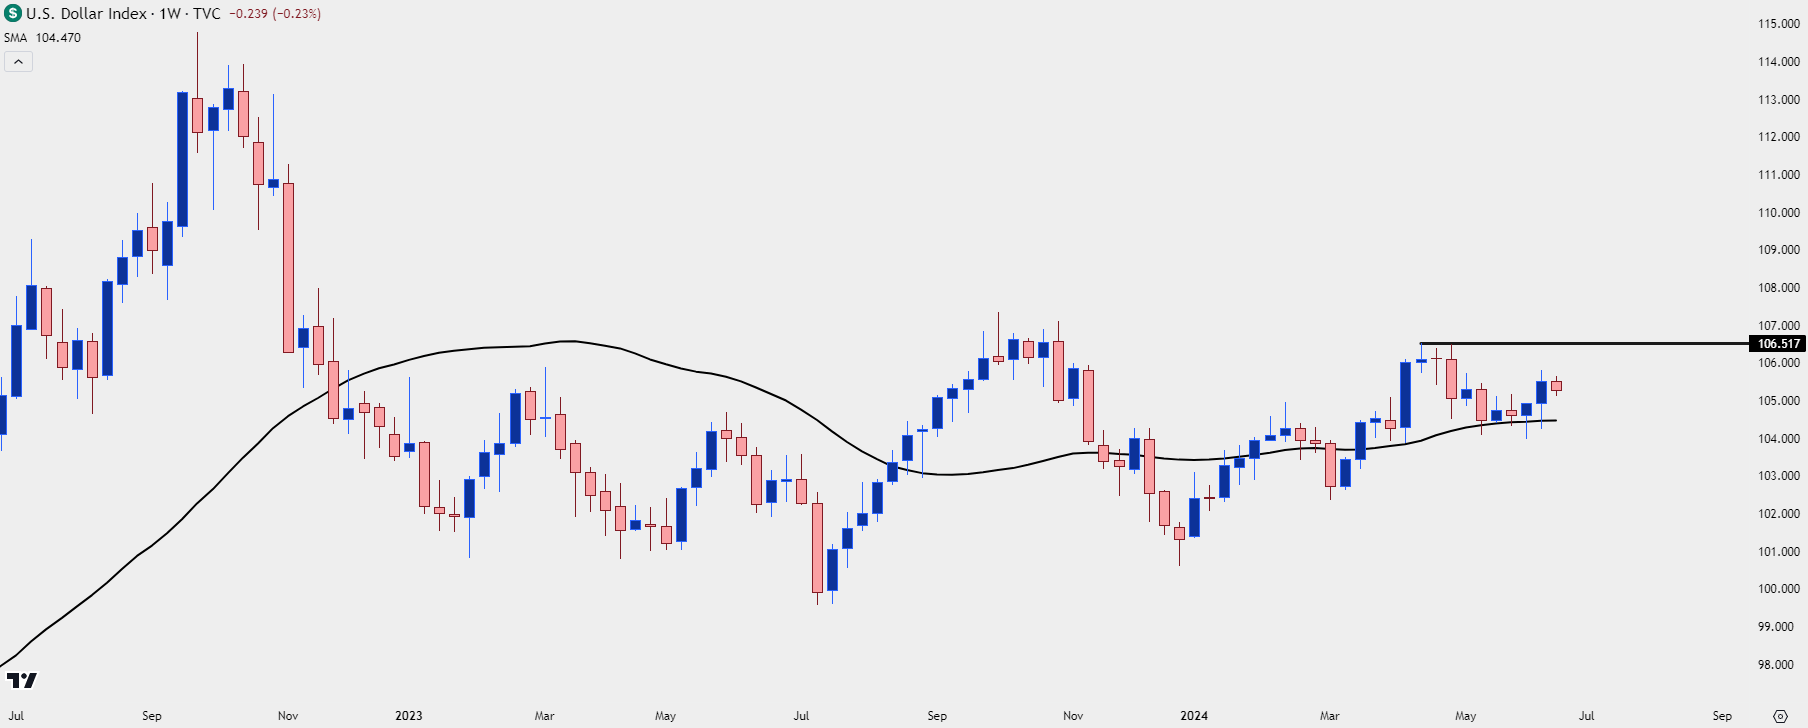 Chart prepared by James Stanley; data derived from Tradingview
EUR/USD
One challenge for USD bulls trying to run a big picture breakout is going to be the longer-term range support that’s set in EUR/USD. While the ECB has started with rate cuts, they also remained evasive around future rate moves, and this can keep markets guessing a bit as data comes in that could paint that picture a little more clearly.
But, at this point EUR/USD has made a fast push down to range support and sellers have slowed so far this week. In the webinar, I looked at a couple of spots for possible resistance on pullbacks, including the 200-day moving average that was traded through last week.
From the weekly chart below, there’s a descending triangle as taken from the bearish trendline and horizontal support that’s been in-play since the 2023 open.
EUR/USD Weekly Price Chart
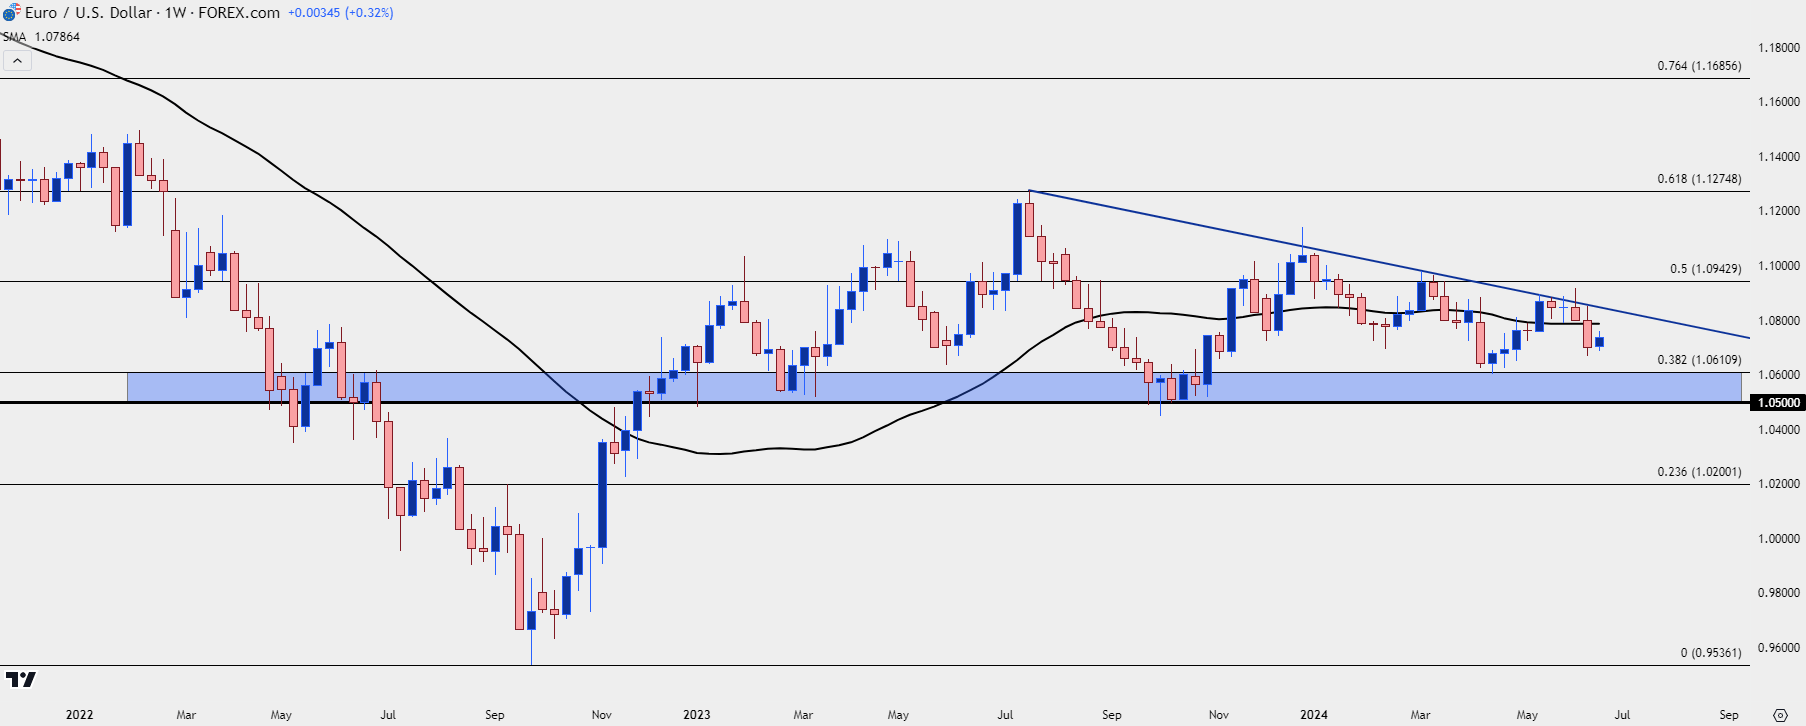 Chart prepared by James Stanley, EUR/USD on Tradingview
GBP/USD
For USD weakness scenarios, I still think GBP/USD holds some attraction. But, with that said, bulls have some work to do as I had shown in the webinar. The support zone that was in-play last week from 1.2692-1.2710 was traded through last Friday when USD was in the midst of an aggressive rally.
On a shorter-term basis, bulls appear to be putting in effort to reclaim that zone, as shown by higher-highs and higher-lows on the four-hour chart.
GBP/USD Four-Hour Price Chart
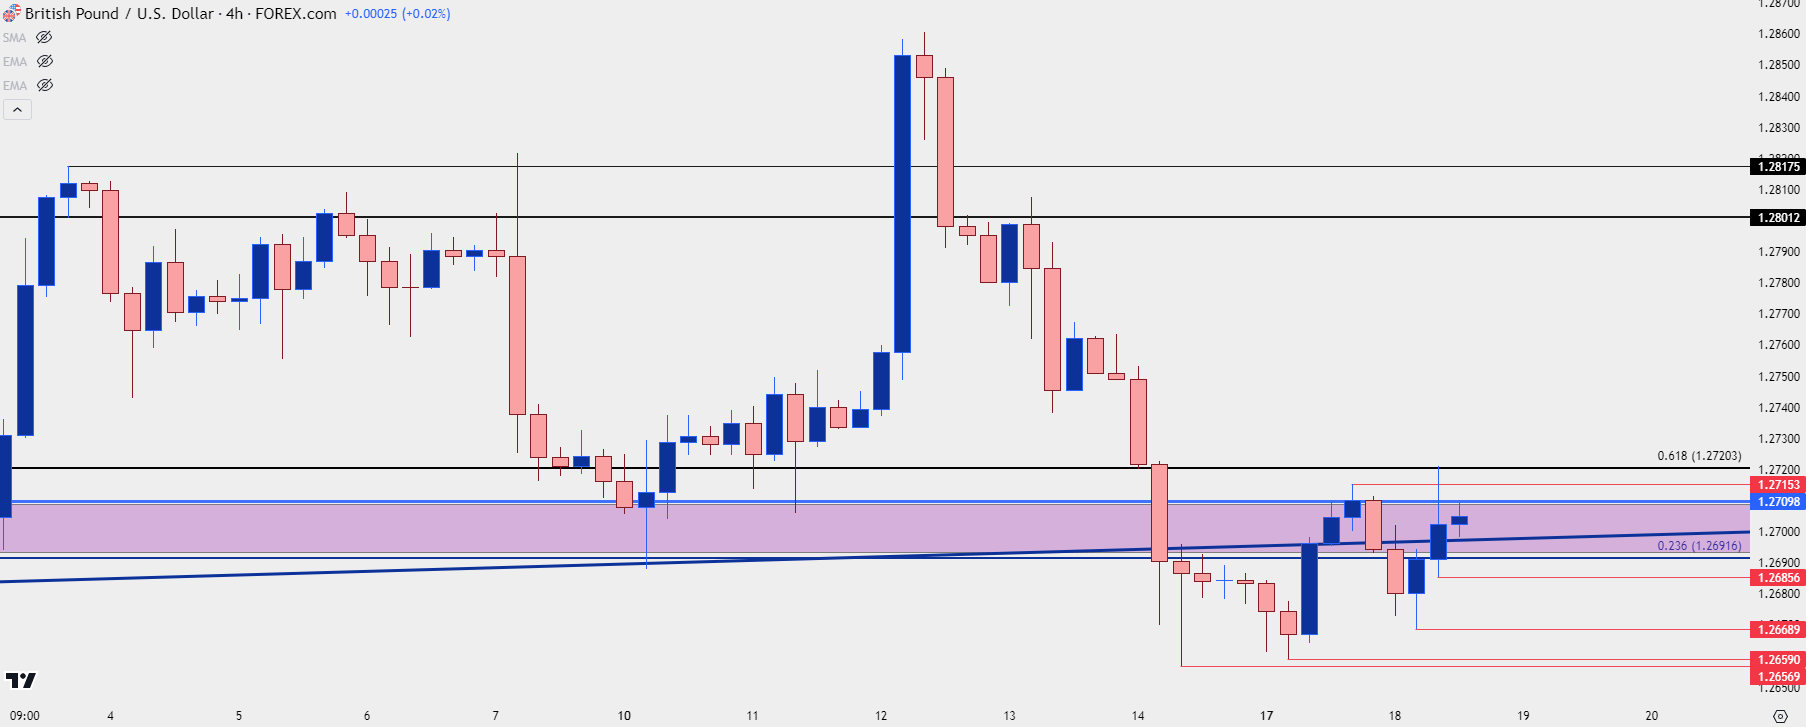 Chart prepared by James Stanley, GBP/USD on Tradingview
AUD/USD
For USD-weakness scenarios, AUD/USD has been growing more attractive. Despite the USD spike last week, AUD/USD held support well, with bulls forming extended underside wicks on the daily bar for both Friday and Monday. There’s a longer-term trendline sitting overhead but that’s also seen a bit of bend lately, as buyers tested a break ahead of the Fed last week.
Notably, while both GBP/USD and EUR/USD show support breaches last Friday on the back of that USD-strength, AUD/USD held up well. So, if we do see the US Dollar reverse into weakness, I think AUD/USD could remain as attractive.
AUD/USD Daily Price Chart
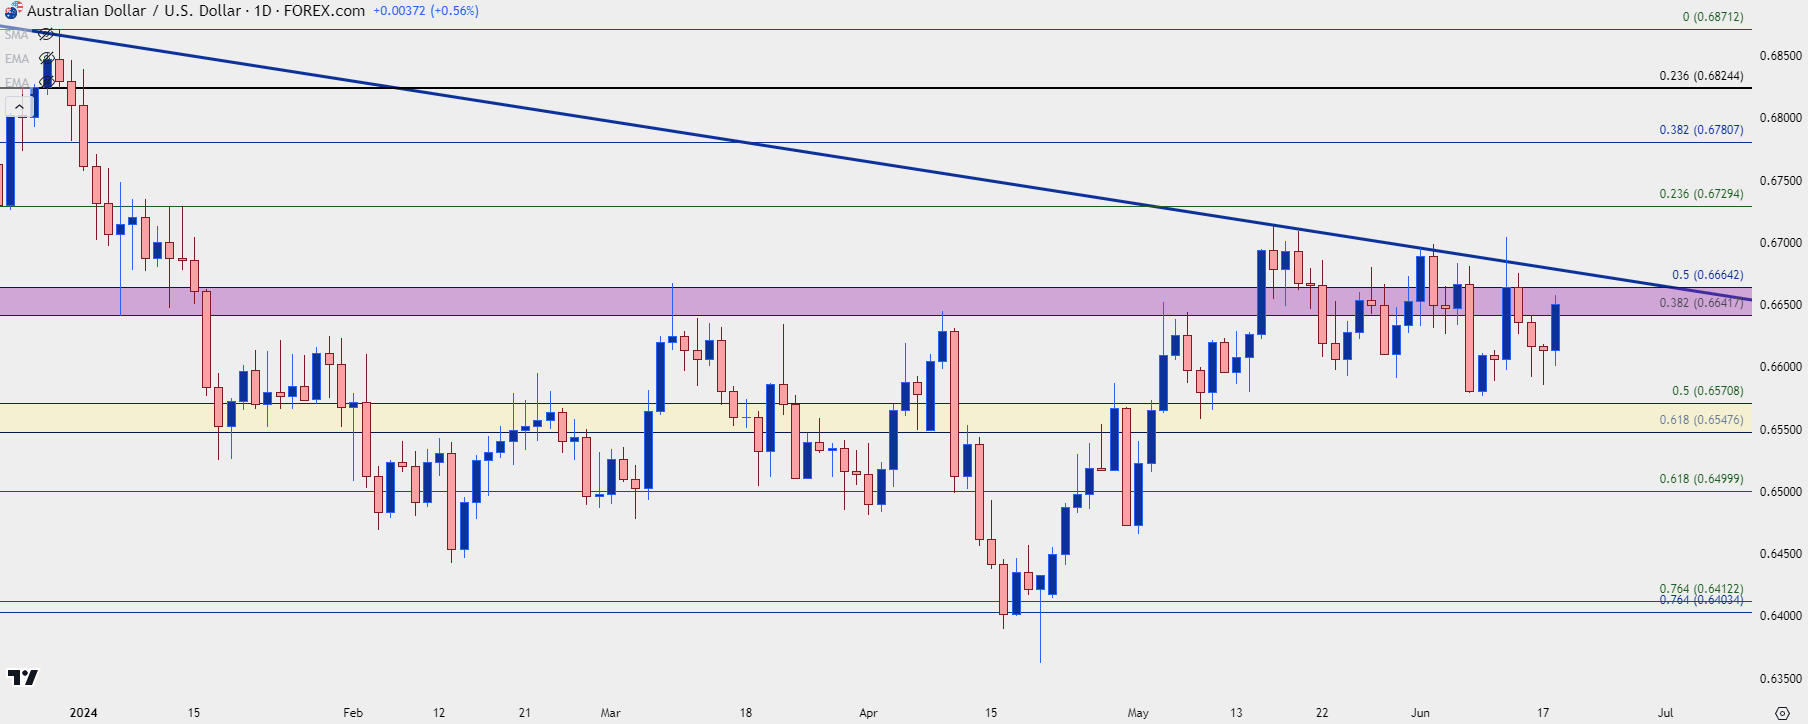 Chart prepared by James Stanley, AUD/USD on Tradingview
USD/CAD
USD/CAD is still on my radar for USD-strength scenarios. The pair is currently re-testing the ‘s2’ support zone from last week’s webinar and given the upper wicks on the past three daily candles (including today’s incomplete candle), there could be a larger pullback. If so, the 1.3652 Fibonacci level remains of interest for support potential.
USD/CAD Daily Price Chart
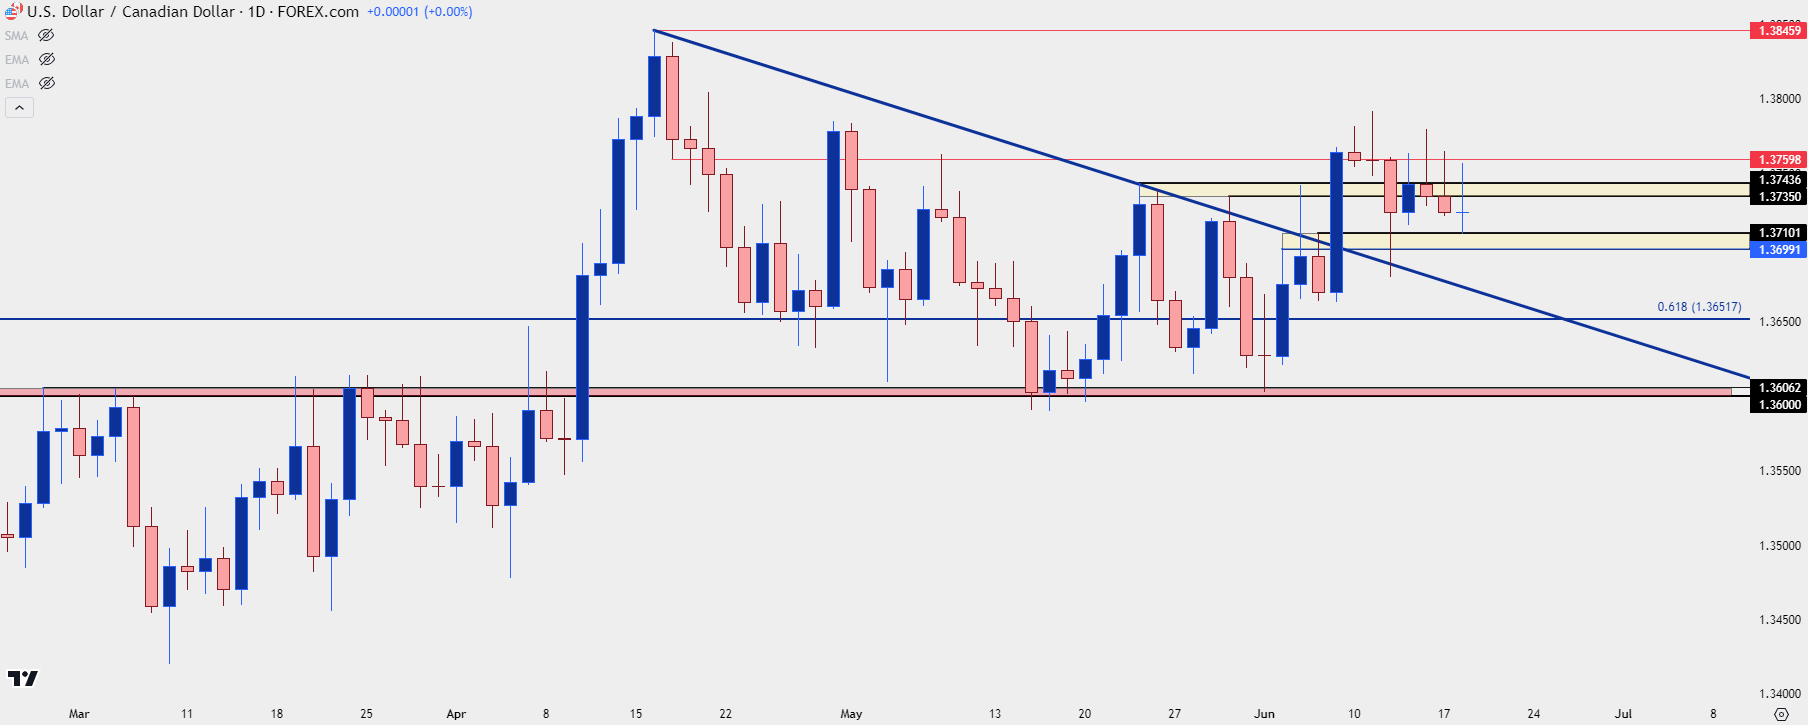 Chart prepared by James Stanley, USD/CAD on Tradingview
XAU/USD (Gold)
This is another market that remains of interest, particularly in USD-weakness scenarios.
Gold was in a strong trend coming into Q2 trade, but for the past two months has been largely range-bound. Buyers haven’t been able to do much above 2400, and sellers haven’t been able to take control below 2300. This has built a head and shoulders like backdrop, and given the longer-term context, if bears can elicit a breach of support, the 2075 level that held the highs for three years sticks out, as it hasn’t yet been re-tested for support since the breakout.
XAU/USD (Gold) Weekly Price Chart
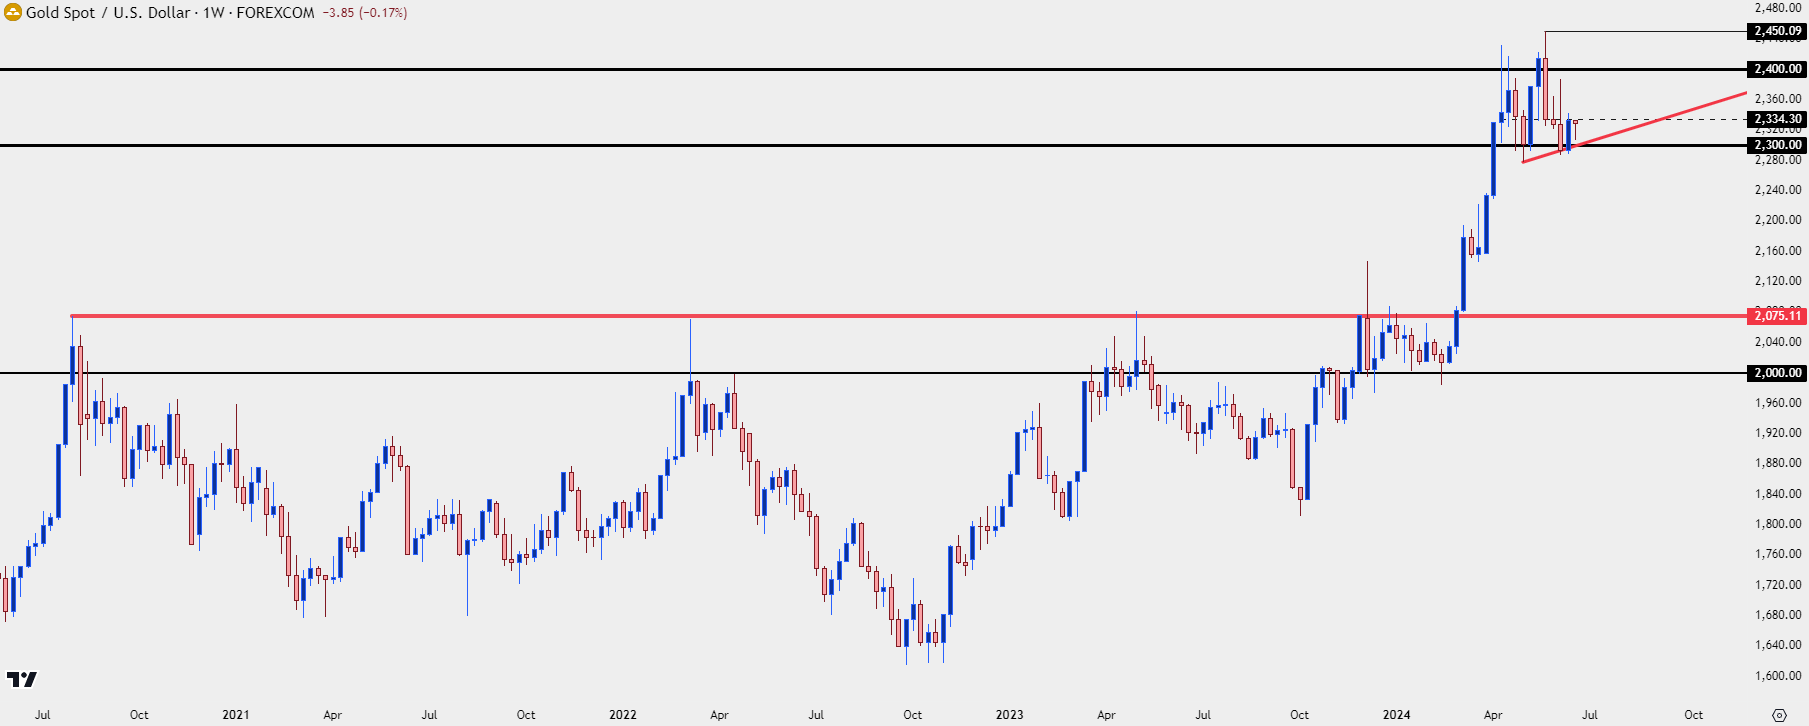 Chart prepared by James Stanley, Gold on Tradingview
Gold Shorter-Term
On a shorter-term basis, I think this is still bulls to lose. At this point there can even be an argument made for an ascending triangle, with horizontal resistance around the 2334-2336 levels to go along with higher-lows since the Friday NFP report in early-June.
There’s a couple of other spots of resistance overhead, such as the 2350-2354 zone, and the 2372-2378 zone on top of that. The 2400 level remains important, and then the all-time-high plots at 2450. The major psychological level of 2500 sticks out as a relevant price above that prior high.
XAU/USD (Gold) Daily Price Chart
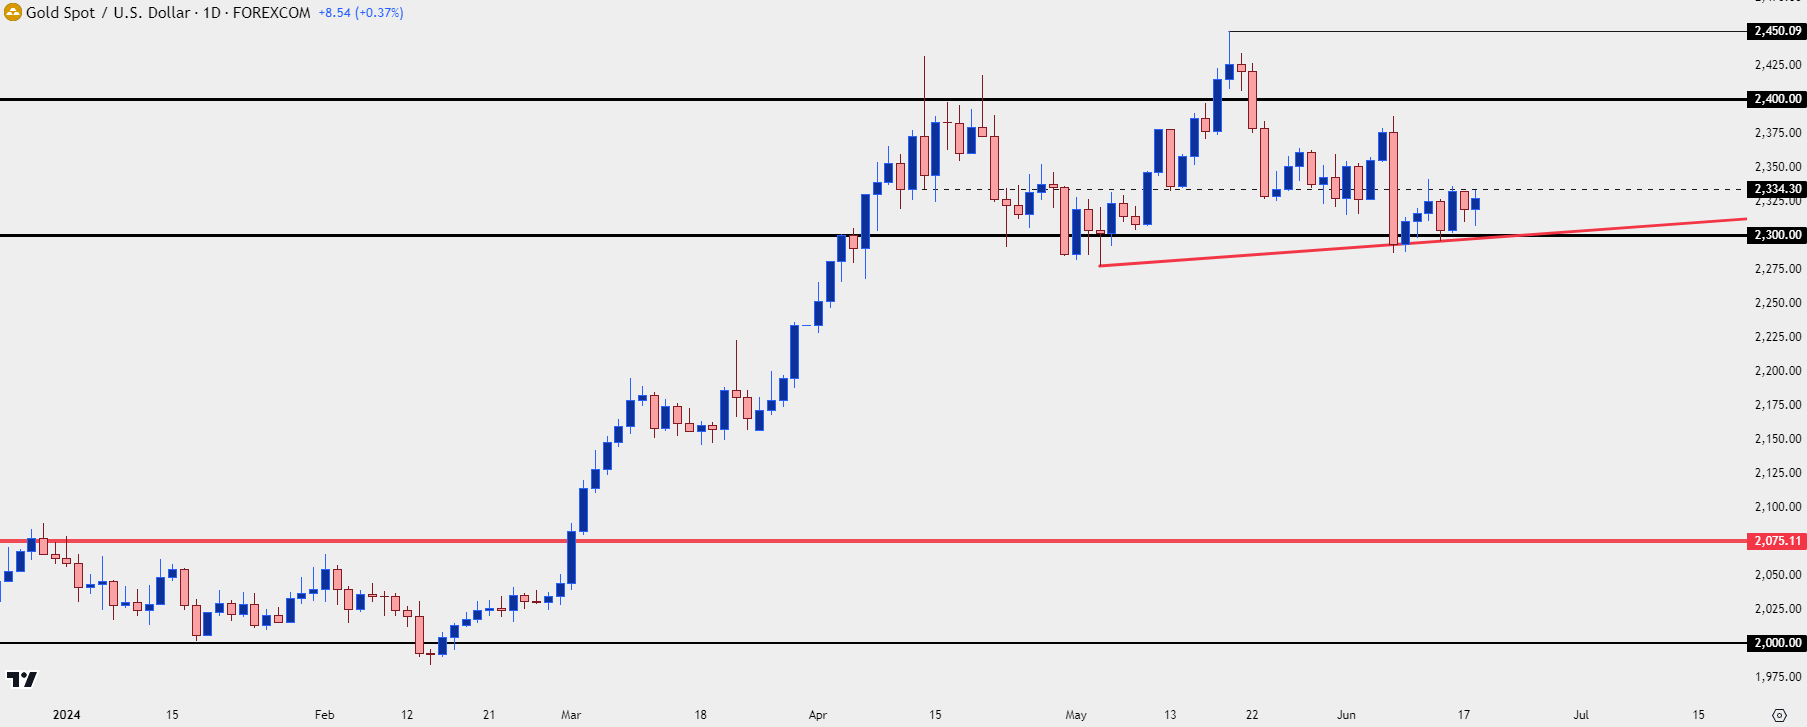 Chart prepared by James Stanley, Gold on Tradingview
--- written by James Stanley, Senior Strategist


