
US Dollar Talking Points:
- The US Dollar has continued its descent this week as DXY has begun re-test of a key spot on the chart around 103.50.
- USD weakness has shown prominently so far in November, following the gravestone doji on the daily chart from the FOMC rate decision on the first day of the month. This has pushed reversal moves in EUR/USD, GBP/USD and for a brief period, USD/JPY, although that remains more in question after a snap back move this week.
- I’ll be discussing these themes in-depth in the weekly webinar on Tuesday at 1PM ET. It’s free for all to register: Click here to register.
It’s so far been a November to remember for USD bears. The currency came into the month holding on to strength, following the 11-week burst of gains that began in late-summer. But, very similar to what had shown last year, a strong move that held into the Q4 open began to stall in the month of October. Bears started to take slight steps forward with lower-lows in October in both 2022 and 2023; and then November brought in a lower-than-expected CPI report that helped to drive fresh lows as the prior bullish trend pared back.
When this happened last year, it led to another three months of weakness in the DXY until, eventually, the currency spent much of the next six months digesting and consolidating. That consolidation took on the form of a falling wedge, and that was broken through in a big way in July, and that trend ran until September and started to stall in October; again, following a very similar scenario as last year.
US Dollar Daily Price Chart (indicative)
 Chart prepared by James Stanley; data derived from Tradingview
US Dollar Similarities and Differences
While there are certainly some similarities between the 2022 backdrop and what we’ve seen so far in 2023, there’s also a couple of important differences – and a couple of points of nuance that are worth exploring.
The similarities of course are clear: US Dollar strength, as driven by expectations around the Fed and perhaps more to the point – the divergence of expectations around the Fed relative to other major central banks – were a main driving theme of that USD strength. In both cases, USD strength held in a somewhat aggressive manner. As a case in point, daily RSI was in overbought territory on the USD on September 27th of both 2022 and 2023.
Both cases then led into chop and range in October, which was followed by the initial show of reversal in November – as pushed by lower-than-expected CPI. That led to a strong move in EUR/USD and Gold, along with a major lift to equities. All of which we’ve seen hold through this most recent iteration.
Those similarities still hold well with the comparison to last year and that’s all good and fine for hindsight – but what about for what’s on the horizon? Is USD weakness going to price-in like it had last year, as prices further pare back prior gains? Or will the analog diverge as there are some very key differences if we investigate the drivers behind each theme.
And, then there’s also the matter of context, as the bullish run that started to pullback last year had run, in large part, for 21 months before the October stall led into reversal. In 2023, that bullish trend in the USD was much less developed than what began to reverse last year.
And as the kicker, the item that really seemed to drive the USD reversal last year was rising rate expectations elsewhere, Europe in particular. With the Euro making up 57.6% of the DXY composition shifting rate expectations in Europe can be a very powerful thing for the Greenback. And the second largest constituent in DXY is USD/JPY, which is at a 13.6% clip. The USD reversal last year triggered an unwind scenario in USD/JPY and carry trades quickly closed for fear of a larger Dollar-reversal. That added even more force to the DXY sell-off.
Suffice it to say, the fundamental backdrop is quite a bit different this year. There’s scant expectation for any additional hikes out of Europe and in the US, even with FOMC officials saying that it’s too early to declare victory on inflation, markets have largely priced-out any expectation for additional hikes. There are growing fears of building recessionary forces in Europe, and with core inflation still at 4.2%, this leaves the ECB in a very tight spot; and without the prospect of higher rates that can make the Euro as a less attractive medium for taking on strength.
So, while there are some strong similarities to the backdrop last year and while there remains bearish potential in the USD as shown by that very similar scenario, there are some key differences to keep in mind and this could create deviations between the two setups. For the USD, the big question is whether EUR/USD can hold a bullish trend in a manner like what had appeared in Q4 of 2022. At that point, we had rising rate expectations around the ECB and that’s stark contrast to this year.
In the US Dollar, prices are already testing a key spot of support around the 103.50 level. There’s a lot going on here, as this was the yearly open price that came back into play to set a double top formation in July. That double top filled in – and price broke down – which led to the bullish reversal that initiated that 11-week streak of gains. Nearby at 103.46 is the 50% mark of that bullish move and there’s also a confluent 200 day moving average nearby.
US Dollar Daily Price Chart (indicative)
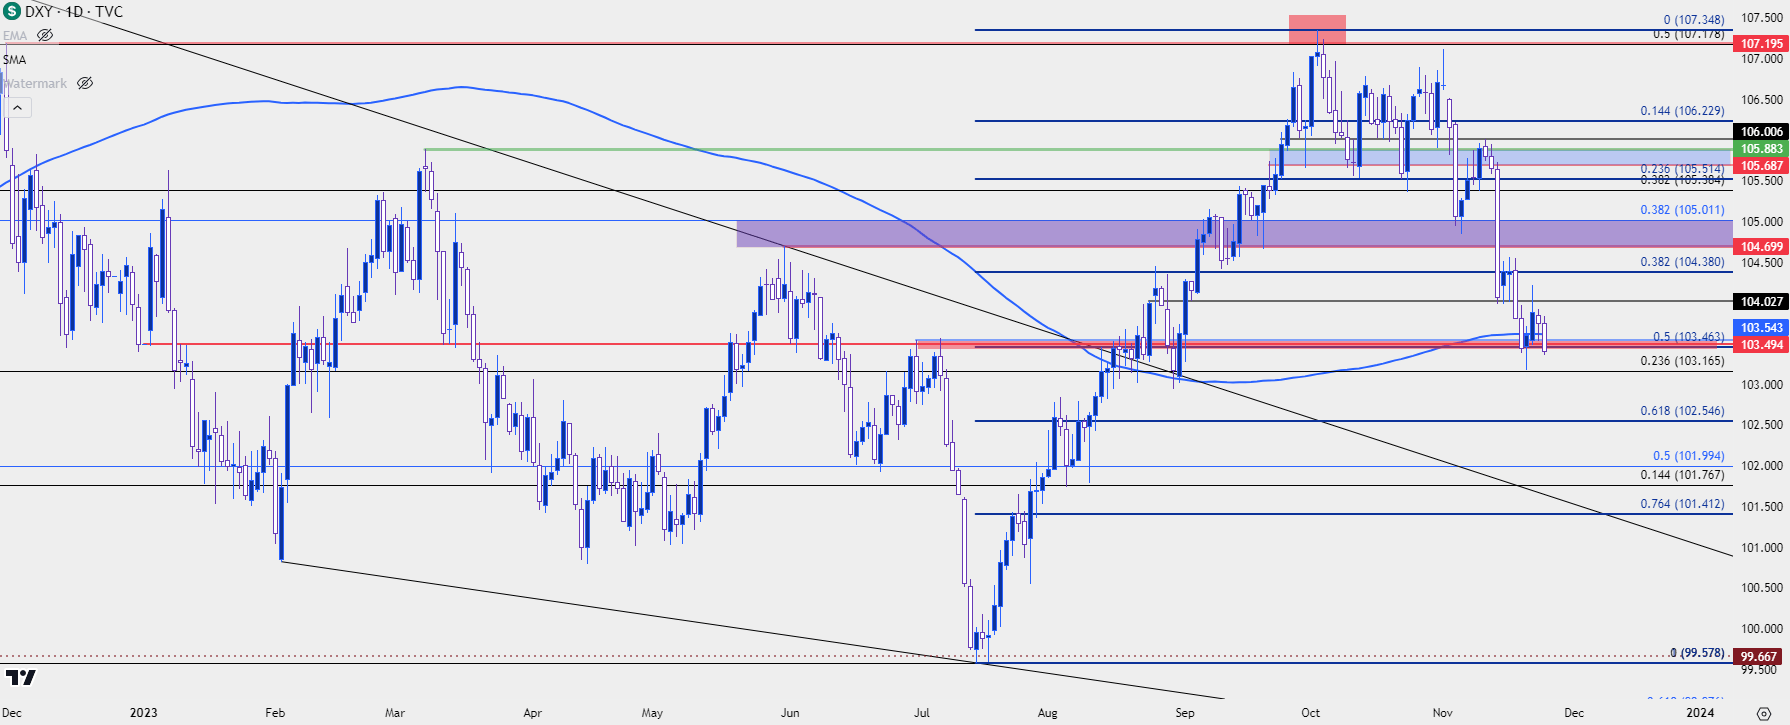 Chart prepared by James Stanley; data derived from Tradingview
EUR/USD
Given the outsized 57.6% of the Euro in the DXY quote, it can be difficult to imagine prolonged trends in either without at least some participation from the other. Sure enough, if we look at the USD breakdown last year that caught a strong push on November the 10th, it was coupled with a strong breakout in EUR/USD that pushed the pair back above the parity level.
And then when USD strength showed loudly this summer, the 11 consecutive weeks of gains in the DXY were matched with 11 consecutive weeks of losses in EUR/USD.
But – that’s around the time that 1.0500 came into play, and RSI on the daily chart was going into oversold territory to denote the consistency of the sell-off, but it also hinted that the move may have priced-in a little too aggressively as sellers were soon stalled at the 1.0500 psychological level. I started talking about this during the webinar on September 27th (the anniversary of overbought DXY on the daily).
That helped to substantiate support through October trade, allowing for the build of a bullish channel. Through most of last month each bullish test of highs was soon followed by a pullback, and this highlighted trepidation from bulls that could, potentially, work against a stronger pullback move.
But that’s shifted so far in November, as EUR/USD broke out again after the FOMC rate decision on November 1st. That was followed by a pullback with support showing around prior resistance, building a falling wedge formation along the way. And then when we got to CPI on November 14th, bulls were ready to pounce, and they’ve continued to drive higher-highs and higher-lows ever since.
The big question now is what happens at the next big figure, if bulls can hold the move long enough for it to come into play. The 1.1000 level lurks overhead, and this week has seen a resistance hold at a key spot comprised of two confluent Fibonacci levels, spanning from 1.0943-1.0960. I had highlighted this last Friday and it remains in-play a week later. But the big takeaway from this week has been the hold of higher low support from the pullback, keeping the door open for bulls to challenge the 1.1000 level.
EUR/USD Daily Price Chart
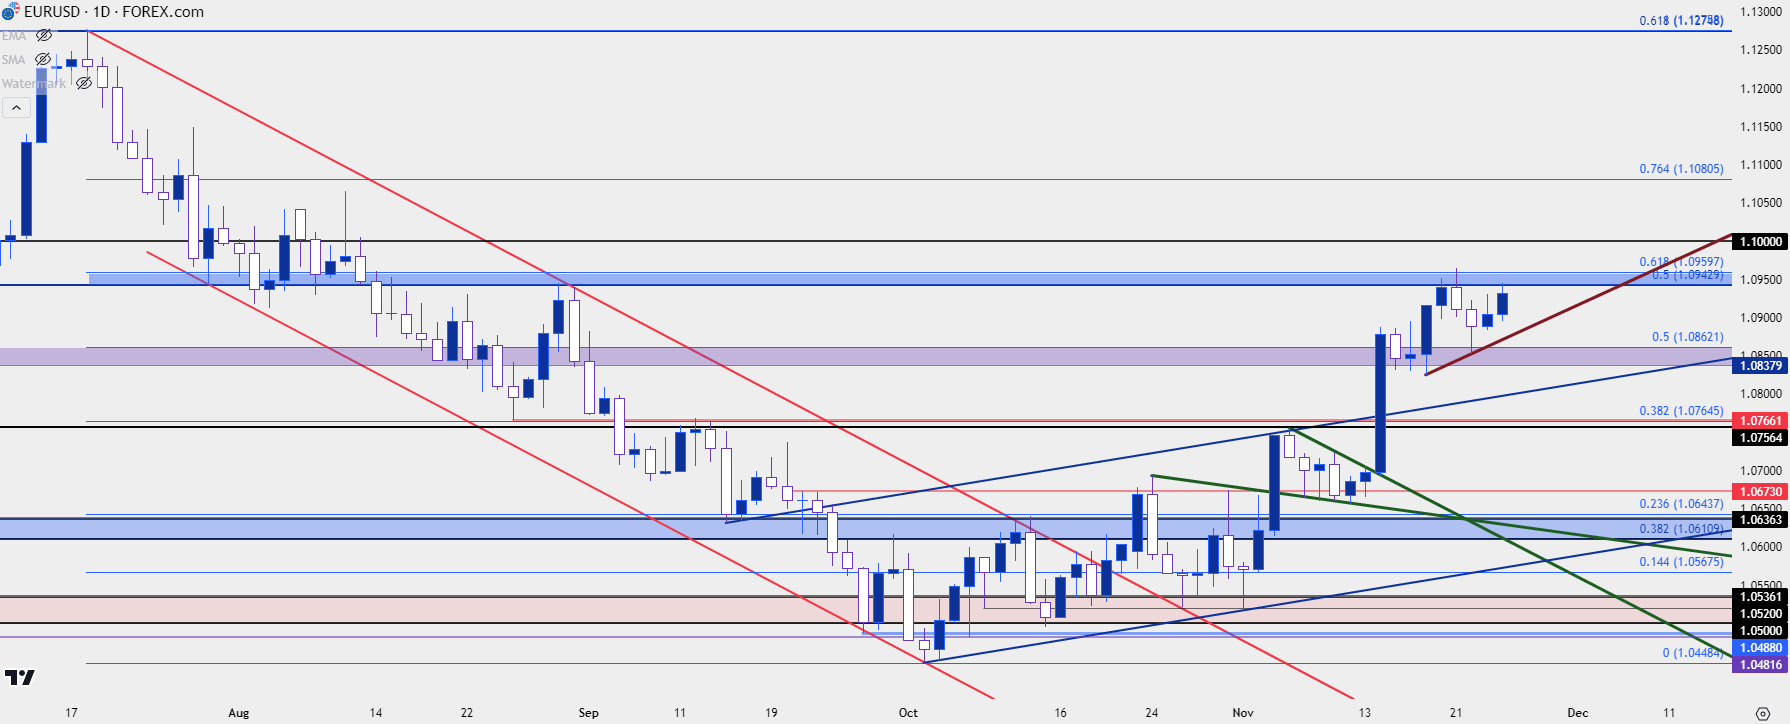 Chart prepared by James Stanley, EUR/USD on Tradingview
GBP/USD
Cable looks a little cleaner to me than EUR/USD above, considering broader USD themes. Last week I had highlighted another morning star formation that had built in GBP/USD after a rigid hold of the 1.2500 psychological level. The past week has been bulls trying to push resolution to that and it’s allowed for a continued breakout with GBP/USD now testing above a key resistance level at 1.2590.
What makes the backdrop appealing here is the consistency that’s been displayed so far with two morning star formations over the past two weeks. The swing-low for this week came in at 1.2467, so this can help to keep the door open to themes of bullish continuation. There’s support potential nearby as taken from a prior series of swings around the 1.2548 level. Below that, 1.2500 remains a key point of contention. And there’s even another level of note that could allow for a higher low at the Fibonacci level of 1.2460, which I had used last week to help set up the morning star formation. Below that is the 1.2447 swing low – and this would be the spot for bulls to defend to keep the topside trajectory alive for next week.
Breaking that support breaches the sequence of higher-highs and lows, and that would bring question to GBP/USD bullish themes and USD/DXY bearish themes.
GBP/USD Daily Price Chart
 Chart prepared by James Stanley, GBP/USD on Tradingview
USD/CAD
USD/CAD has pushed down to a fresh monthly low following a failed breakout attempt earlier in the month. To begin, we must start with the monthly chart to set the stage as USD/CAD was attempting to breakout of a long-term consolidation backdrop.
From the monthly chart below we can see a symmetrical wedge in-play as prices have coiled into a tighter and tighter range over the past three years. October saw bulls make a run at the highs, eventually finding resistance at a familiar spot – in the 1.3850 to 1.3900 zone – and that helped to stall the breakout. But as second run at those highs just ahead of the FOMC meeting on the first day of November similarly failed, and prices are now reversing more of that October move and making a fast run at a key resistance-turned-support level at 1.3575.
USD/CAD Monthly Price Chart
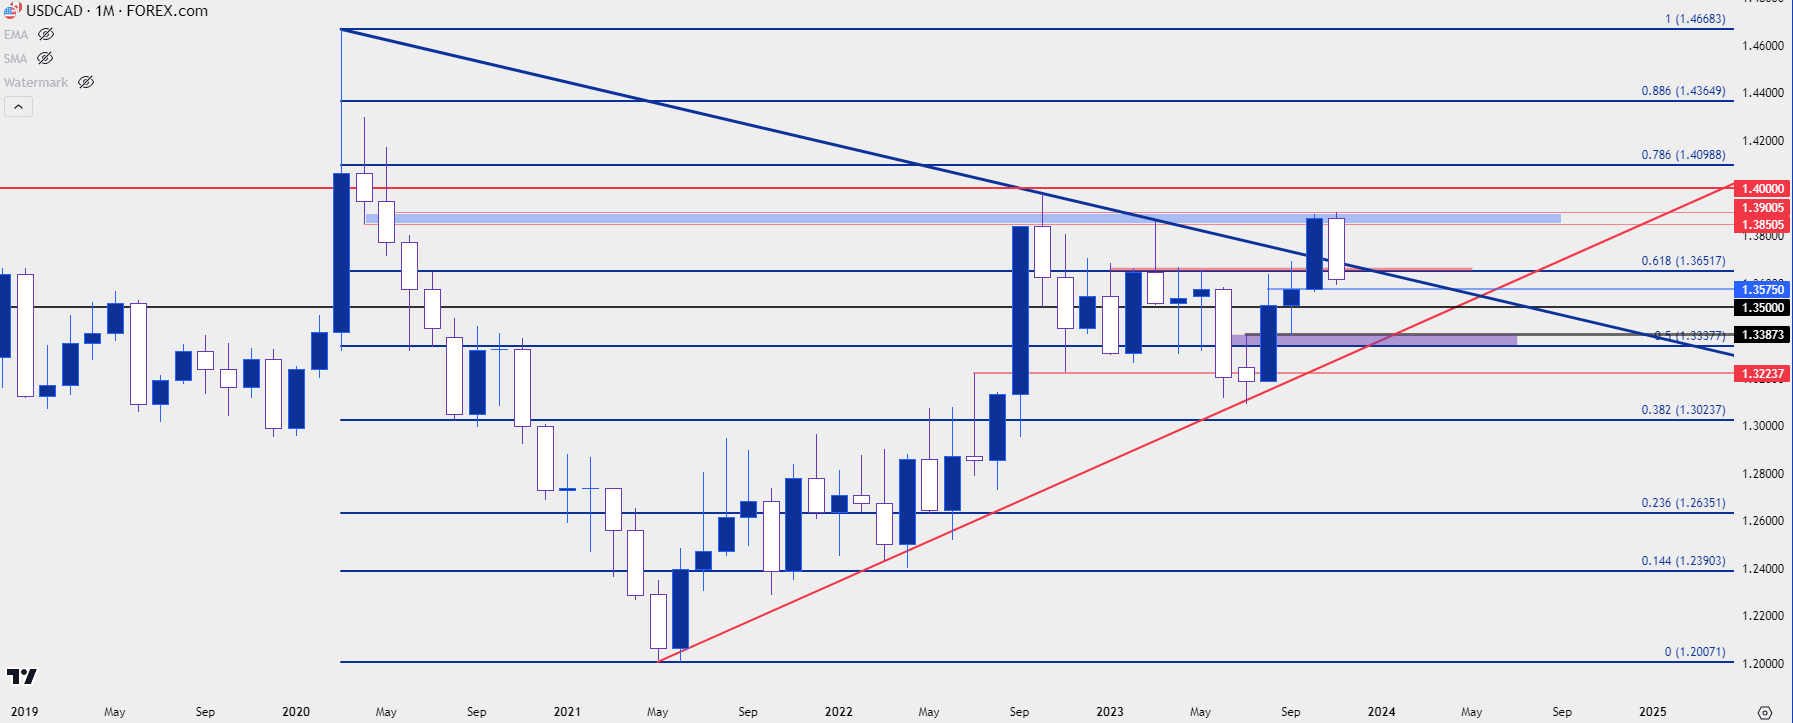 Chart prepared by James Stanley, USD/CAD on Tradingview
From the daily chart below, we can see another formation setting up after that breakout failed to continue, and this is a descending triangle formation with horizontal support at a key Fibonacci level of 1.3572 – and resistance as taken from the lower-highs that have posted over the past few weeks.
This puts sellers back in control as we have a breakdown to a fresh monthly low. There’s a nearby support level at 1.3575, and if that can lead to a hold with a bounce, that same 1.3652 Fibonacci level could soon come back into the picture as resistance potential for bearish continuation scenarios. For next supports below 1.3575, there’s also the 1.3500 level and then a wide zone from 1.3338-1.3388.
USD/CAD Daily Chart
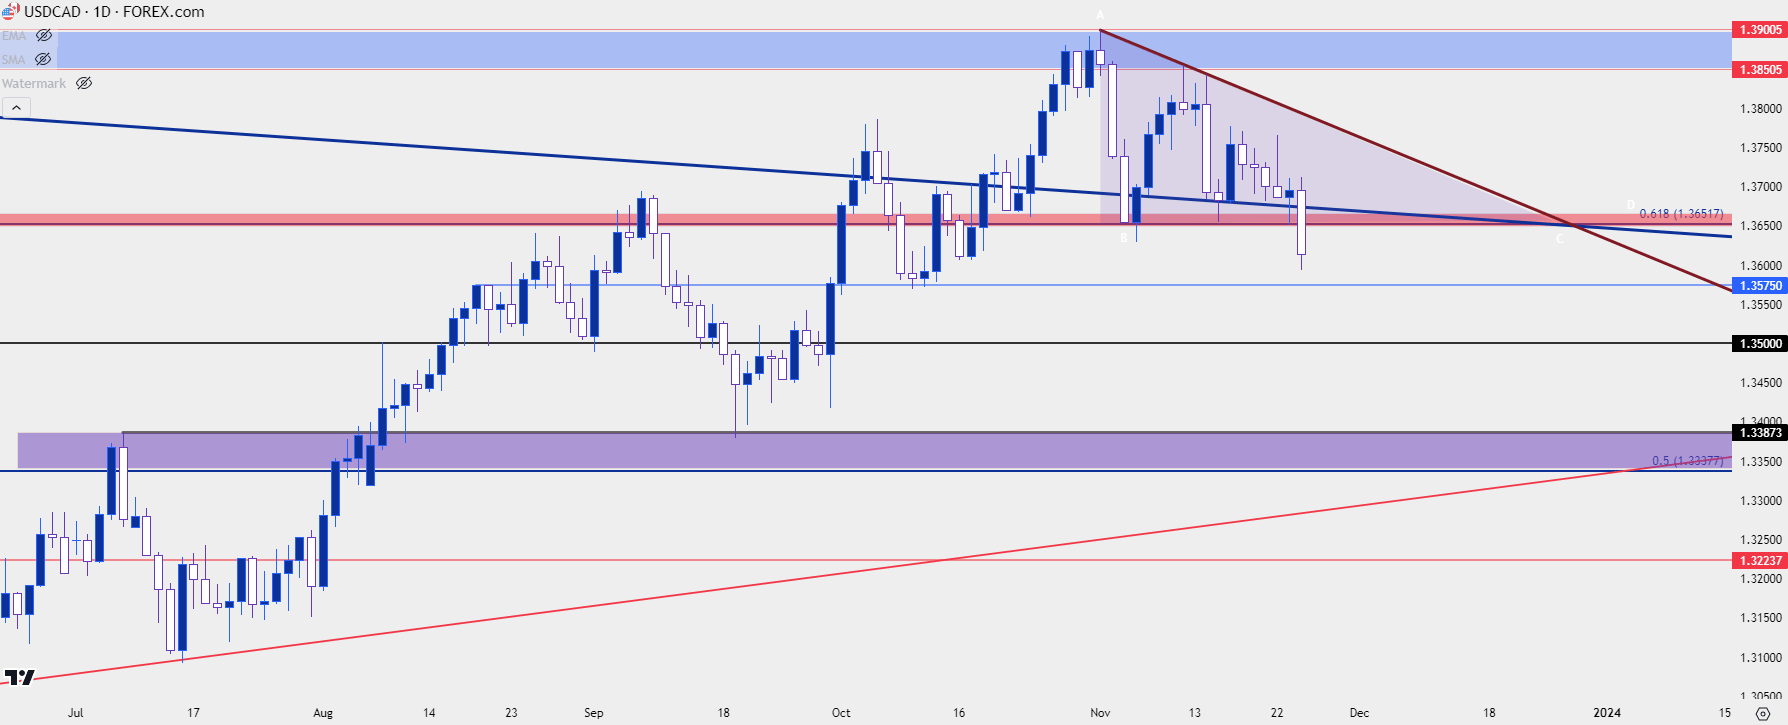 Chart prepared by James Stanley, USD/CAD on Tradingview
USD/JPY
I’ve saved the big one for last, and I’m considering USD/JPY as ‘the big one’ as this remains, in my opinion, one of the more contentious FX majors at the moment. I had written a lengthy article on the matter on Wednesday and much of that remains applicable today, so I’ll avoid re-hashing much of that argument.
The short version is there remains significant divergence between monetary policy in Japan and the US, but that’s nothing new as it drove a similar trend of strength in 2022 as it has in 2023. But last year when the USD was reversing in November, there was a strong pullback already showing in USD/JPY as carry trades quickly unwound.
We saw a similar initial reaction in USD/JPY last week as the pair started to show a series of lower-lows and highs after the CPI release on Tuesday. That held through early-week trade this week but support soon showed up at a familiar spot of 147.37 – and bulls have gone back to work since. At this stage price is pretty much where it was on Wednesday when I wrote on the topic and 150.00 remains as resistance potential; so there still could be some context for bears to work with.
USD/JPY Daily Price Chart
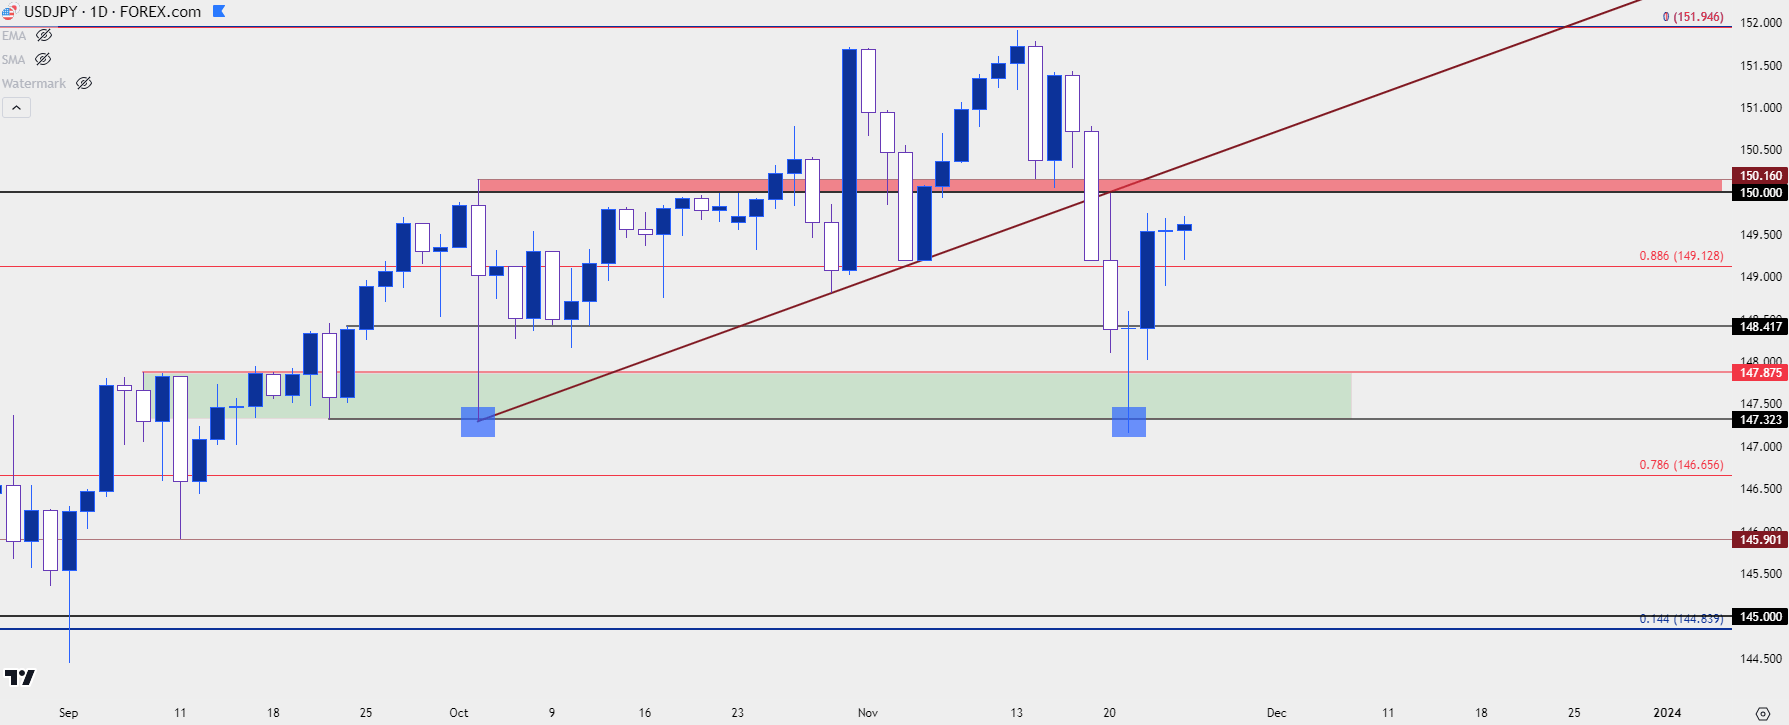 Chart prepared by James Stanley, USD/JPY on Tradingview
USD/JPY: Next Week is Key
So, again, getting back to the comparison to last year. USD/JPY was a big part of that USD reversal and behind that was the fear that the US Dollar had topped. If you’re long and holding in a carry trade designed to collect daily rollover payments – and the backdrop suddenly shifts and, all of the sudden, there’s the very real risk of principal losses as that trend has turned – that can be powerful motivation to close the trade and to get less long. That helps to explain the follow-through in the pair last November.
Carry trades can be powerful drivers of trend but they can lead to perhaps even more powerful reversals when the drivers behind that trend begin to shift, or at least come into question. Last year’s episode in USD/JPY saw 50% of the move taken out in just three months – and that trend had taken 21 months to build. And while the backdrops are different here the question remains for how long this trend in USD/JPY may continue to move higher and as soon as skepticism begins to creep in that there may challenges or hindrances to that continuation theme, this could lead to more unwind as traders and market participants are trying to look around the next corner.
In USD/JPY, last year’s CPI-fueled breakdown ran for 786 pips the week of that release. But the week after was followed by a bounce. This year’s episode has been more moderate as the sell-off during the week of CPI accounted for 232 pips. But, similarly, the breakdown weekly bar was followed by a bounce.
The question here is whether we see some element of defense from bears. The 150.00 level looms large and above that is another possible spot of resistance around 150.75-150.80.
USD/JPY Weekly Price Chart
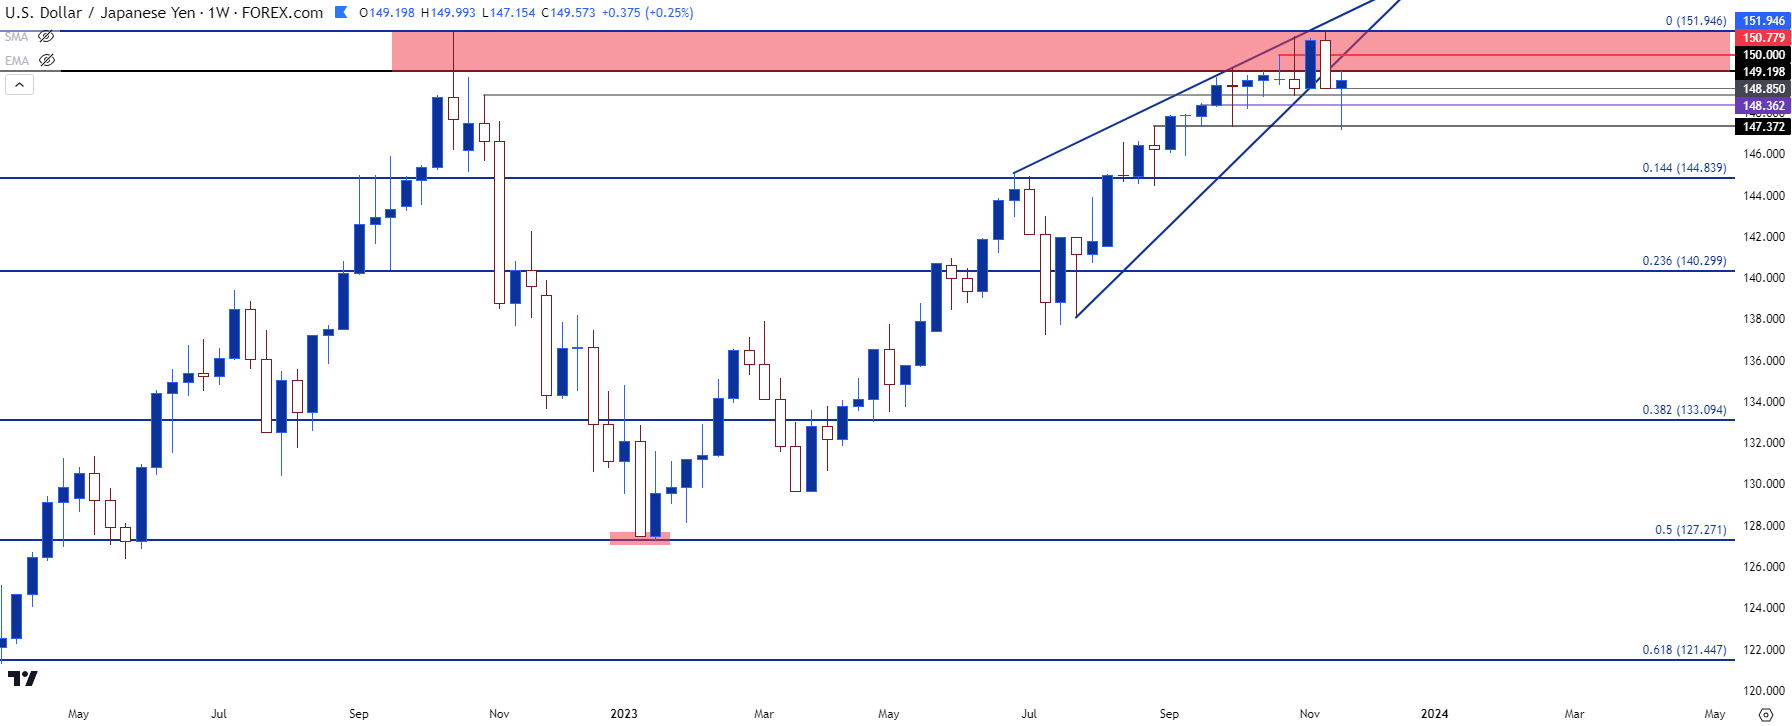 Chart prepared by James Stanley, USD/JPY on Tradingview
--- written by James Stanley, Senior Strategist


