
US Dollar Talking Points:
- It was the week of the 200-day moving average, as USD, EUR/USD and USD/CAD all had interactions with the indicator. I published an educational article on the topic in the prior week and this week shows multiple examples of support/resistance around the 200DMA.
- The next FOMC meeting is on January 30-31 and this means that Saturday marks the beginning of the blackout period, which FOMC members will refrain from offering commentary on monetary policy. This can leave currency markets a bit more vulnerable to headline flow as there’s no Fed-speak to buffer, but we’re also going to see earning season kick off which could generate macro-drive on its own.
- Next week’s economic calendar brings rate decisions out of Japan, Europe and Canada, and the week finishes with the Friday release of US PCE data, with Core PCE expected at 3%.
- I’ll be discussing these themes in-depth in the weekly webinar on Tuesday. It’s free for all to register: Click here to register.
The US Dollar continues to show strength in early-2024 trade which comes as stark contrast to the final two months of 2023. The FOMC rate decision on November 1st played a large role as a reversal began in DXY as sellers pushed for a 105.00 test. A bounce lasted for about a week, but the CPI report released on November 14th gave USD-bears another fresh push and that extended the sell-off until 102.55 came in to set support at the end of the month.
A hopeful bounce had developed in early-December. But, once again, an FOMC rate decision brought out the bears and another extension of that sell-off showed up after the December 13th Fed meeting.
As we’ve opened 2024 a different tone has started to show, both in the US Dollar and Treasury yields. 10-year yields continue to rise, and the US Dollar has showed a build of bullish structure. In the first week of January resistance developed at the 102.55 Fibonacci level, and that held for more than a week without sellers taking control. And then this week ushered in a breakout beyond that level, allowing for a fresh higher-high but that is at a massive spot on the chart.
The 103.50 level has some history as this was the 2023 yearly open. But it’s also the current home of the 200-day moving average, as well as the 50% mark of the bullish trend from last year. So, there’s quite a bit going on there and as of this writing, it’s held the high for four consecutive days in DXY without bulls able to do much beyond that level.
Resistance doesn’t necessarily mean that a down-trend or full-on reversal is near, however. The fact that buyers have been able to stretch up to a fresh high is, in and of itself, a positive for bulls. But as I discussed on the Wednesday webinar after the 200-day had come back into play, the big test for buyers is what happens on tests of lows, or possible higher-low support. And given that prior resistance hold at 102.55, there’s a very clear area where this can develop. If bulls come in before 102.55, that could be construed as a bit more biased on the bullish side. If the low penetrates that level, the opposite can be true. It could also keep the door open for a subsequent re-test of the 200-day moving average, particularly given all of the headline flow expected for next week.
US Dollar Daily Chart (indicative)
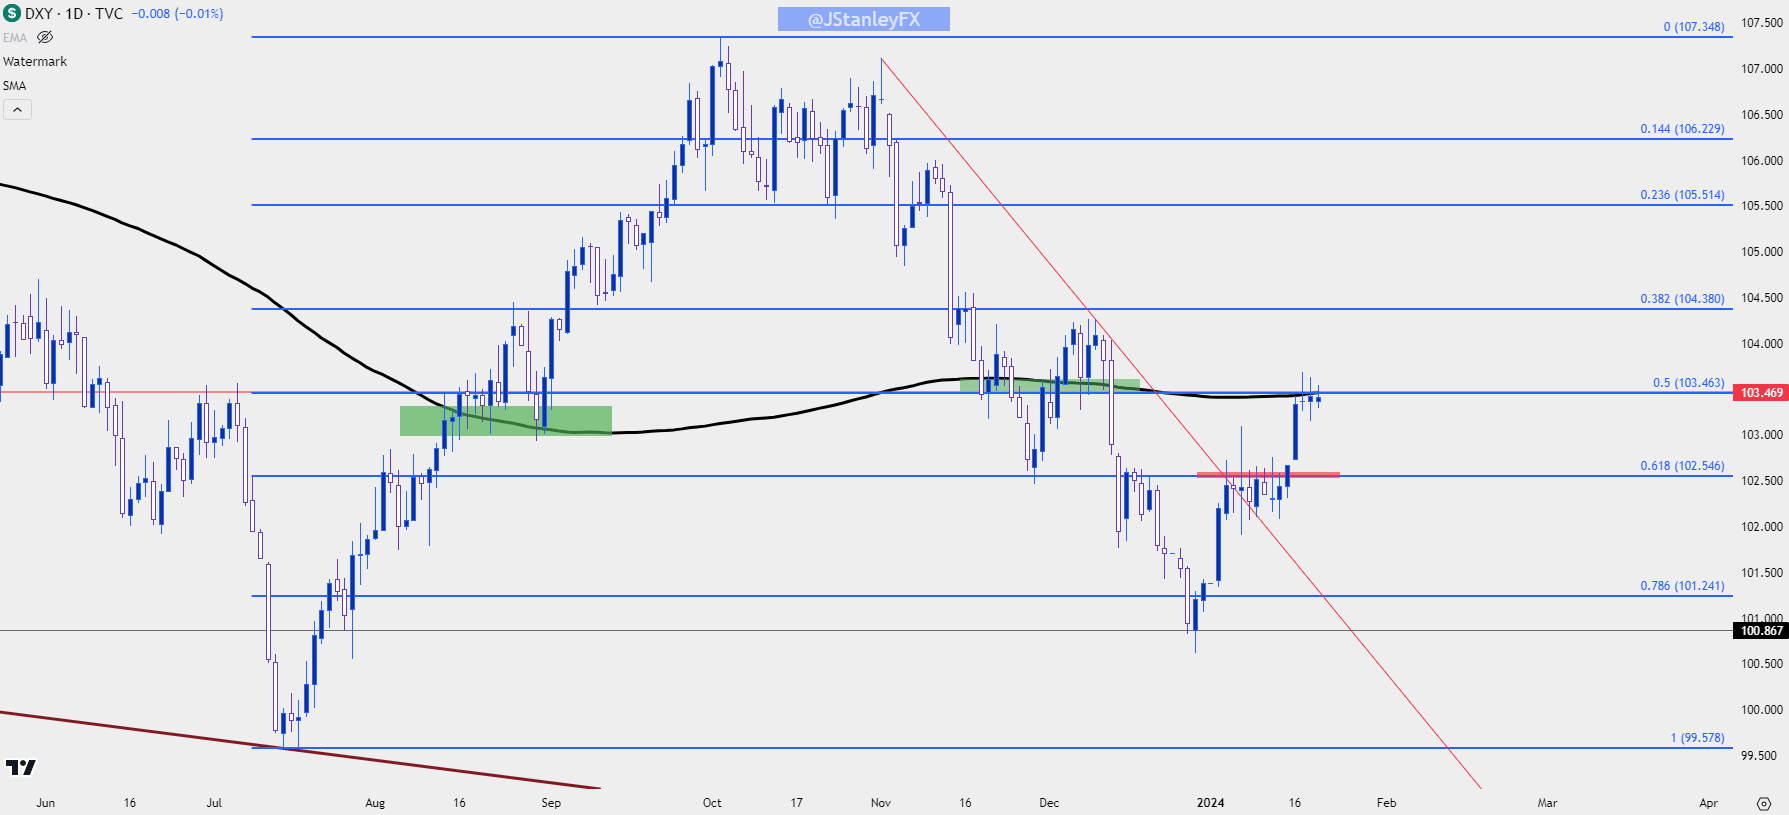 Chart prepared by James Stanley; data derived from Tradingview
EUR/USD
Is the Fed really going to cut rates before the ECB?
That remains a pertinent question here and to date, the ECB has been more evasive about possible rate cuts than what we’ve heard from the Fed. That was one of the large factors taken from FOMC meetings in November and December, when Powell sounded less cautious about a re-flare of inflation and, in some cases, sounded downright dovish. He had said that the conversation around rate cuts has started at the Fed but so far that’s not something that we’ve heard from Christine Lagarde.
We’ll hear more from the ECB next Thursday at their first rate decision of the year.
In EUR/USD, the pair had retained relative strength through last week with another re-test of the 1.1000 psychological level. That showed an initial pullback to the Fibonacci level at 1.0943, but that couldn’t hold either and prices broke down to the next zone of support that runs from the prior swing of 1.0838 up to the 1.0862 level, which is the 50% mark from the same Fibonacci study referenced above.
There’s also the 200-day moving average in the middle of that zone and that’s the level that’s caught the low for the past two days. Like the above, a show of support here doesn’t necessarily denote that a long-term bottom is in place. It does, however, put the onus on bulls to break a fresh high, or else bearish structure will continue to build.
EUR/USD Daily Chart
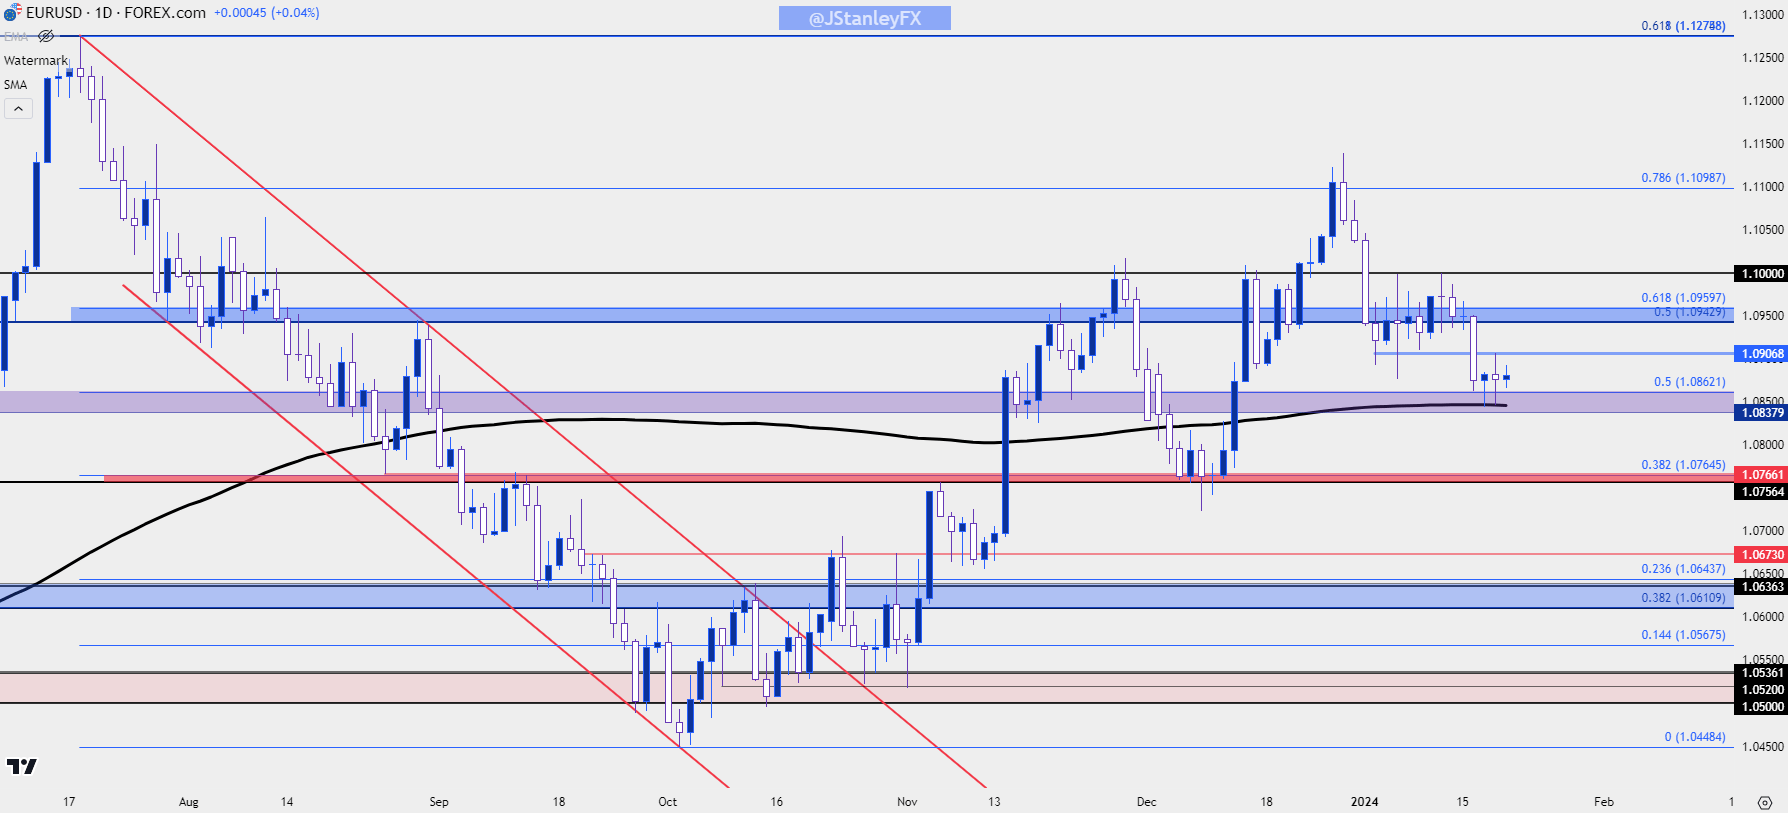 Chart prepared by James Stanley, EUR/USD on Tradingview
In the webinar I had talked about this, along with a couple of possible areas to look for lower-high resistance. The first of those areas, the more aggressive spot around the 1.0900 handle, already came into play after the first test of the 200DMA.
That then led to a second test of the 200DMA yesterday and, again, that’s held the lows. This has crafted a short-term double bottom formation, and this can keep the door open for a pullback move in early-next week price action.
There are approximately 60 pips from bottom to neckline, so if that short-term formation does fill-in, it could denote a possible move of 60 pips beyond the neckline, which would project to around 1.0966 and that could still suffice as a lower-high on longer-term charts or strategies.
EUR/USD Four-Hour Chart
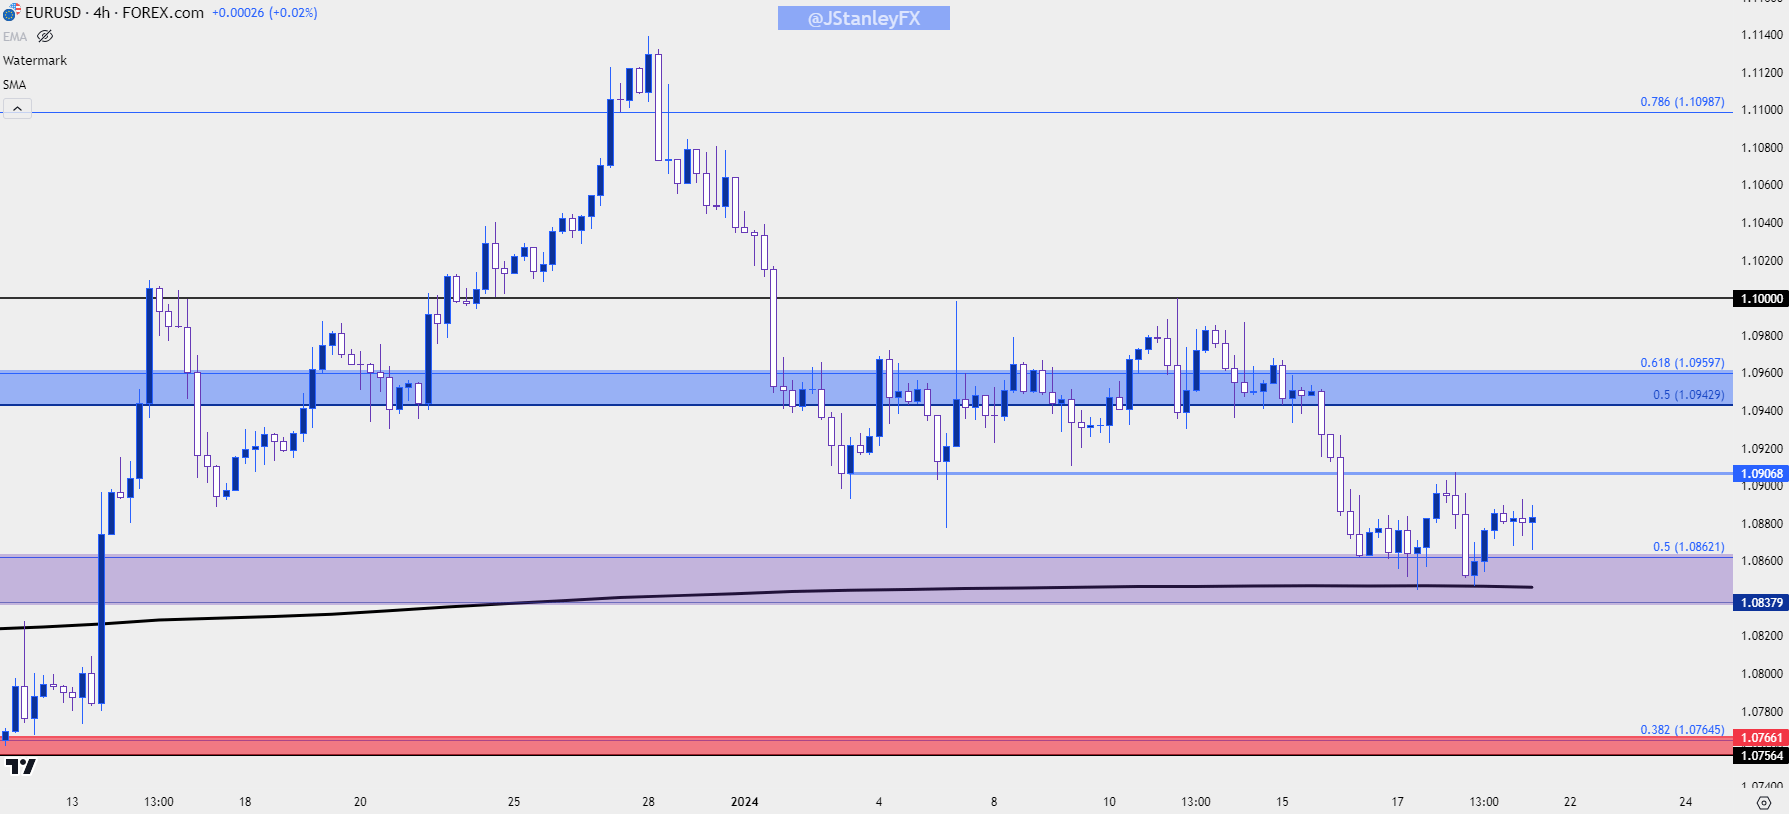 Chart prepared by James Stanley, EUR/USD on Tradingview
USD/JPY
There’s a Bank of Japan rate decision next week, and given the recent run in yields there’s been an aggressive move of Yen-weakness pricing in.
The big question is whether the BoJ mentions this, or if they bring up the topic of rate hikes which would likely be with mere hints or innuendo. The BoJ hasn’t touched policy as most other Central Banks have hiked rates over the past couple of years; but inflation has continued to fall over the past few months in Japan which removes some pressure from needing to do so in the near-term.
In response, JPY-pairs such as GBP/JPY have already set a fresh high. In USD/JPY, however, a major spot sits just overhead and testing above that price may be enough to get the verbal jawboning around policy. That’s the 150 spot in USD/JPY and it’s been a hindrance each of the past couple years, helping to elicit strong pullback moves in both cases.
Outside of Japanese monetary policy, USD/JPY continues to carry a USD-with-amplification type of theme, and this can be drawn back to those past two instances of 150 resistance. In 2022, the US Dollar was dropping dramatically as rate hike odds were jumping elsewhere. In 2023, the US Dollar didn’t quite put in the same aggression during its Q4 sell-off and one of the large reasons was lacking strength in counterparts, namely the Euro which makes up 57.6% of the DXY quote.
So if we do see a USD-reversal, the short-side of USD/JPY could fast become attractive again as there would be the prospect of carry unwind. That hasn’t been the case so far this year, however, so we’ve seen a combination of drive from the still-positive carry on the long side of the pair, probably combined with some bearish bets being taken off as the pair hasn’t broken down like it did in the prior instance.
I expect USD/JPY to continue to trade like an amplified US Dollar and that can work in both directions given the carry/unwind theme.
USD/JPY Weekly Price Chart
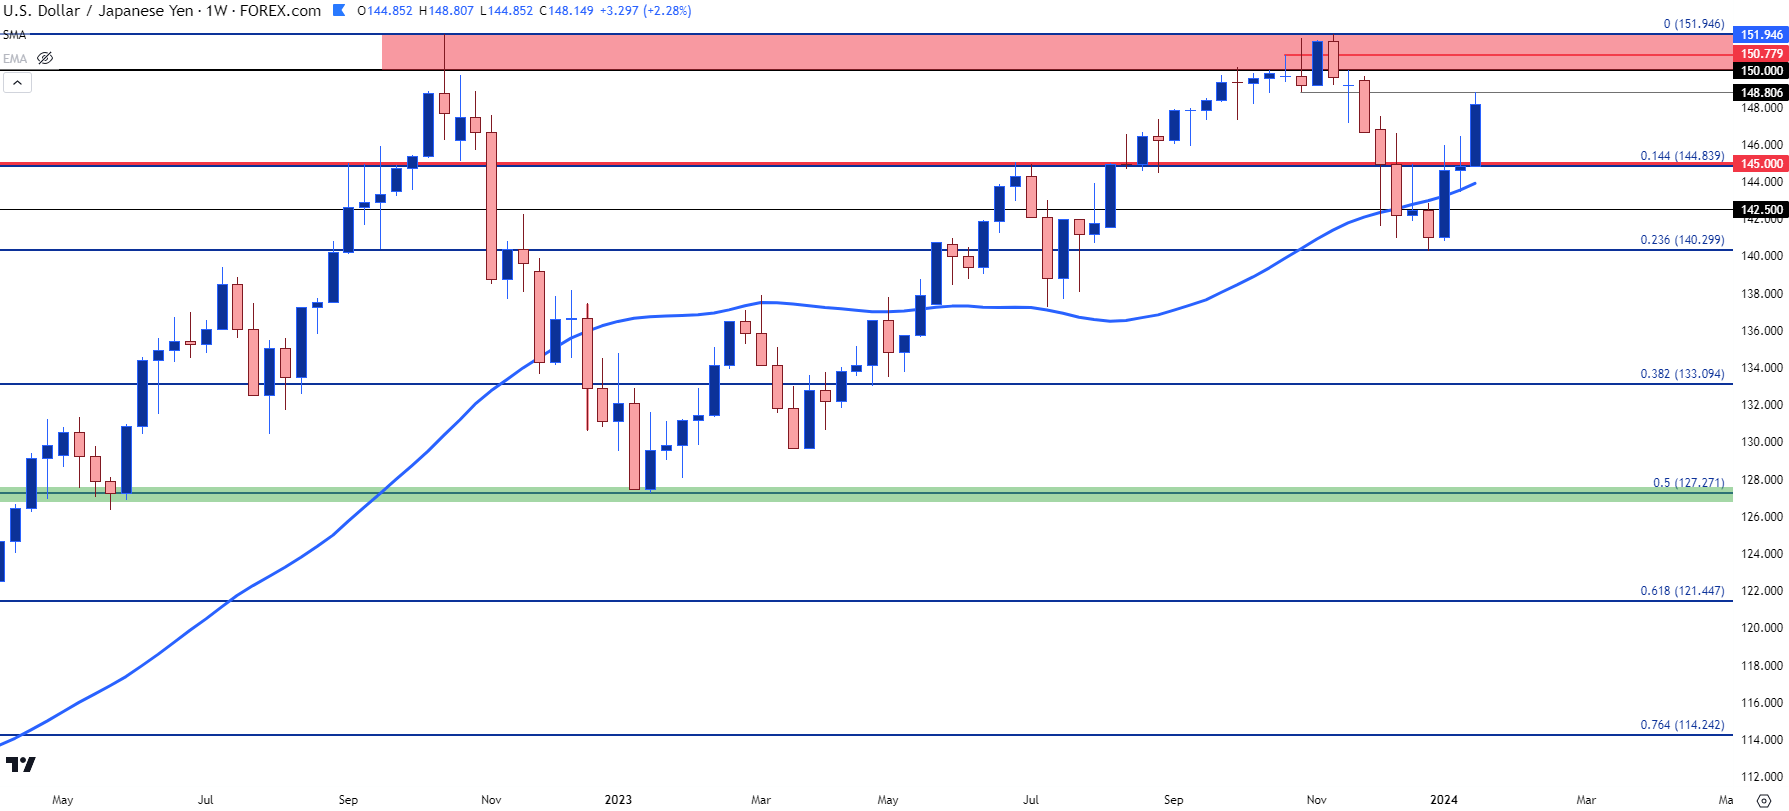 Chart prepared by James Stanley, USD/JPY on Tradingview
GBP/USD
Given inflation, the British Pound has been one of the stronger performing currencies of late. As a case in point we saw many major pairs flex to their 200-day moving averages this week; but that didn’t happen in GBP/USD as the pair continued to hold the same range that’s been in-place over the past month and change.
Resistance is a confluent zone of Fibonacci levels running from 1.2720-1.2758. Support has held around 1.2614, so it’s a rather tight range even on the daily chart.
This relative strength could make GBP/USD another enticing pair for situations of USD-weakness. For traders that are expecting a deeper DXY pullback from the 200-day, the topside of GBP/USD could be of interest as price is nearing another re-test of that confluent resistance zone.
GBP/USD Daily Price Chart
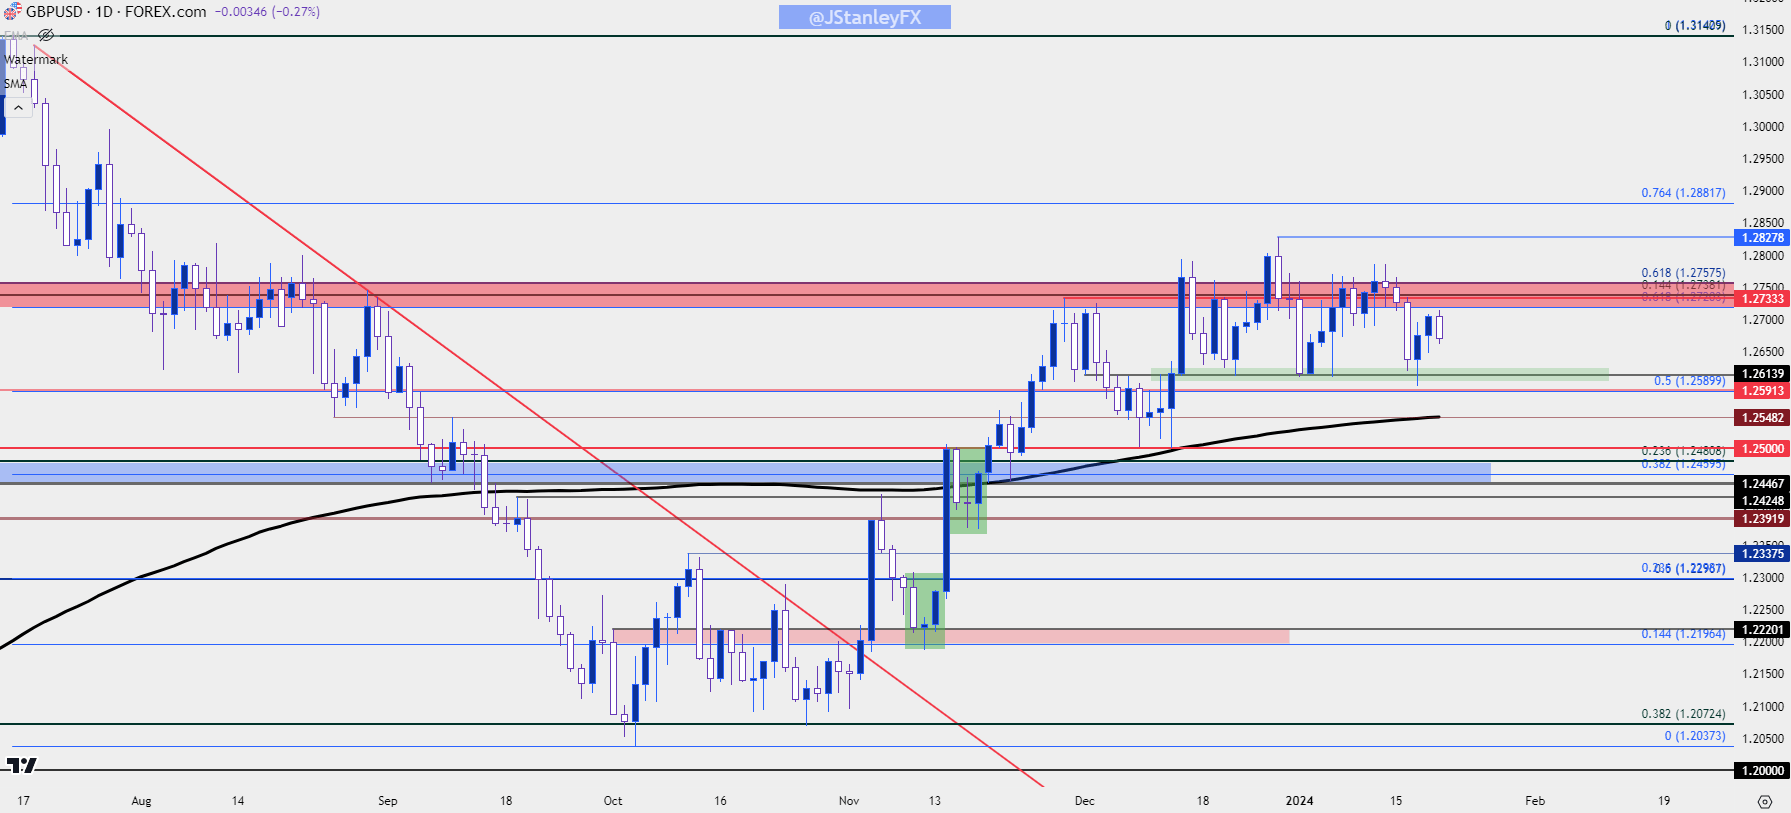 Chart prepared by James Stanley, GBP/USD on Tradingview
USD/CAD
USD/CAD has shown a rather clean move with the Fibonacci retracement produced by the November-December sell-off. The 50% mark from that setup held the highs on Wednesday and price has since pulled back for a support test of the 38.2% retracement. There’s also the 200-day moving average that’s been in-play and the way that today’s daily bar finishes could be of interest.
If buyers can push the daily close back-above the 200-day, which I currently have plotted at 1.3480, that could be a big sign of support from buyers after a relatively brief pullback. If bulls can’t hold the lows at that spot, there’s another area of support a little lower, around the prior range spanning from 1.3338 up to 1.3387.
USD/CAD Daily Price Chart
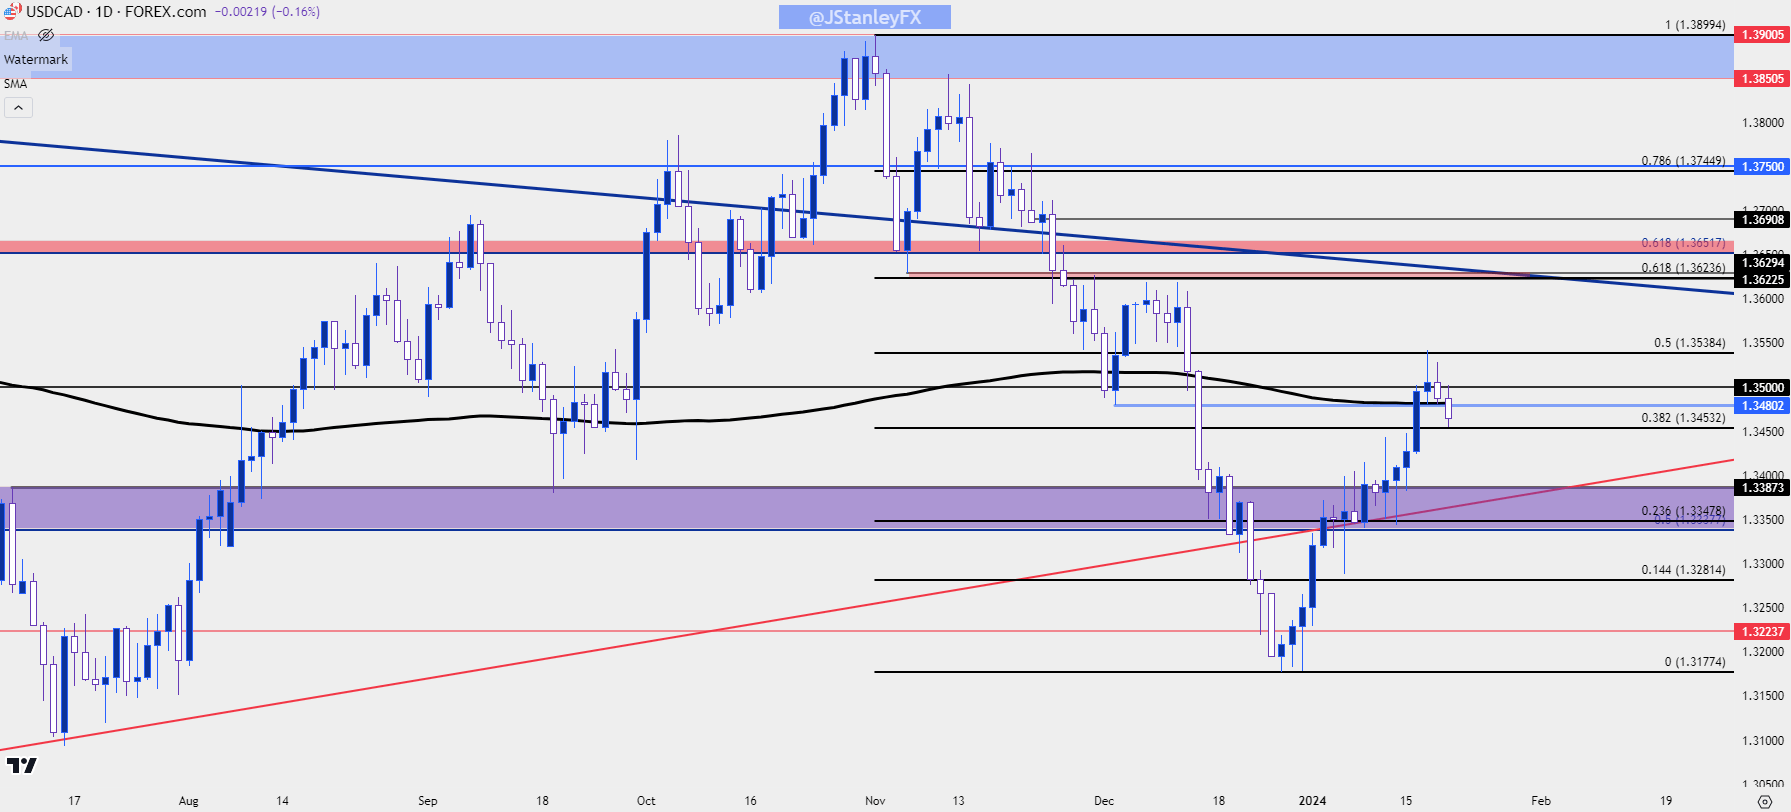 Chart prepared by James Stanley, USD/CAD on Tradingview
Gold
Gold bears had an open door to push a deeper pullback this week and they failed to test below the $2k psychological level. That remains a major price and there hasn’t yet been a 2024 trade below that level for spot XAU/USD. On a bigger-picture scale, Gold remains very near the multi-year resistance that’s defined the top-end of the three-year range.
And given the trepidation around that $2k level, there’s been the build of a falling wedge formation. These are often approached with aim of bullish breakout and the topside of the formation is currently confluent with the $2,050 level. If that formation does yield to breakout, it doesn’t necessarily denote fresh highs as there would be a couple of other areas of resistance for bulls to confront, such as the $2,060 level that held the highs the prior week; or the $2,075 or $2,082 levels.
I remain of the mind that the strong bullish trend above $2k will wait until after the Fed formally flips into dovish policy. If Core PCE prints at the expected 3% next week that could entail a higher probability of an earlier shift as there would be even more progress on inflation. But realistically, I think we’re looking to the second-half of the year for rate cuts to begin and that would seem to be the main motivator for bigger-picture trends in Gold.
Gold Daily Price Chart
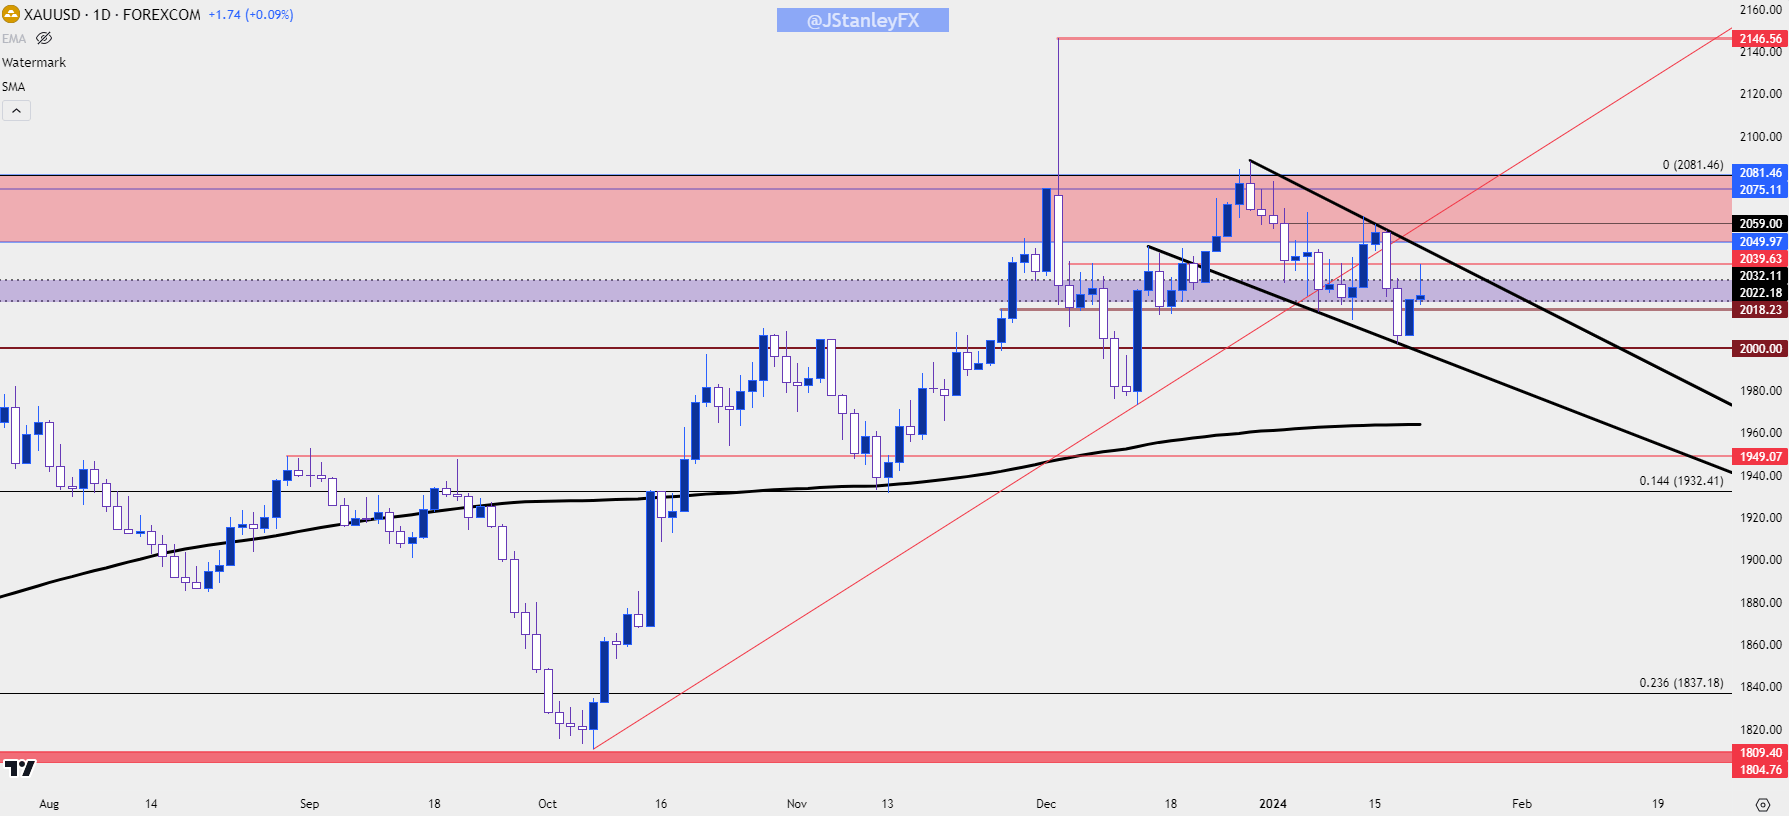 Chart prepared by James Stanley, Gold on Tradingview
--- written by James Stanley, Senior Strategist


