US Dollar Technical Analysis:
- The US Dollar remains in the same mean-reverting state that’s been in-play all year, with prices snapping back further from the trendline resistance that held the highs coming into June trade.
- The question now is whether bulls will take a stand as price has moved down for a test of the 102 level in DXY, with another key item of support at the 101 level.
- I’ll be discussing these themes in-depth in the weekly webinar on Tuesday at 1PM ET. It’s free for all to register: Click here to register.
It was a big week for US markets and the takeaway at this point has been a pronounced move of USD weakness. While the currency spent a couple of weeks bristling for a breakout at a trendline, a pullback that started last week got another jolt this week, with prices sinking down to test the 103 handle after FOMC, with another aggressive push from bears the morning after following the ECB rate decision.
On Friday, DXY moved down to 102 which is a key level in the USD as this is the 50% mark of the 2021-2022 Fibonacci retracement and, perhaps more importantly, this was a spot of prior resistance that was in-play just ahead of the Dollar’s breakout last month.
At this point, bulls have failed to continue the breakout but they’re not completely out of the equation yet, as support at 101 looms large after helping to hold the lows twice already in 2023 trade.
For next week, the focus on the USD shiftsback to Fed-speak along with an appearance from Jerome Powell on Capitol Hill for the Fed’s twice-annual Humphrey Hawkins testimony. This takes place over two days on Wednesday and Thursday and generally it’s the first day that tends to produce the larger reaction. Powell will release a statement of prepared remarks beforehand and this would be ample opportunity for the Fed Chair to opine after witnessing the market reaction to this week’s events. After that, he’ll be in the firing line for questions from Congress, from the House Financial Services Committee and the Senate Finance Committee.
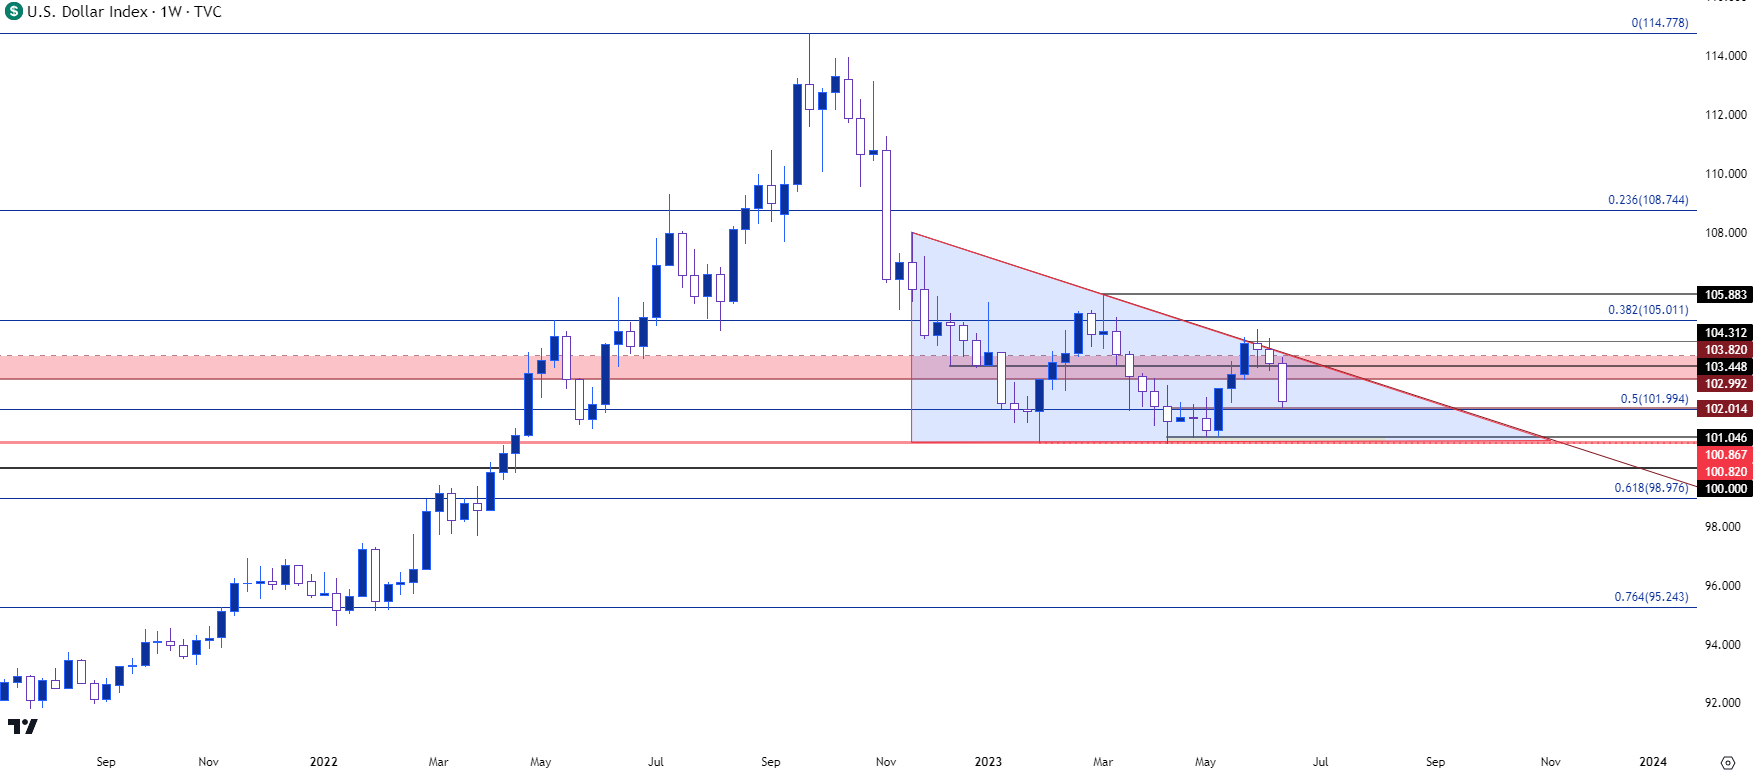
Regarding technical structure: That support around the 101 handle remains key as this was the point that helped to produce bounces in February and then again in April. This helped to build a double bottom formation which, if that support holds, remains a possibility. It would require a breach above the 105.88 level to trigger the formation; but the bearish trendline that held the highs through the June open remains an item of contention.
That bearish trendline also helps to establish a descending triangle formation, which is usually approached in the opposite manner of the double bottom formation. I looked into this earlier in the week and it remains of interest as we move towards the weekly close. Descending triangles are built with horizontal support and lower-high resistance, both of which exist in DXY from the below weekly chart. But, for that formation to trigger, there would need to be a breach of support which would also nullify the double bottom formation.
So, that 100.87-101.00 area on DXY is very key for next week.
US Dollar - DXY Weekly Price Chart (indicative only, not available on Forex.com platforms)
 Chart prepared by James Stanley; data derived from Tradingview
USD Shorter-Term
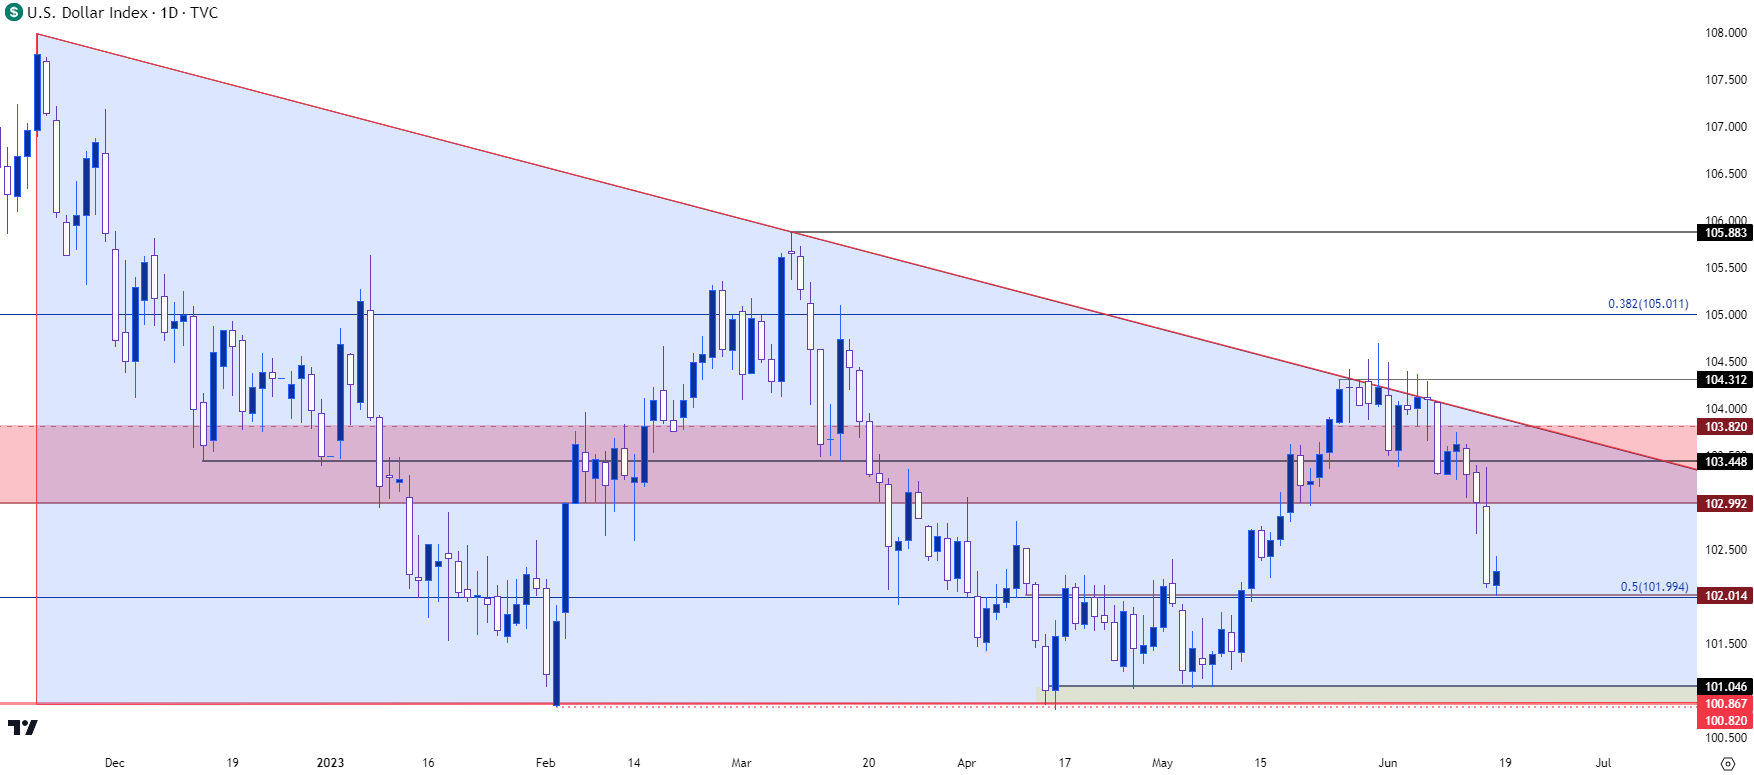
From the daily chart we’re still in consolidation as 2023 price action has largely been mean-reverting thus far. The 102 level is key for shorter-term approaches as this was a spot of prior resistance ahead of the breakout and now bulls are being tested after the pullback.
A show of support at 102 on Friday could be an encouraging first step for bulls to make their way back following this week’s sell-off, but more work would be required for buyers to take-control. Namely, re-taking the 103 level that held the lows at the end of Wednesday trade, after which resistance shows at 103.45 before the trendline comes back into the picture.
US Dollar - DXY Daily Price Chart (indicative only, not available on Forex.com platforms)
 Chart prepared by James Stanley; data derived from Tradingview
Can EUR/USD Bulls Take-Out 1.1000, 1.1100
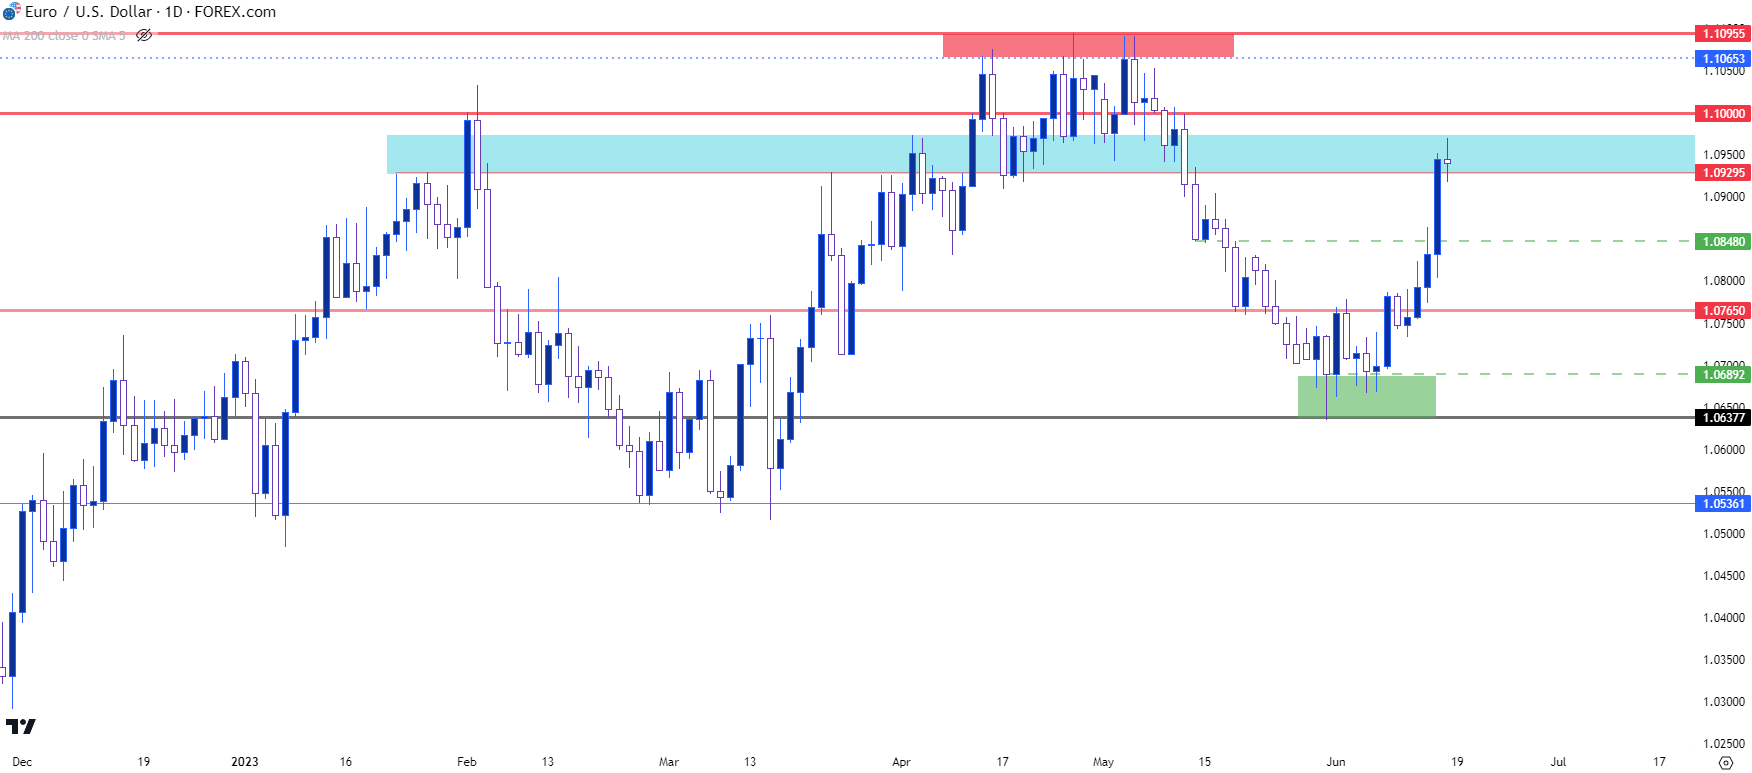
In a somewhat related matter, EUR/USD has pushed up to that resistance that I had looked at earlier this week at 1.0943 and it has so far helped to hold the highs into the end of the week. But this week was a massive showing from EUR/USD bulls and they have an open door to re-test the 1.1000 handle, which could have some impact on the USD as the Euro is 57.6% of the DXY quote.
The bigger question is whether that trend can run and produce a possible breakout, which will likely have some bearing on the matter of support in the US Dollar and DXY.
In EUR/USD, those next items of resistance are the 1.1000 psychological level followed by the 1.1096 swing high which currently marks the yearly high in the pair. The 1.1000 level has been in-play already so a test above that appears possible given proximity; but the bigger question is whether bulls come in to support the pair above that level, with focus on the 31 pip range from 1.1065-1.1096 as a significant test for EUR/USD bulls. If buyers can punch through that, then the USD may be vulnerable to downside breaks with the descending triangle formation, which would bring the 100 level back into the picture.
EUR/USD Daily Price Chart
 Chart prepared by James Stanley, EUR/USD on Tradingview
--- written by James Stanley, Senior Strategist


