US Dollar Index Technical Forecast: DXY Weekly Trade Levels
- US Dollar snaps two-week losing streak- rallies more than 1.2% off yearly low
- USD threat for topside exhaustion into former support- Fed rate decision on tap
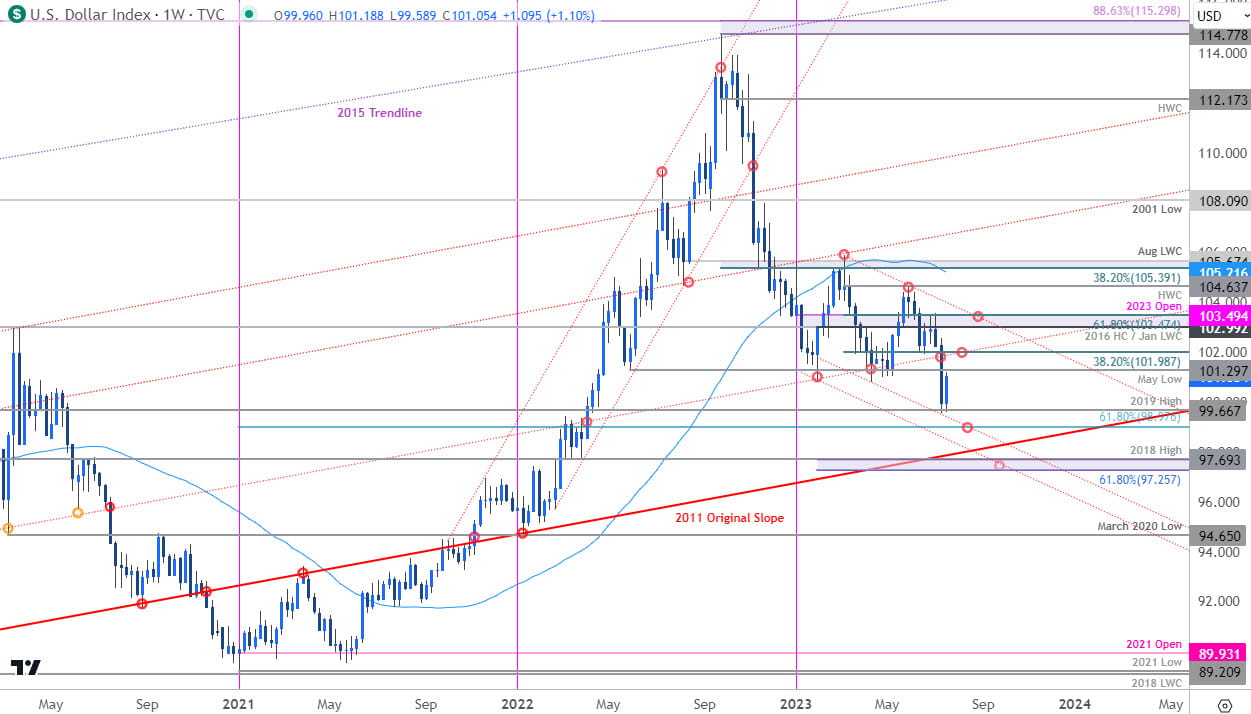
- DXY resistance 101.30, 102, 103.00/49 (key)– support 99.66, 98.98, 97.25/69
The US Dollar rallied more than 1.1% this week with the DXY poised to snap a two-week losing streak that took the index to fresh yearly lows. While the recovery may have further upside potential, a break of the yearly opening-range and a massive multi-month consolidation pattern remains central focus, and the recovery may be vulnerable heading into major event risk next week. These are the updated targets and invalidation levels that matter on the DXY weekly technical chart.
Review my latest Weekly Strategy Webinar for an in-depth breakdown of this USD setup and more. Join live on Monday’s at 8:30am EST.
US Dollar Index Price Chart – DXY Weekly

Chart Prepared by Michael Boutros, Sr. Technical Strategist; DXY on TradingView
Technical Outlook: In last month’s US Dollar Index Technical Forecast we noted that, “Heading into Q3, the focus is on a breakout of this consolidation formation just above broader uptrend support.” DXY plunged lower just two-weeks later with the index marking the largest weekly loss since November. The breakdown halted at the 2019 highs last week (~99.66) with price poised to snap a two-week losing streak on Friday.
A break of the consolidation pattern keeps the risk weighted to the downside while below former trend support / the 38.2% retracement of the yearly-range around the 102-handle. Initial resistance is eyed at the May low (101.30) with broader bearish invalidation steady at 103.00/49- a region defined by the 2016 high-close, the 2020 high, the January low-week close, the 61.8% Fibonacci retracement and the objective yearly open. A breach / close above this key threshold would be needed to suggest a larger trend reversal is underway.
A break below this support level exposes subsequent objectives at the 61.8% retracement of the 2021 advance at 98.98 and key support at the 61.8% extension of the 2022 decline / 2018 high at 97.25/69- both areas of interest for possible downside exhaustion / price inflection IF reached.
Bottom line: The US Dollar is getting a reprieve from the 4.8% plunge off the late-May highs and while further upside potential remains in the near-term, the broader outlook remains heavy for now. From a trading standpoint, rallies should be capped by the 102-handle IF the index is heading lower – look for a larger reaction on stretch towards 99 for guidance IF reached.
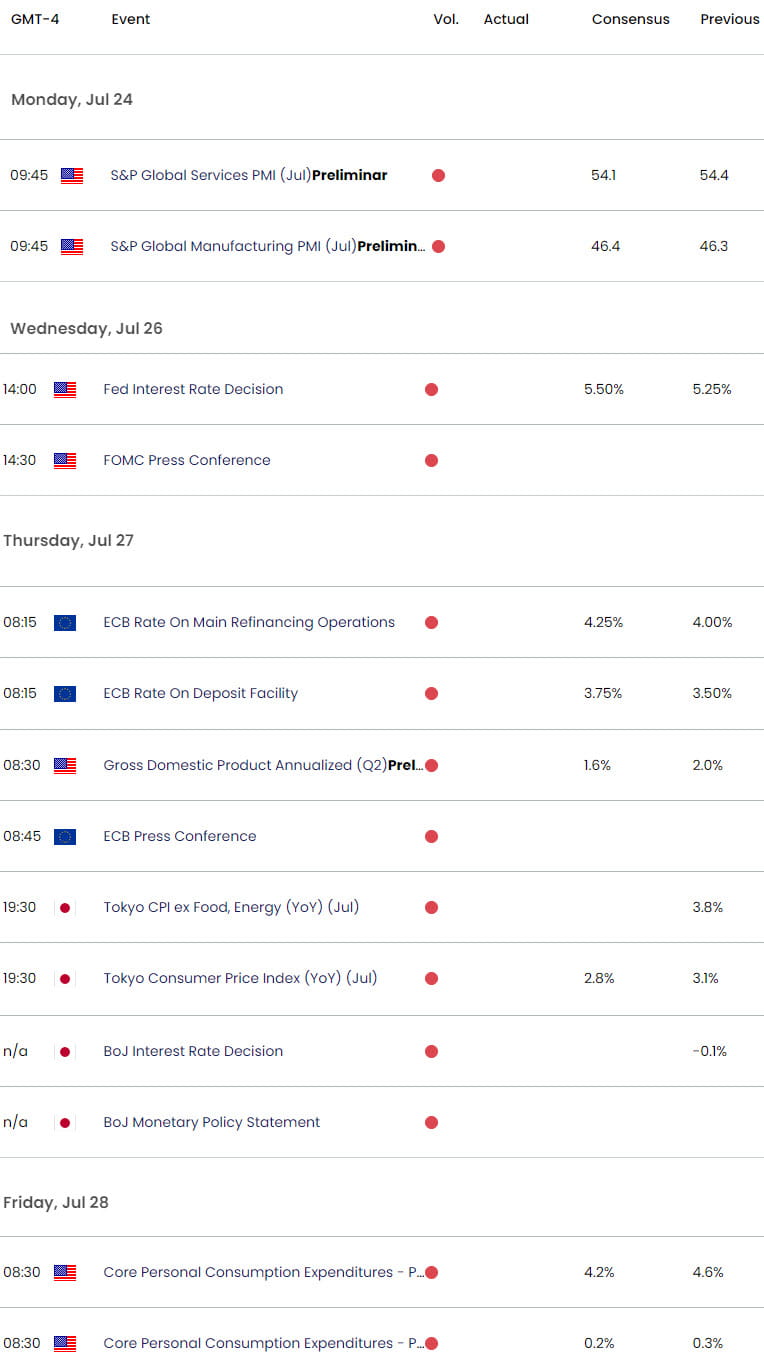
Keep in mind that next week’s economic docket is loaded with the FOMC, ECB and BoJ interest rate decisions on tap- stay nimble into the releases. I’ll publish an updated US Dollar Short-term Outlook once we get further clarity on the near-term DXY technical trade levels.
Key Economic Data Releases

Economic Calendar - latest economic developments and upcoming event risk.
Active Weekly Technical Charts
- Crude Oil (WTI)
- Gold (XAU/USD)
- Canadian Dollar (USD/CAD)
- Euro (EUR/USD)
- British Pound (GBP/USD)
- Australian Dollar (AUD/USD)
--- Written by Michael Boutros, Sr Technical Strategist with FOREX.com
Follow Michael on Twitter @MBForex


