US Dollar Index Technical Forecast: USD Weekly Trade Levels (DXY)
- US Dollar plunges through critical support zone- invalidates July uptrend
- USD risk for further losses while below yearly-open – initial support in view
- DXY resistance 102.55/99, 103.49, 104.63 – Support 101.60s, 101.08/24, 98.97-99.66 (key)
The US Dollar is poised for a second weekly decline with DXY plunging more than 2.3% from the December high. The sell-off marks a second attempt to break a major support zone and the focus is on a weekly close to validate. These are the updated targets and invalidation levels that matter on the DXY weekly technical chart heading into the close of 2023.
Review my latest Weekly Strategy Webinar for an in-depth breakdown of this USD setup and more. Join live on Monday’s at 8:30am EST.
US Dollar Price Chart – USD Weekly (DXY)

Chart Prepared by Michael Boutros, Sr. Technical Strategist; DXY on TradingView
Technical Outlook: In last month’s US Dollar Technical Forecast we noted that DXY sell-off had taken the, “index towards multi-month trend support and the last line of defense for the bulls.” The support zone in focus was 102.55/99- a region define by the 61.8% Fibonacci retracement of the yearly range, the 2016 high-close, and the January low-week close. The greenback held key support into the close of November with a rally of more than 1.7% off the lows faltering at the 25% parallel early in the month.
The FOMC inspired sell-off slammed back into support last week with the index now firmly below this key region. Note that a trendline off the May 2021 low does come in just lower near 101.60s, but only consists of two reference points - watch the weekly close here.
The next lateral support zone rest with the July reversal close / 78.6% retracement at 101.08/24 backed by a key support confluence at 98.97-99.66 – a region defined by the 61.8% retracement of the 2021 advance, the 2023 swing low, and the 2019 swing high. Note that the original 2011 slope also converges on this threshold into Q1 and represents a major inflection zone for the Dollar.
Initial weekly resistance back at 103 with medium-term bearish invalidation now lowered to the objective yearly-open / 52-week moving average at ~103.49. Ultimately, a breach / weekly close above 104.63 would be needed to mark uptrend resumption.
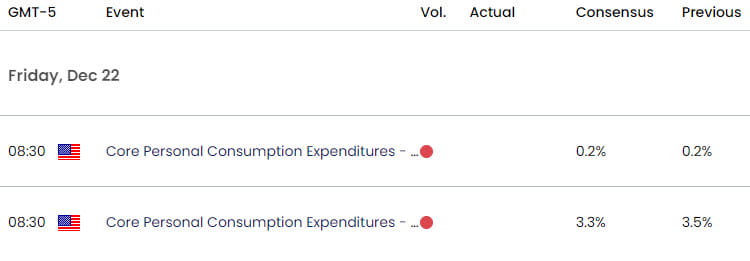
Bottom line: The US Dollar is breaking a major support confluence here (need the weekly close to confirm). From at trading standpoint, rallies should be capped by 103.50 IF price is heading lower on this stretch with a close below the 2021 trendline needed to keep the immediate downtrend viable. Keep in mind we get the release of key US inflation data Friday– stay nimble into the extended holiday weekend. I’ll publish an updated US Dollar Short-term Outlook once we get further clarity on the near-term DXY technical trade levels.
Key Economic Data Releases

Economic Calendar - latest economic developments and upcoming event risk.
Active Weekly Technical Charts
- Euro (EUR/USD)
- Canadian Dollar (USD/CAD)
- British Pound (GBP/USD)
- Japanese Yen (USD/JPY)
- Australian Dollar (AUD/USD)
--- Written by Michael Boutros, Sr Technical Strategist with FOREX.com
Follow Michael on X @MBForex


