US Dollar Index Technical Forecast: USD Weekly Trade Levels (DXY)
- US Dollar plunges 2.14% off July high, slips back below 52-week moving average
- USD poised to carve August opening-range just above support - NFPs on tap
- DXY resistance 104.82-105.18, 106.10/11 (key), 107.18– Support 103.60, 102.87/99 (key), 101.33
The US Dollar is virtually unchanged this week with the index trading just above confluent support into the August open. A well-defined technical range is in view and we’re looking for a breakout to offer further guidance in the days ahead. These are the updated targets and invalidation levels that matter on the DXY weekly technical chart.
Review my latest Weekly Strategy Webinar for an in-depth breakdown of this USD setup and more. Join live on Monday’s at 8:30am EST.
US Dollar Price Chart – USD Weekly (DXY)

Chart Prepared by Michael Boutros, Sr. Technical Strategist; DXY on TradingView
Technical Outlook: In last month’s US Dollar Technical Forecast we noted that DXY had been testing lateral resistance or nearly two-weeks, “at the 2023 / 2024 high-week closes (HWC) at 106.10/11- the focus is on possible inflection off this threshold with the long-bias vulnerable while below.” The index turned sharply lower days later with the DXY plunging more than 2.3% off the off the July highs to mark a weekly close below the 52-week moving average.
The USD rebounded off the 100% extension off the April decline at 103.60 with the index ranging just above this level for the past three weeks. Initial resistance is eyed at 104.42-105.18- a region defined by the July high-day reversal close and the 61.8% Fibonacci retracement of the most recent decline. A breach / weekly close above this threshold would shift the focus towards another test of key resistance / bearish invalidation at 106.10/11 - look for a larger reaction there IF reached.
A break below the 103.60 support pivot still must contend with a major technical confluence at 102.87/99- a region defined by the 61.8% retracement of the December rally, the 2016 high-close (HC) and the January 2023 low-week close (LWC). A break / weekly close below this threshold would risk significant losses for the Dollar with subsequent support objectives eyed at the 2023 trendline (currently ~101.80s) and the December LWC / 2024 yearly open at 101.33/41.
Bottom line: The US Dollar index is trading just above confluent support with the August opening-range taking shape within well-defined technical barriers. From at trading standpoint, the immediate focus is on a breakout of the 103.60-105.18 range for guidance with the broader April decline vulnerable while above the July low.
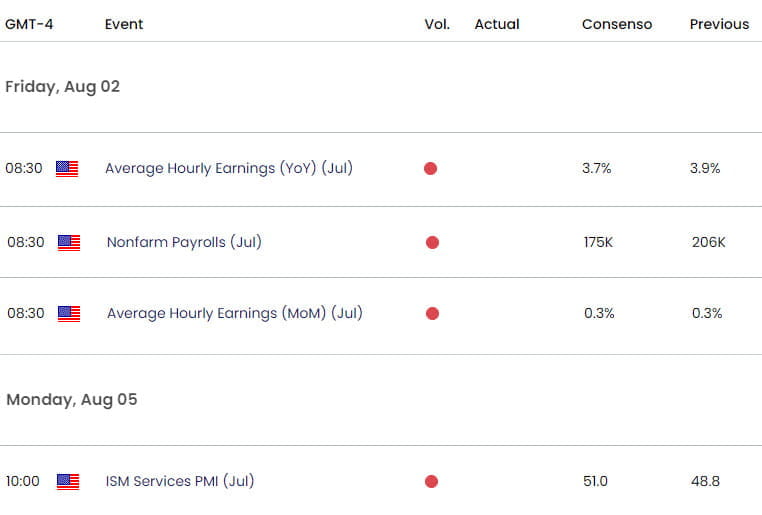
Keep in mind we get the release of US Non-Farm Payrolls into the close of the week- stay nimble into the August opening-range and watch the weekly closes here for guidance. Review my latest US Dollar Short-term Outlook for a closer look at the near-term DXY technical trade levels.
Key Economic Data Releases

Economic Calendar - latest economic developments and upcoming event risk.
Active Weekly Technical Charts
- Japanese Yen (USD/JPY)
- Euro (EUR/USD)
- British Pound (GBP/USD)
- Crude Oil (WTI)
- Gold (XAU/USD)
- Australian Dollar (AUD/USD)
- Canadian Dollar (USD/CAD)
--- Written by Michael Boutros, Sr Technical Strategist with FOREX.com
Follow Michael on X @MBForex


