
US Dollar Talking Points:
- The US Dollar re-tested the 102 level in DXY this week, which held the lows in DXY while producing a bounce that brought upon a re-test of 103 resistance.
- The focus shifts to inflation next week with the release of the Fed’s preferred inflation gauge of Core PCE on Friday. Additional USD drivers will appear along the way, such as the Durable Goods and Consumer Confidence releases on Tuesday and the final read of Q1 GDP on Thursday.
- I’ll be discussing these themes in-depth in the weekly webinar on Tuesday at 1PM ET. It’s free for all to register: Click here to register.
The US Dollar came into the week after re-testing a key level of support on Friday of last week. This is at the 102 level in DXY, which is the 50% mark of the 2021-2022 bullish trend. Perhaps more importantly and as discussed in this space last week was what was below – as the 101 level is around the low point of a double bottom formation and a descending triangle formation that’s helped to hold the lows in DXY on two separate occasions so far this year.
The 102 level came into play last Friday just after the FOMC and ECB rate decisions, and a bounce developed in the early portion of this week. The Humphrey Hawkins testimony from Chair Powell on Wednesday seemed to un-do that effort from bulls, however, with prices pushing down for another re-test of that support during early Thursday trade. But that’s when buyers started to show a strong reaction and this was hastened on Friday morning after the release of PMI numbers out of Europe, which showed a fast drop, highlighting the fact that further rate hikes from the European Central Bank may not be a simple prospect.
As regularly discussed in these articles, with the Euro making up a whopping 57.6% of the DXY quote, there can be considerable inter-play between the two markets. And the Thursday low in DXY coincides with a resistance test in EUR/USD at the 1.1000 handle, which caught another wave of selling (and DXY strength) around the release of that PMI data on Friday morning.
US Dollar - DXY Daily Price Chart (indicative only, not available on Forex.com platforms)
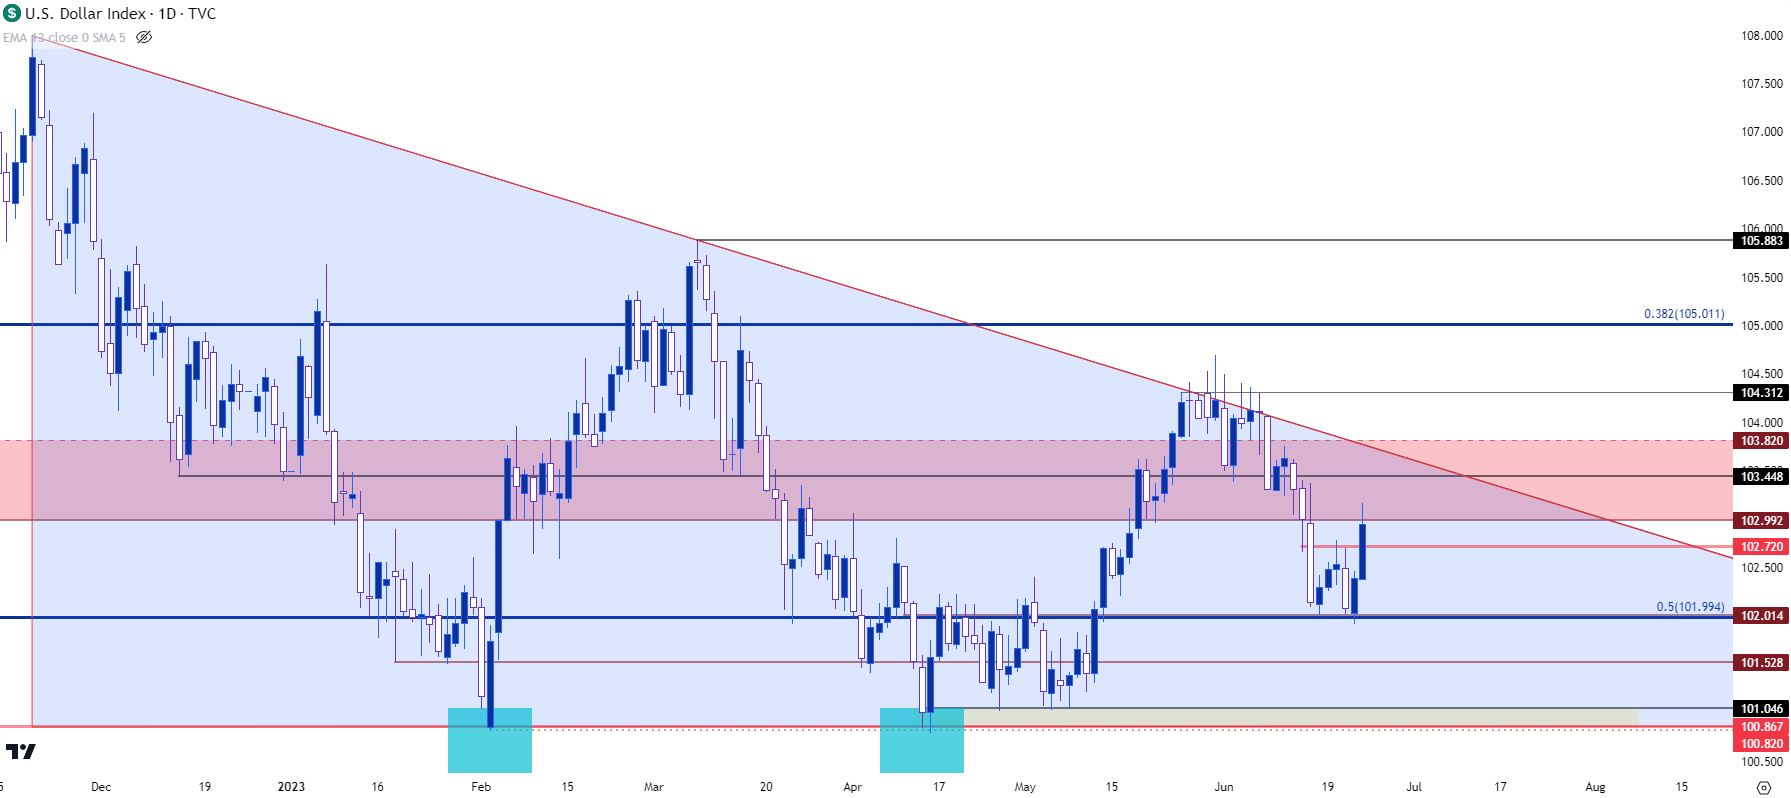 Chart prepared by James Stanley; data derived from Tradingview
USD Bigger Picture
Taking a step back on the USD chart and the currency remains in a state of consolidation, similar to what’s shown for much of 2023 trade thus far. There are a couple of major spots of resistance sitting overhead, the most obvious of which is the bearish trendline that stalled the advance in early-June trade. Before that comes into play a shorter-term resistance level shows at 103.45, which was support that held the lows in the end of last year.
Bulls have still failed to elicit a daily close above that trendline as there was two weeks of grind at that level. If buyers can force a break in the near-term, the next spot of resistance appears at the 38.2% retracement from that same Fibonacci study, plotted around the psychological level at 105.00 in DXY.
US Dollar - DXY Weekly Price Chart (indicative only, not available on Forex.com platforms)
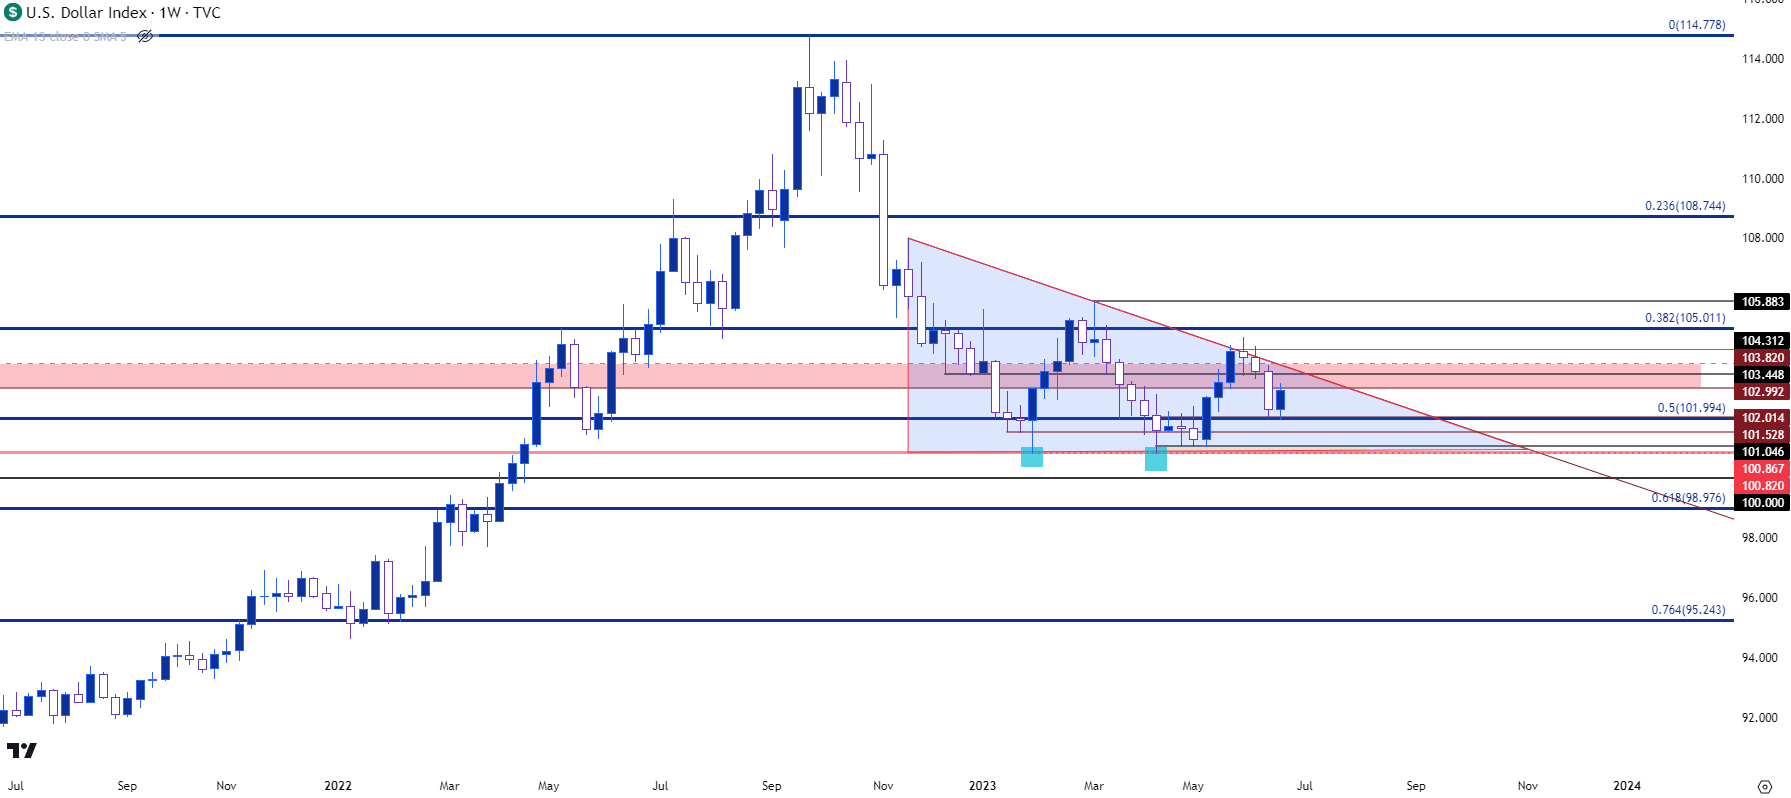 Chart prepared by James Stanley; data derived from Tradingview
EUR/USD: Can the ECB Continue to Out-Hawk the Fed?
If we go back to a year ago the Euro was in the midst of a swan dive as inflation remained high and the ECB remained dovish. The bank appeared cautious of rate hikes for fear of hindering growth; but the matter grew until the bank could no longer ignore the necessity of tightening policy. The bank didn’t begin to hike rates until July, after the Fed had already ramped up to 75 bp hikes a month earlier; but it wasn’t until September, when the ECB had similarly started to hike rates in 75 bp increments that EUR/USD began to show some evidence of a bottom.
That helped to firm a low in EUR/USD with the somewhat peculiar backdrop of a hawkish ECB which, historically speaking, hasn’t been all too common since Jean Claude Trichet’s hike in 2011, which led into the European Sovereign Debt Crisis.
The ECB continues to retain a hawkish stance as we’ve heard various ECB members discuss the necessity of further hikes to continue the fight against inflation. But this morning brought a piece of evidence on the other side of the matter as early PMI figures disappointed, with a 43.6 print against a 44.8 expectation, while services PMI showed at 52.4 against a 54.5 forecast. This was shockingly bad, and highlights the impact of rate hikes in Europe even as Jerome Powell and the Fed debate lag effects of rate hikes in the US.
This begs the question as to how much further the ECB might be able to tighten policy as the same item that kept the bank from hiking sooner remains an issue today.
In response to that release EUR/USD put in a fast drop in early-Friday trade, furthering a sell-off that began after the 1.1000 level had come into play as resistance on Thursday morning (right around the time DXY was testing 102). Support showed at a familiar area, around the 1.0843-1.0864 zone that I looked at in the Tuesday webinar.
This opens the door for a lower-high resistance test at a key zone of 1.0930-1.0943. If bears can’t hold that, then the 1.1000 area comes back into the picture and there’s a lot going on in that zone, such as we saw during April trade when bulls were unable to force their way through.
EUR/USD Daily Chart
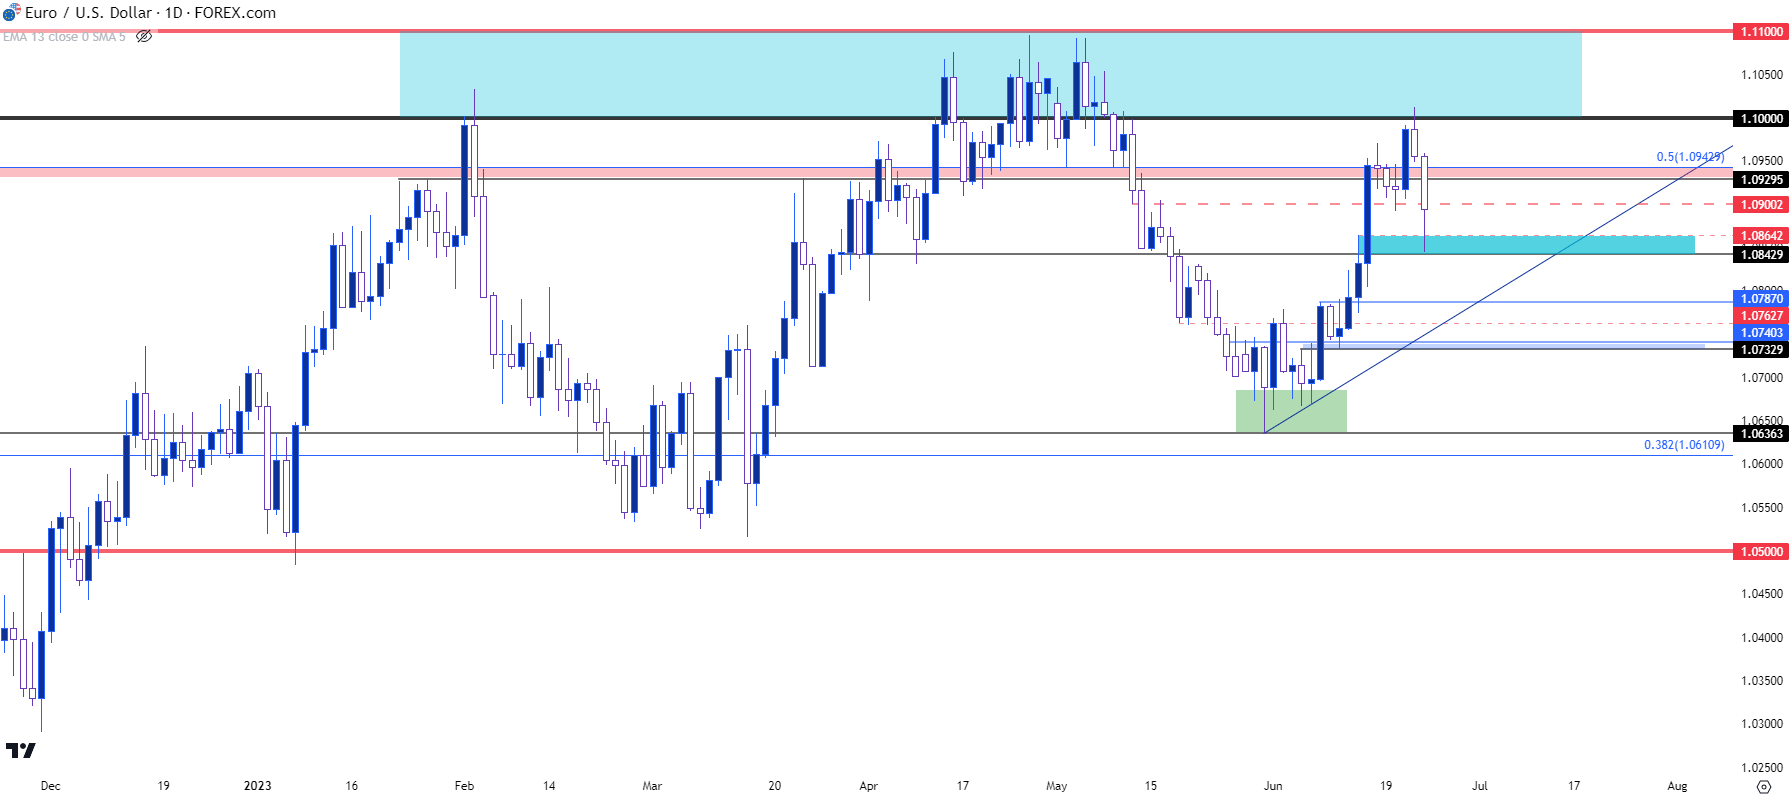 Chart prepared by James Stanley, EUR/USD on Tradingview
GBP/USD Rate Hike Sell-Off
It was a big week for economic data in the UK, with inflation on Wednesday leading into a Bank of England rate decision on Thursday. Inflation printed above expectations for both headline and core, and the morning after, the BoE hiked rates by 50 bps while markets were expecting a more moderate 25 bp move.
If you were looking at just that, you’d probably expect the spot rate of Sterling to be higher, right? Well that’s not what happened, as bulls shied away from a breakout by cauterizing this week’s high just five pips below last week’s swing high, which was then followed by a strong pullback to fresh weekly lows around the 1.2700 handle.
The fact that bulls held that support above the obvious area of prior resistance, around the 1.2667 level that had previously set the yearly high in the pair, could retain a bit of a bullish component in the matter. At the very least this could make the pair one of the more compelling backdrops for scenarios of USD weakness, but bulls have some work to do next week to keep that in order.
GBP/USD Daily Chart
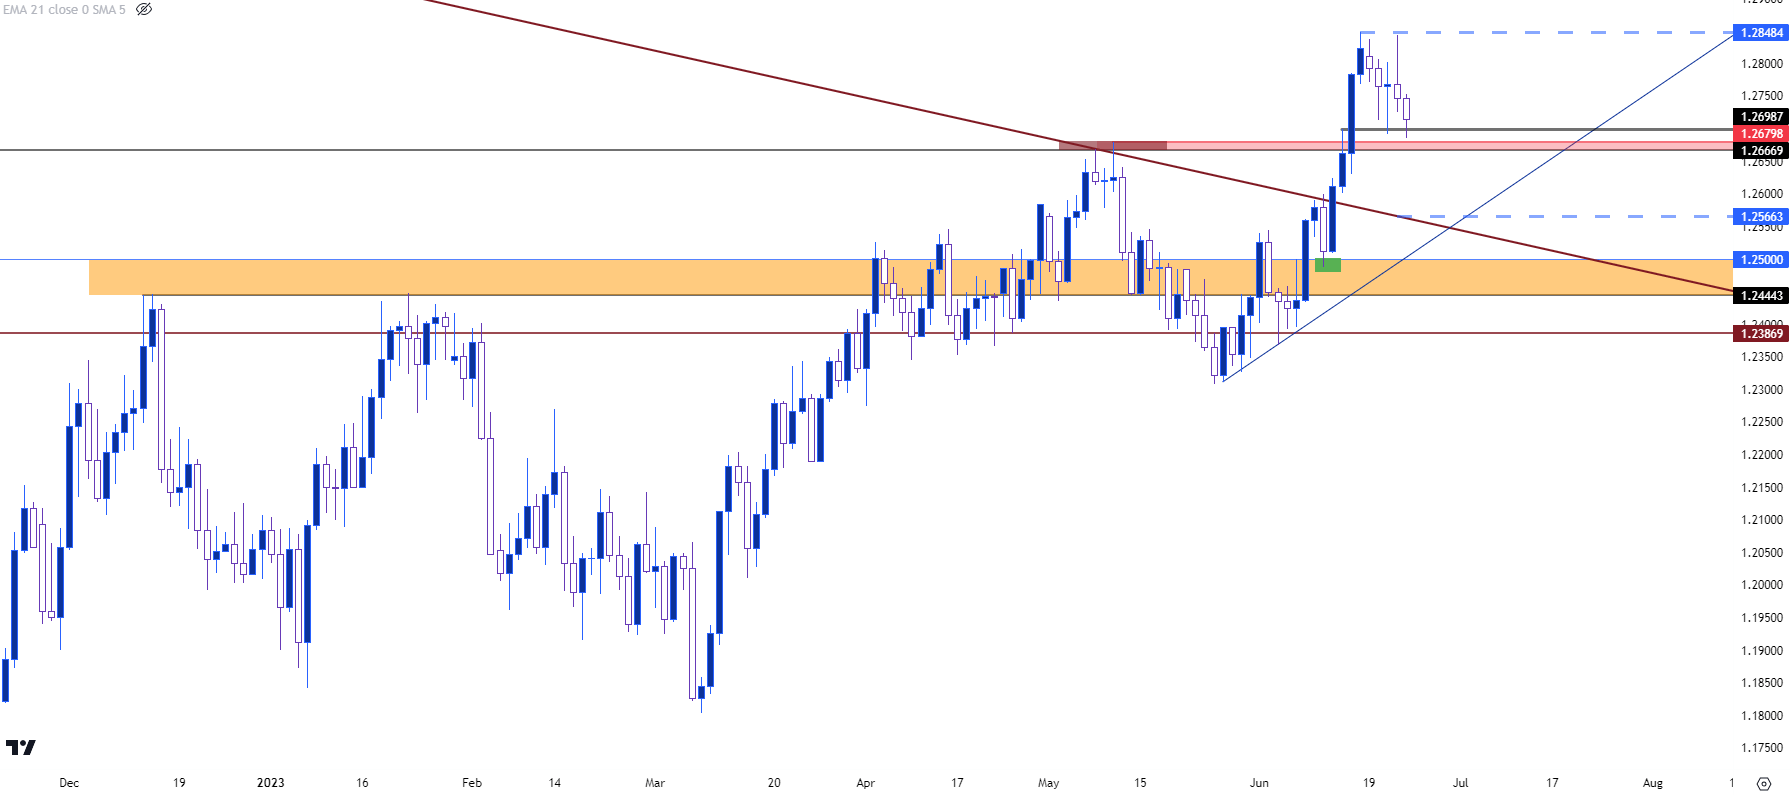 Chart prepared by James Stanley, GBP/USD on Tradingview
USD/JPY
At this point we’ve had two rate decisions with BoJ Governor Kazuo Ueda and markets don’t seem too concerned with any near-term changes in Japanese monetary policy. After last week’s rate decision the Yen weakened against many major currencies and that helped to buoy USD/JPY back-above the 140 handle.
With USD strength re-appearing this week the USD/JPY pair put in a clean continuation move from that prior breakout to set a fresh 2023 high. And we are now fast approaching levels that last year started to elicit a response from the Japanese Ministry of Finance. That was around the 150¥ spot in the USD/JPY pair and that’s ultimately what helped to create the top in Q4, with an assist from softening rate hikes out of the FOMC later in the year.
Price crossed a major threshold this week at the 142.50 psychological level and that remains a spot of support potential for next week should prices pose a pullback. Sitting above current price is the 145 handle which has quite a bit of prior structure, first as resistance and then as support before prices began to reverse last year.
Until there’s a show of shift around Japanese policy or some type of verbiage from the Ministry of Finance, this can keep USD/JPY as one of the more enticing markets in scenarios of continued USD-strength.
USD/JPY Daily Price Chart
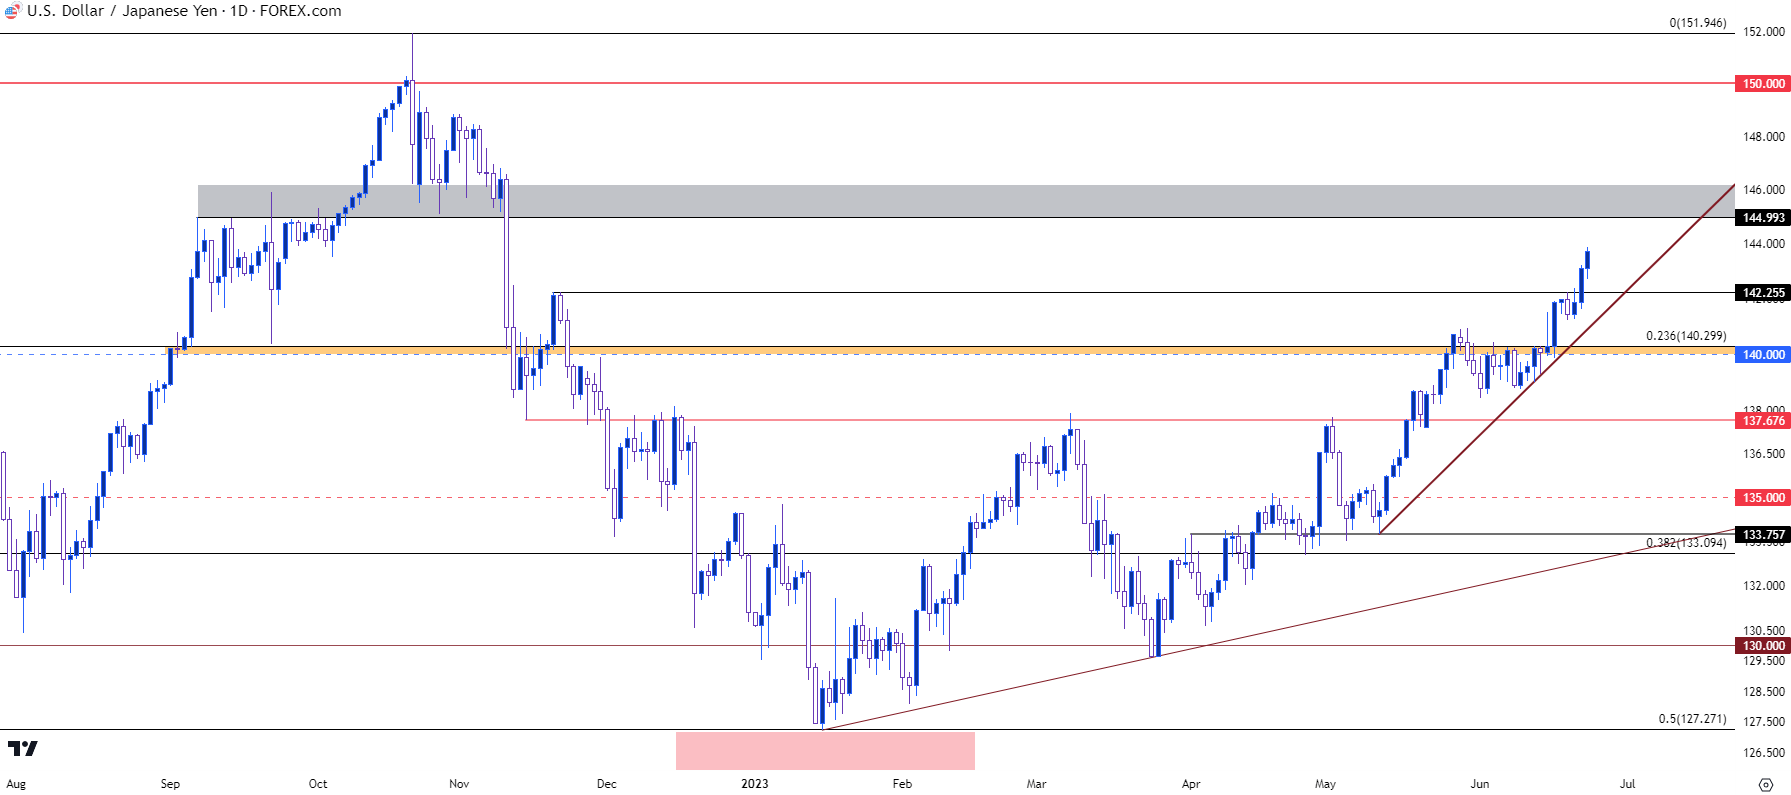
Chart prepared by James Stanley, USD/JPY on Tradingview
--- written by James Stanley, Senior Strategist


