
US Dollar Talking Points:
- The US Dollar took a heavy hit on Wednesday around the FOMC rate decision.
- DXY snapped all the way back below the 102.00 level, which has since offered a support bounce.
- There remains some high-impact headline risk through next week, leading into the Christmas holiday the week after.
In the final FOMC rate decision of the year, Jerome Powell did not strike the balance that was commonplace for FOMC press conferences in 2023. He sounded downright dovish in December, and this echoed the comments from Treasury Secretary Janet Yellen earlier that day, in which she voiced her confidence in the ‘soft landing’ scenario. As inflation continues to show signs of progress both Powell and Yellen have voiced their optimism, and this has driven the expectation across markets that the next move out of the Fed will be a cut rather than a hike.
On Thursday, we heard from the ECB and Christine Lagarde didn’t sound quite as dovish; and at the Bank of England rate decision Andrew Bailey retained a degree of hawkishness, saying that rates would remain ‘sufficiently restrictive for sufficiently long.’ This contrast can allow for trends in currency pairs, particularly should those fundamental themes continue to show.
In the US Dollar, the fall on Wednesday continued through Thursday trade, until support eventually showed at the 101.77 level. This is the 14.4% retracement of the pullback move that started in Q4 of 2022 and ran until July of 2023. I was tracking that price as the bottom of a zone that extended up to 102, and that’s since held the lows while starting a bounce. That bounce has, so far, run up for a resistance test at prior support at the 102.55 Fibonacci level.
US Dollar Daily Price Chart (indicative)
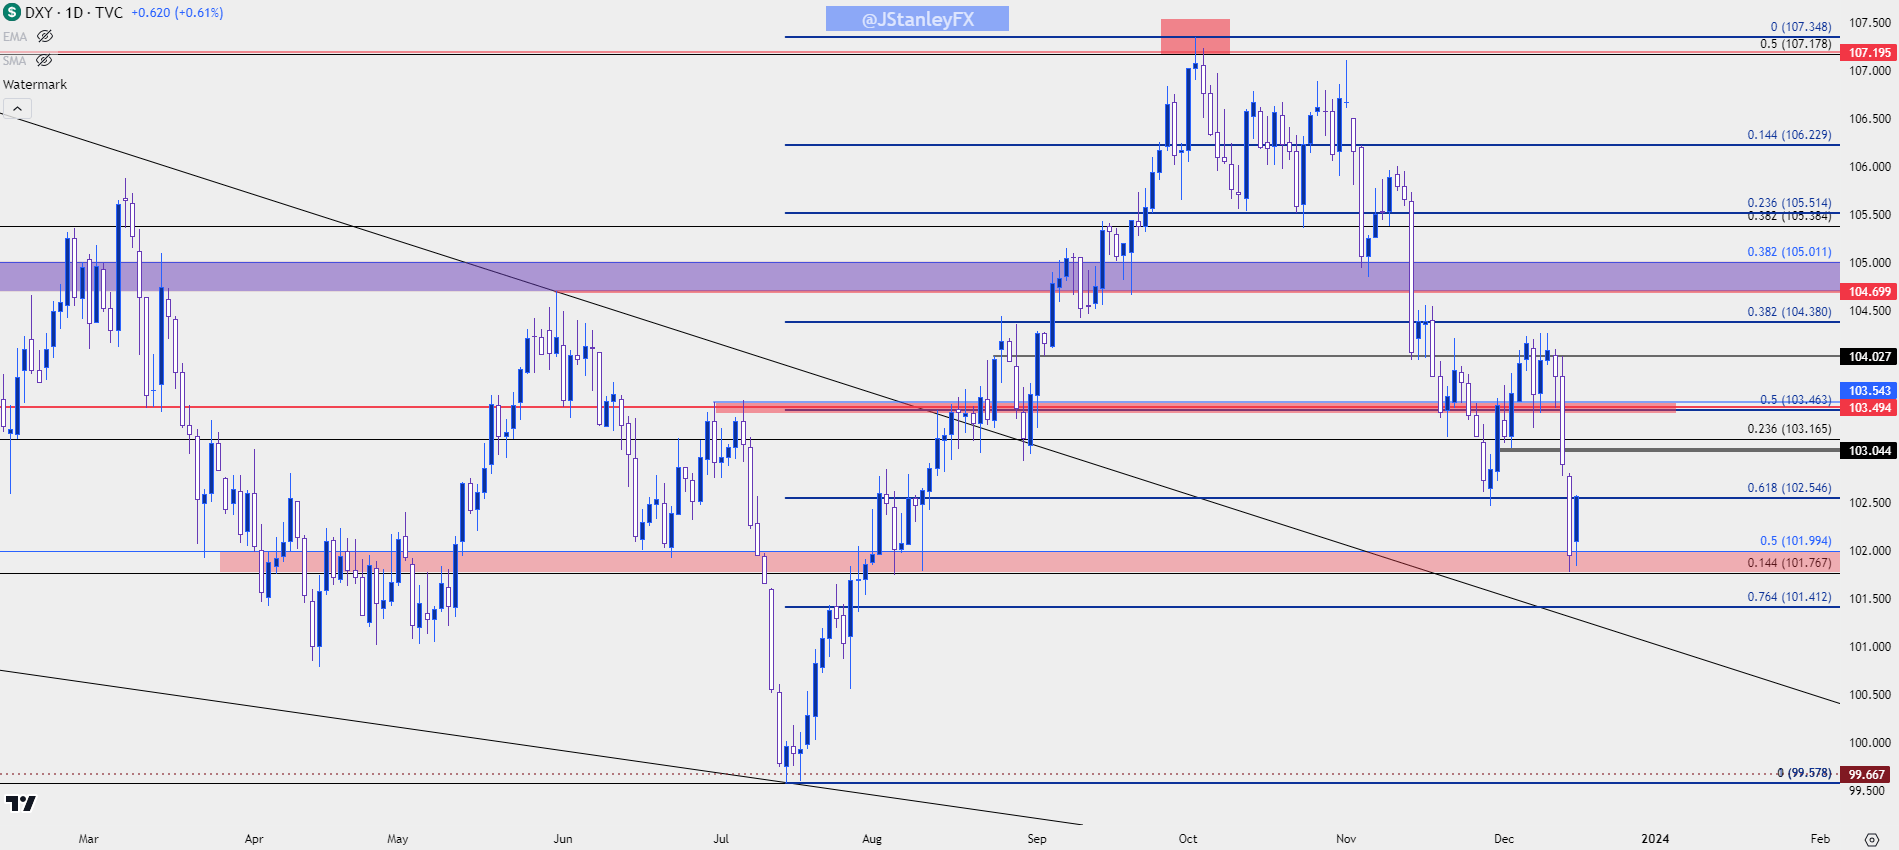 Chart prepared by James Stanley; data derived from Tradingview
USD: A Busy Week Before the Holidays
Next week’s economic calendar offers several high-impact items that could impact the USD. There’s a Bank of Japan meeting and if the BoJ hints towards any change in their own monetary policy, the push of Yen-strength could be significant and deductively this could mean more pressure on the USD. There’s European and Canadian inflation data due on Tuesday with UK inflation set to report on Wednesday with Japan inflation on Thursday. For US data, there’s consumer confidence on Wednesday and the final read of Q3 GDP on Thursday. But it’s the Core PCE release for Friday morning that will likely dominate the attention of market participants as this will offer that next piece of inflation data.
In the USD, the big question is whether sellers will extend the bearish move that started with the November FOMC rate decision. Given that the USD is a composition of underlying currencies, for USD weakness to continue, other currencies will need to take on strength. The Euro is often a focal point for such themes as it’s 57.6% of the DXY quote, but there’s also notable impact from the Japanese Yen at 13.6% and the British Pound at 11.9%. The Canadian Dollar plays a smaller role at 9.1% but similarly, strength in CAD can equate to an element of weakness in the DXY.
So – for the US Dollar to continue its decline we’re going to need to see strength from other currencies which I’ll investigate below. For the USD, the 103.50 level remains relevant. This is the yearly open in the DXY and there’s a few other items of note around that same spot on the chart. I’ve been saying for a few weeks now that it would not surprise me at all to see the USD close the year near that price, and that can remain the case with two weeks left before the end of the year.
On the below four-hour chart we can get a better view of that recent bearish structure. Price is right now testing resistance at prior support, and if bears hold this through next week’s open, it can remain as a lower-high. But, if bulls continue to push, the next waypoint is around the 103.04 level of prior support, after which that 103.50 zone comes back into the picture. For support, the 101.77 level is the main objective after which another Fibonacci level appears at 101.41.
US Dollar Four-Hour Price Chart (indicative)
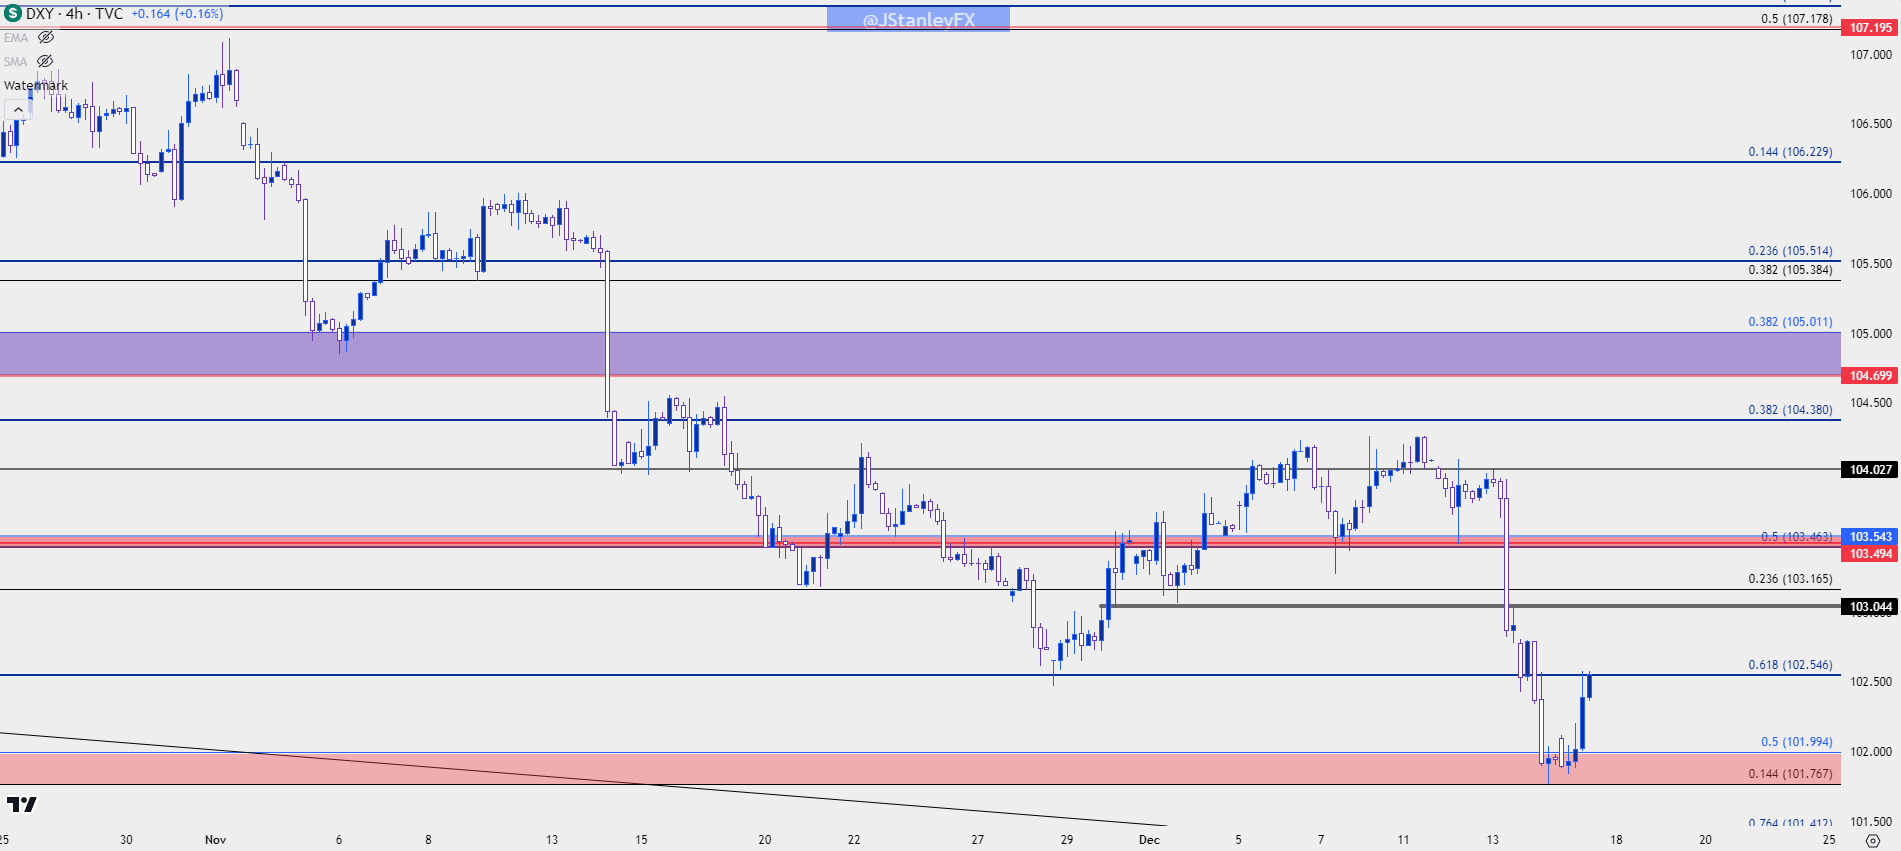 Chart prepared by James Stanley; data derived from Tradingview
EUR/USD: 1.1000 Resistance, Round 2
EUR/USD had come into the Wednesday rate decision after holding support at 1.0750 for a week. A strong move developed on Wednesday, and that extended through Thursday, with the 1.1000 level coming into play a couple of hours after the ECB rate decision.
But just as we saw in late-November, the psychological level remained strong and bulls were unable to overcome it, and price has since retraced by more than 100 pips from that spot. There could be possible scope for continuation, but bulls will need to come into the picture to offer higher-low support. There is a spot of note at the Fibonacci level of 1.0862, and there’s a prior swing level at 1.0825 that’s below that.
EUR/USD Daily Price Chart
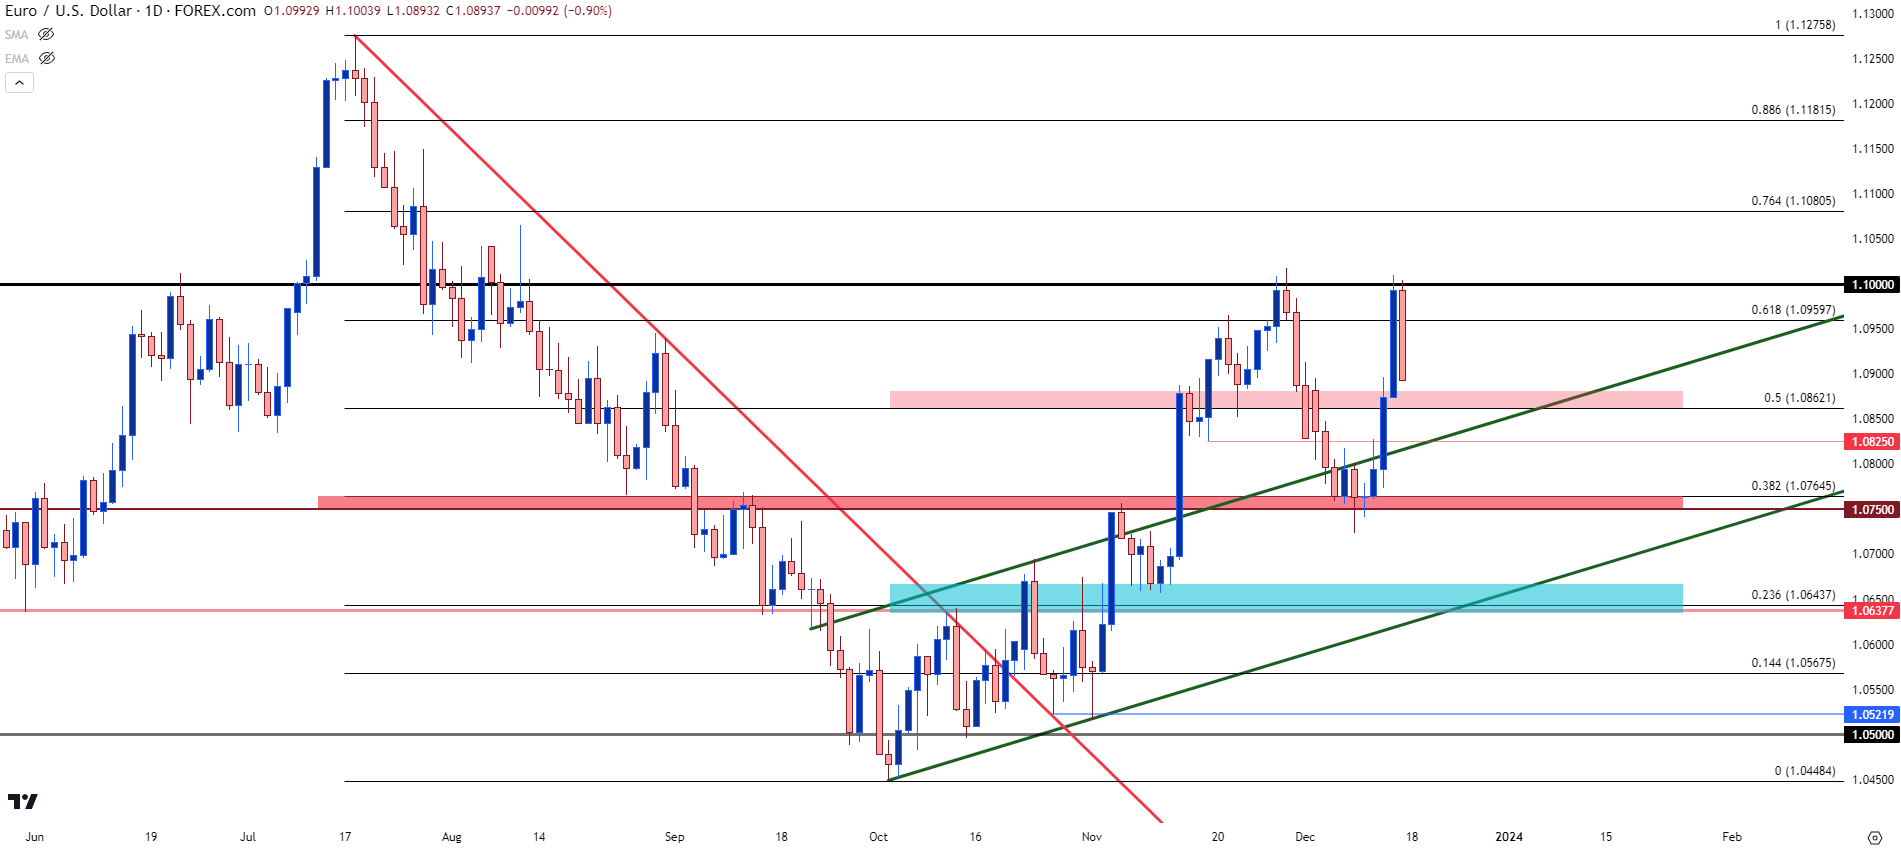 Chart prepared by James Stanley, EUR/USD on Tradingview
USD/CAD Sinks to Support
I had remarked in the Tuesday webinar that commodity currencies appeared particularly well-positioned for scenarios of USD-weakness. USD/CAD was one of those focal points and in the webinar, I highlighted a support zone that spans from 1.3338 up to 1.3387. That zone has since come into play after the extension of that breakdown, and there’s now another item of support that’s in the picture as taken from the bullish trendline drawn from the 2021 lows. As of yet, the bottom of that support zone at 1.3338 hasn’t traded since August, and this is the 50% marker of the 2020-2021 major move.
USD/CAD Weekly Price Chart
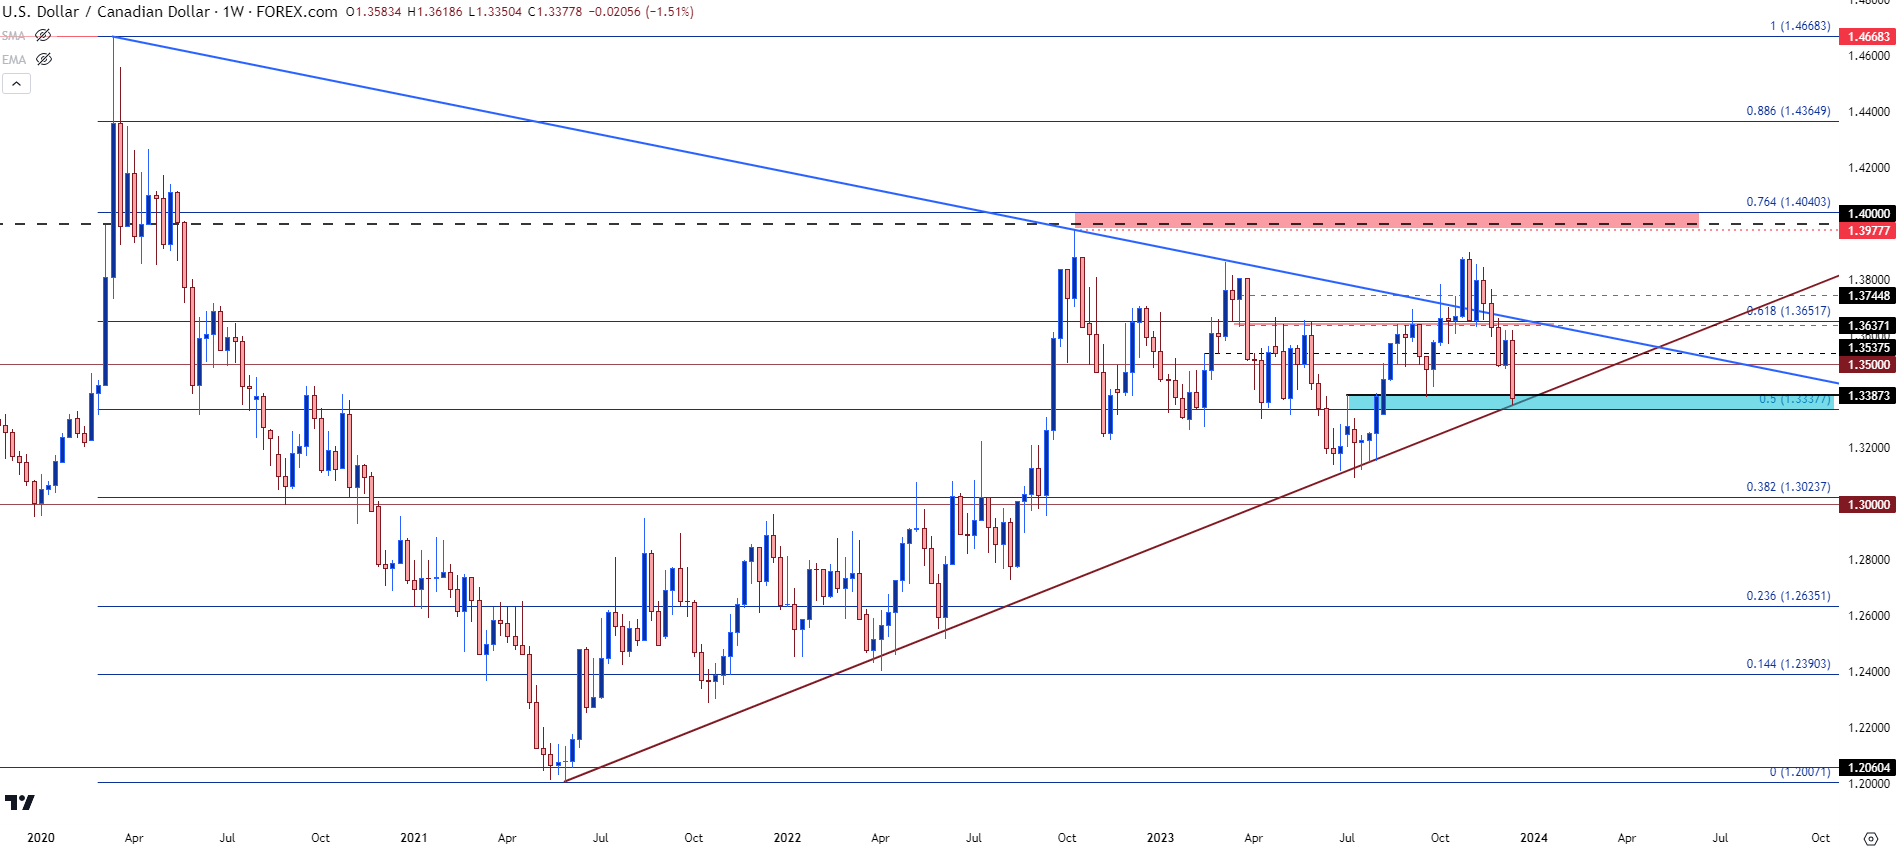 Chart prepared by James Stanley, USD/CAD on Tradingview
USD/JPY
The Bank of Japan remains one of the few Central Banks that haven’t yet adjusted rates to temper inflation. That theme will be on full view early next week when the BoJ meets for their final rate decision of the year. But perhaps the larger question would revolve around timing. With Yen-strength showing against the USD in a rather significant fashion since the November FOMC rate decision, there could foreseeably be some pressure on Japanese inflation simply from the stronger Yen in the USD/JPY spot rate. And when the BoJ does leave behind their negative rate policy, there could be consequence given the size of the bank’s bond portfolio. So this may be a risk that they simply don’t want to encounter until they’re sure that they need to.
From the chart, USD/JPY has just shown its first daily close below the 200 day moving average since May and price has retraced more than 1,000 pips from the highs that were set just a month ago. If the BoJ avoids the topic of any policy changes or rate hikes at the meeting next week, this could allow for a relief bounce. But the larger question for that scenario is whether that relief bounce can turn into anything more, or whether it’ll simply lead into another lower-high.
The 142.50 is already showing a bit of resistance but if that pullback shows in a greater manner, there’s a shorter-term swing level around 144 that remains of interest for a lower-high type of set up.
USD/JPY Daily Price Chart
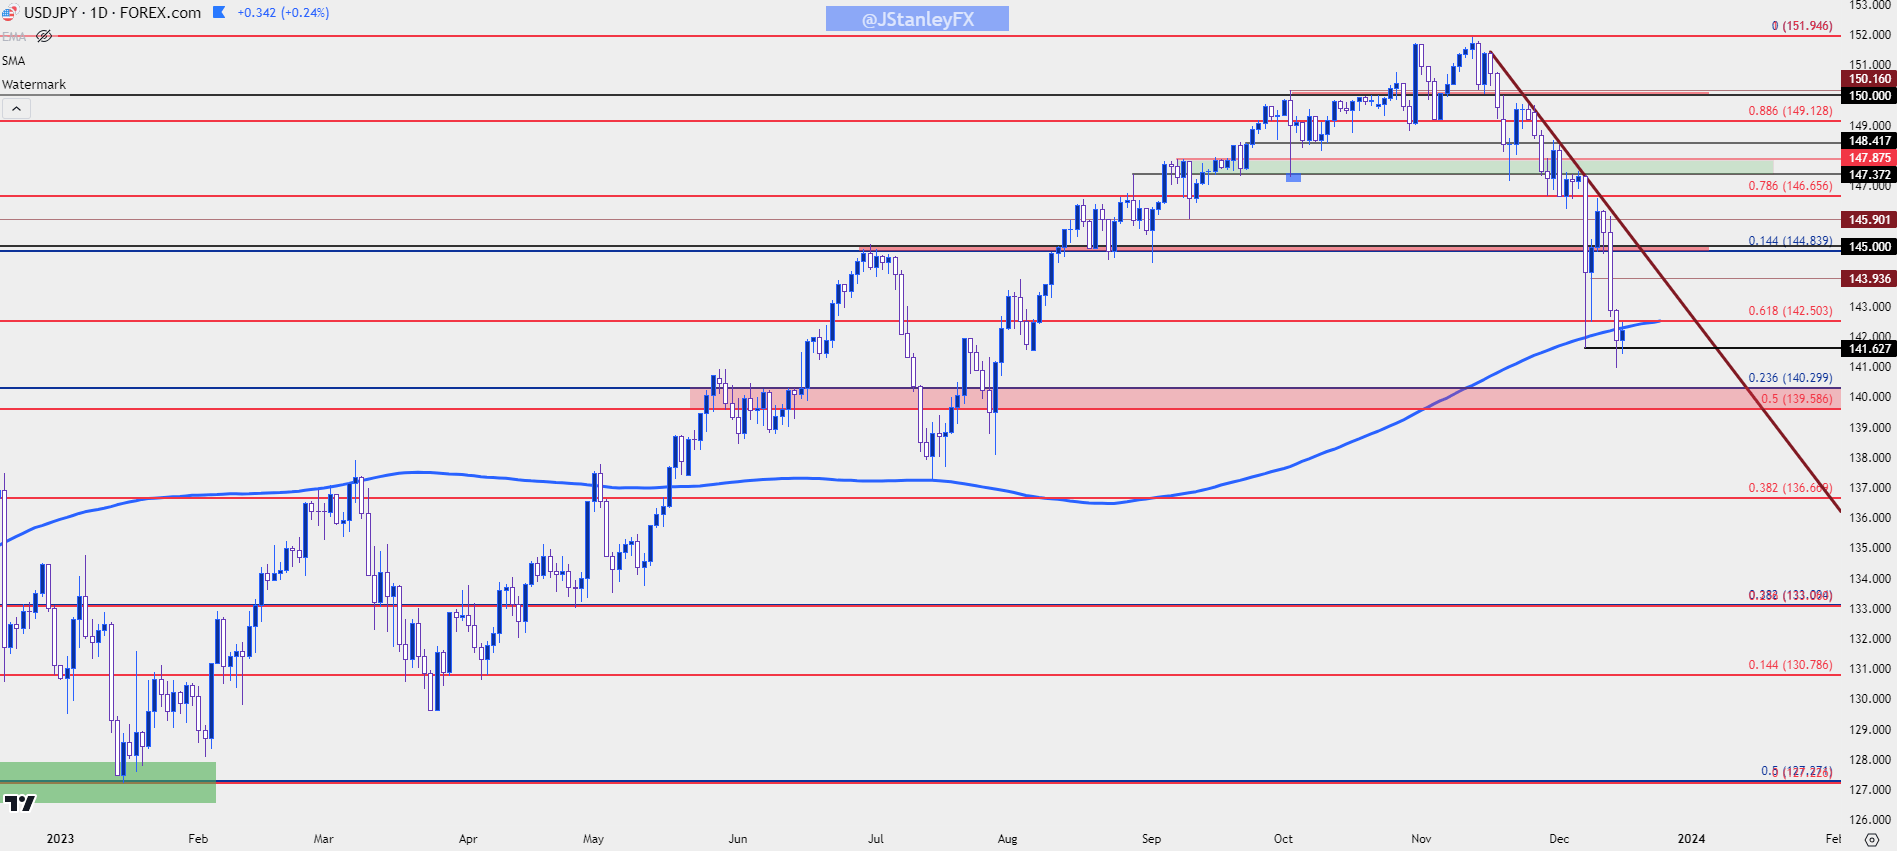 Chart prepared by James Stanley, USD/JPY on Tradingview
Gold
I’ve said for a long time that I think Gold can show a sustainable break above the $2k psychological level once the Fed has formally pivoted in this cycle. What we saw on Wednesday sounded very close to such a pivot, but as Powell said, he didn’t want to remove from the table the possibility of more rate hikes if inflation flares again. So, my expectation is that inflation data will take a more important role here as greater signs of the Fed being finished with hikes (as produced by lower inflation readings) could help to further push the topside of gold.
The Fed’s stance is highly pertinent for gold and price action from this week illustrates that. As there was general expectation for Powell to remain balanced this week as inflation remains elevated, the Fed and Powell sounded fairly dovish and gold prices put in a strong topside move to jump back above the $2k level. From the weekly chart, perhaps the more bullish item is what didn’t happen, as the bearish outside bar from the week before initially had follow-through, but that was reversed on Wednesday and the net of this weekly bar has so far been strength. This can keep bulls in the driver seat for another test of resistance in the 2050-2075 range.
But, whether they’re in a position to leave it behind with bullish continuation remains another matter entirely, and this may remain the case through the 2024 open as the focus on inflation will remain the hot button around both the FOMC and the US Dollar.
Gold Weekly Chart
 Chart prepared by James Stanley, Gold on Tradingview
--- written by James Stanley, Senior Strategist


