US Dollar Talking Points:
- The week started with a continuation of the pullback in the US Dollar, but a strong showing on Thursday has brought that into question.
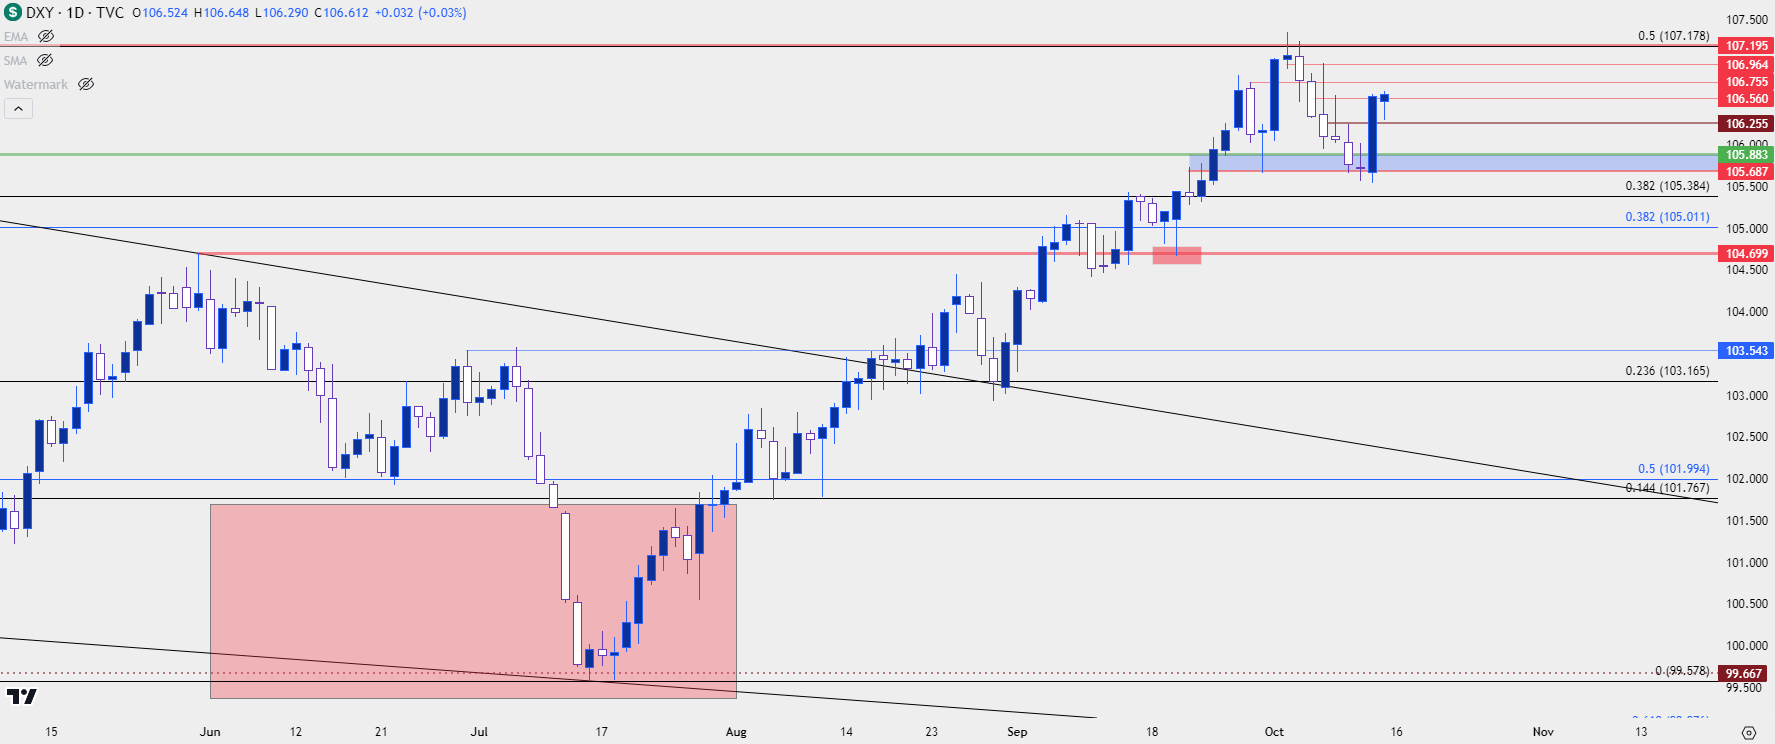
- The USD showed its second-strongest one-day performance yesterday since March, when the banking crisis appeared. The only other stronger daily showing was the Monday before, and the pullback started shortly after.
It’s been a big week for the US Dollar. Given timing and the way that the week had started, it looked as though there could be favor for USD bears.
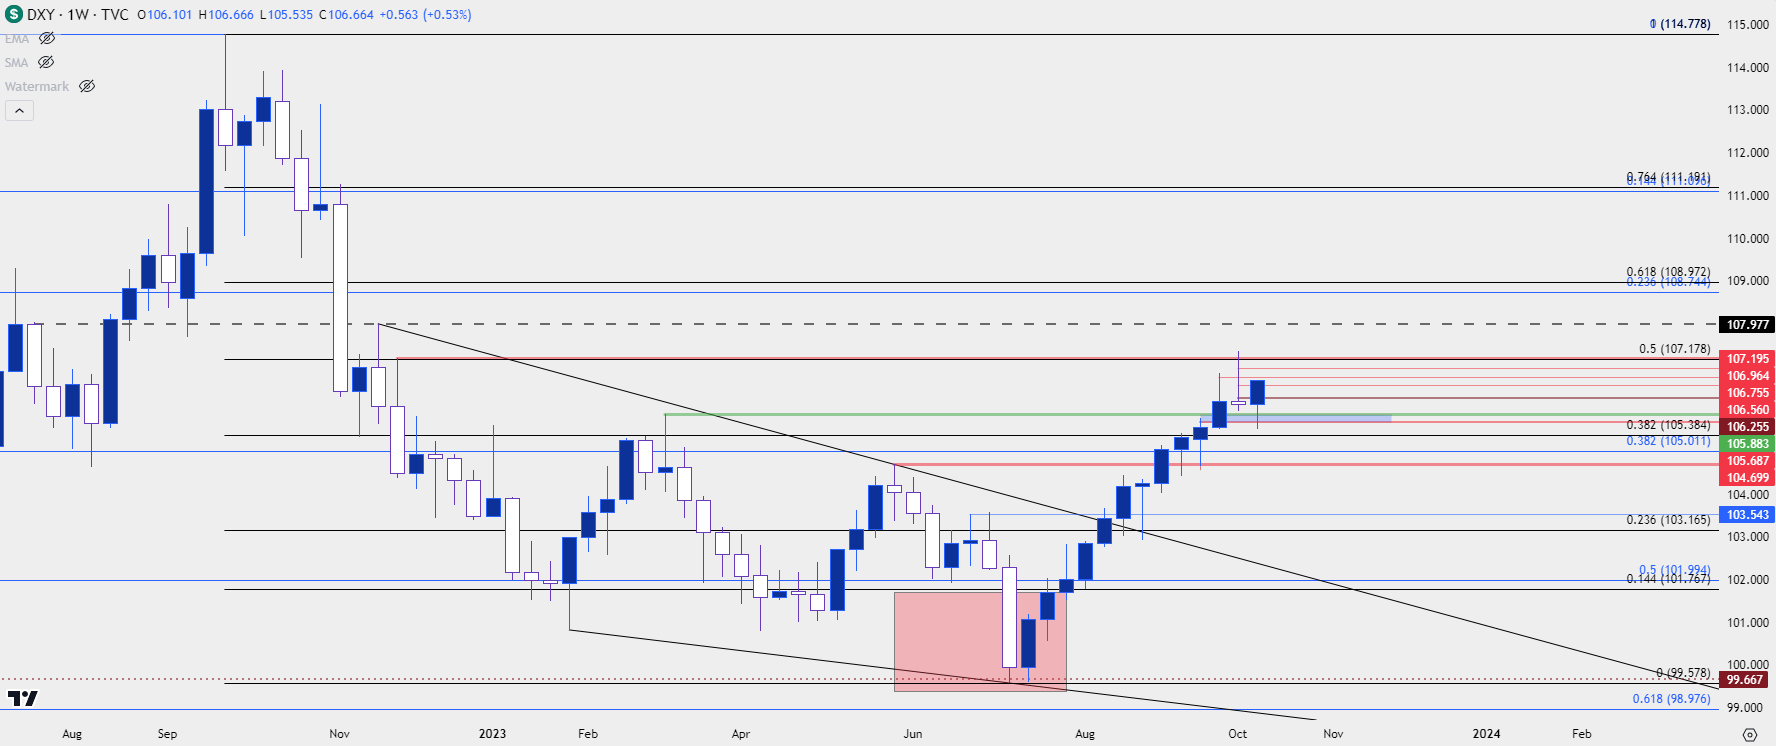
Last week was the first red week for the US Dollar since the failed breakdown in July. And bears seemed to feast on the NFP report on Friday that appeared to be strong, which indicated that we may have been seeing more of a response to overbought conditions. That streak had run for 11 consecutive weeks, which is rare as that’s only happened one other time in the past ten years. In that instance, the Greenback pulled back for two weeks, found support at prior resistance and then continued to launch higher. So, when the USD pulled back last week and the weekly bar printed a gravestone doji, it wasn’t necessarily the end of the trend but it could be a very logical pause point after a consistent streak of gains.
Through the first three days of this week that scenario seemed to fit. The USD continued to pullback and was testing a key spot of support on Wednesday, when a doji appeared on the daily chart. And that then led to a massive move on Thursday after the release of September CPI numbers, which built the second-strongest daily candle since March, when the banking crisis appeared.
That bullish outing made for a morning star formation which is often tracked for possible bullish reversals, and given the context of the prior pullback in the previously-bullish trend, this could be a re-opening of the door for bullish trend scenarios.
US Dollar - DXY Daily Price Chart (indicative only, not available on Forex.com platforms)
 Chart prepared by James Stanley; data derived from Tradingview
The weekly chart of the USD looks similarly strong, with the bulk of the current weekly bar showing atop a wick reaction to the 105.69-105.88 zone.
The complication for continuation here would be the fact that the pullback was so mild that USD bulls could be rightfully cautious of chasing, especially after such a strong one-day performance. The resistance that seemed to give the trend problems sits overhead, around the 107.00 handle on DXY. The high of 107.20 syncs with the 50% retracement of the pullback move that started last year, so the question remains whether USD bulls will be able to force a different outcome on a recurrent test.
US Dollar - DXY Weekly Price Chart (indicative only, not available on Forex.com platforms)
 Chart prepared by James Stanley; data derived from Tradingview
US Dollar Shorter-Term
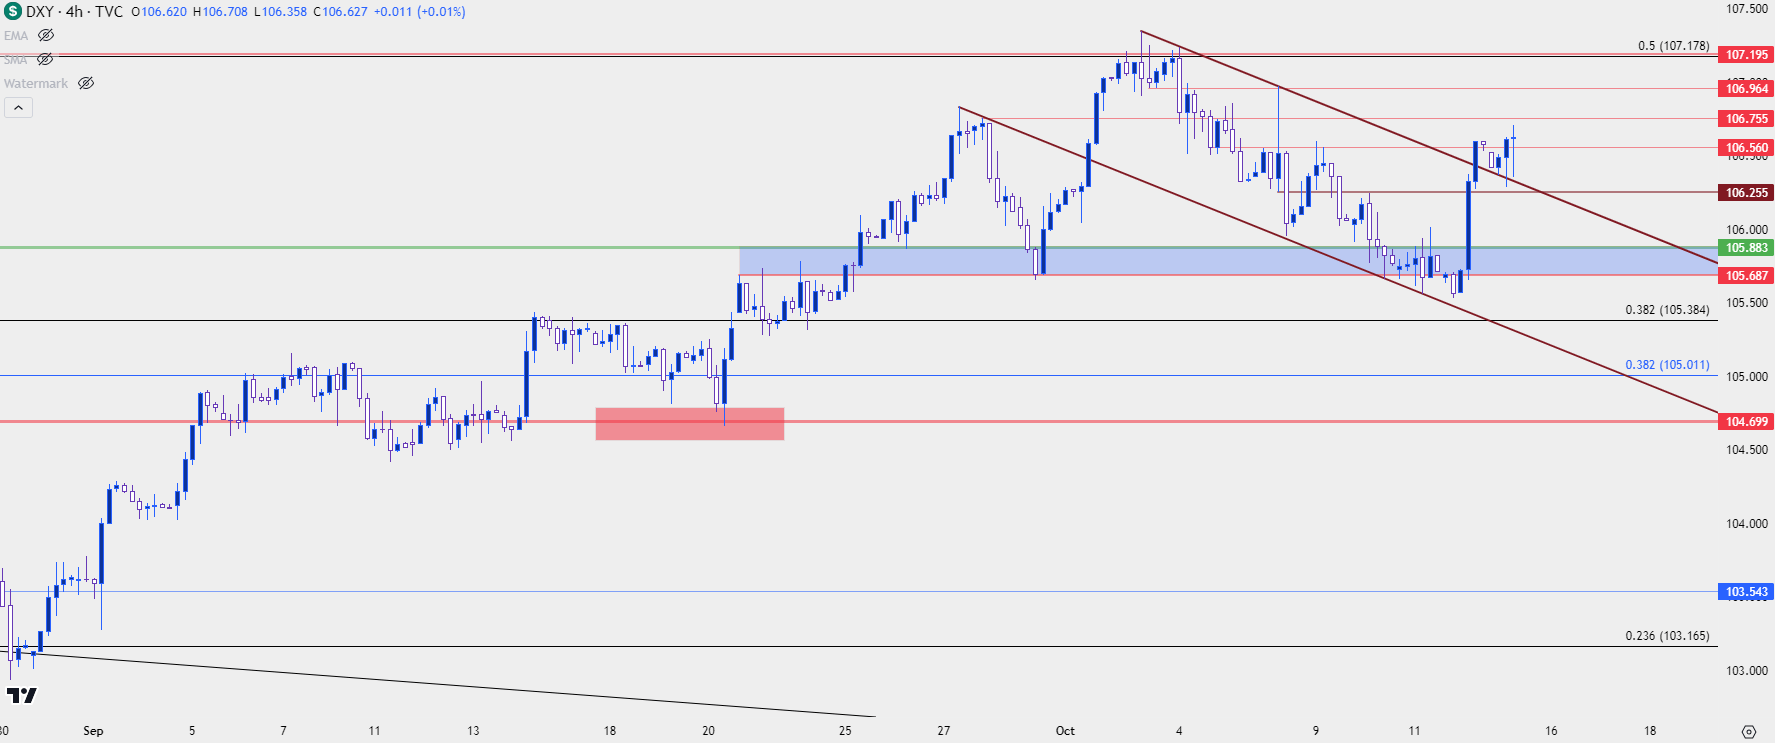
The below chart illustrates just how quickly this theme of strength has come rushing back. DXY was adhering to a bearish channel and that’s started to give way over the past day with bulls returning after the release of CPI.
This also highlights some shorter-term levels of notes. For bulls looking to avoid chasing short-term breaks, there’s a support level of interest at 106.26 and if bulls can hold that, then they can keep the door open for short-term bullish trend continuation. Above that is an aggressive level at 106.56, and if buyers hold that as the higher-low this keeps the focus on next resistance, around 106.96 after which 107.17-107.20 comes into the picture.
For next week, the 105.69-105.88 zone becomes a key spot that bulls need to defend to keep the bullish trend intact, and if we do see a push beyond the 107.20 zone, the next spot of resistance shows around a prior swing-low turned resistance around the 108 handle in DXY.
US Dollar - DXY Four-Hour Price Chart (indicative only, not available on Forex.com platforms)
 Chart prepared by James Stanley; data derived from Tradingview
EUR/USD 1.0500
Given the 57.6% weighting of the Euro in the DXY quote, it can be worthwhile to investigate EUR/USD when DXY is at or near significant highs or lows.
I had talked about this quite a bit over the past couple of weeks but major psychological levels can play a big role in markets, and it can often take time for the market to accept the new reality of prices below that psychological round number. Take parity, for instance, which first came back into play in July of last year. This led to a bounce in the pair and sellers were eventually able to trade below that level, but it was about two months after the first test. It simply took time for the market to get bearish enough to drive EUR/USD weakness with prices below parity.
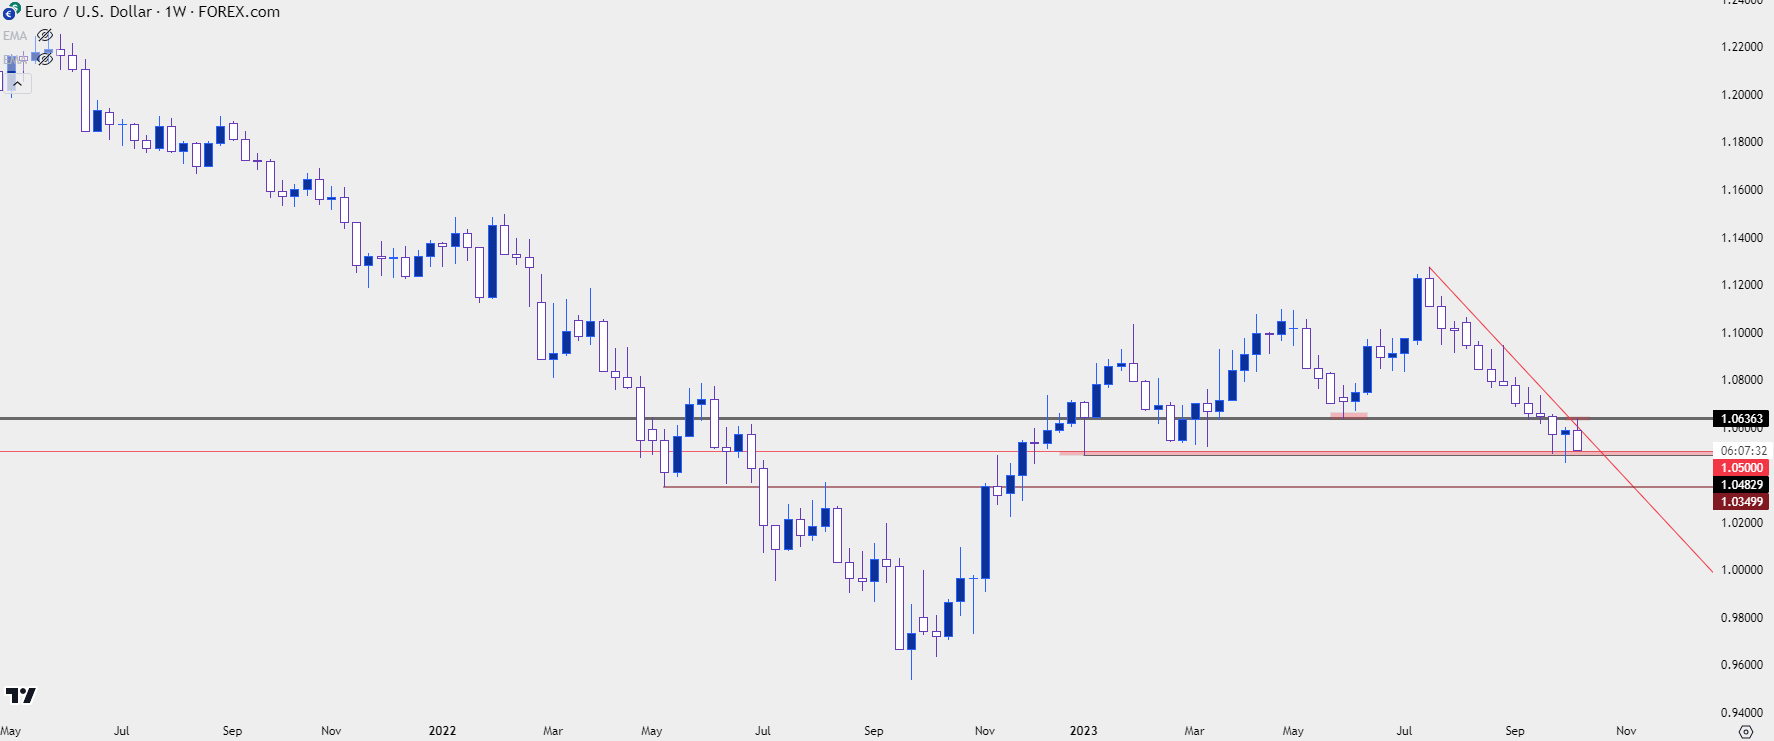
The 1.0500 level may not be as major as parity, but is still a significant level, and as I had shown a couple of weeks ago in the webinar, the bearish trend had started to show symptoms of stalling at that spot. Last week for NFP, price even put in a higher-low, and that led to bullish continuation in the early-part of this week.
Sellers remained aggressive and pushed a lower-high from the 1.0636 price that I highlighted in this week’s webinar. And price is now right back to the 1.0500 handle. This begs the question as to whether the pullback seen over the past week was enough to re-load the trend in order to enable bears to stretch to fresh lows.
There’s a thicket of possible supports below current price, with the 1.0500 handle showing an inflection currency, followed by 1.0488 and then 1.0448, which currently marks the 2023 low. Below that, the 1.0350 level looms large as a next spot of possible support in the event that bears are able to continue the trend.
EUR/USD Four-Hour Price Chart
 Chart prepared by James Stanley, EUR/USD on Tradingview
--- written by James Stanley, Senior Strategist


