
U.S. Dollar, SPX, NQ Talking Points:
- Stocks have continued to show symptoms of pullback with another push yesterday on the back of the CPI print.
- While the Fed remains dovish, data hasn’t worked out to justify rate cuts and yesterday’s CPI print was just the next iteration in that theme. Expectations for a cut in June have now been priced-out and the focus is now on two cuts for 2024 against the prior expectation of three cuts for this year.
- I looked at equities in the Q2 Forecast and you’re welcome to access the full report. The link below will allow for access:
It’s been a busy week across global markets and, so far, Q2 has shown a different backdrop from what had showed during Q1.
The central point of the matter is rate expectations around the Fed. Even during the hiking cycle, the FOMC had already started to forecast rate cuts for this year. So, even as inflation remained strong and the Fed thought that they’d need to continue to hike, they were already telling markets that they were expecting to cut in 2024. That’s one of the factors that helped to drive stocks into the end of last year, driven by the hope that the Fed would move into a cutting cycle at some point in 2024 and, similar to what we’ve had for the past 15 years, the dovish Fed backdrop could allow for continued gains in equities. As a case in point, valuations on the Mag Seven and AI stocks have rushed-higher even during a hiking cycle with inflation remaining well-above the Fed’s 2% target.
The only problem is that data hasn’t exactly worked out for that scenario; not yet, at least. As I’ve tracked in webinars over the past few months, inflation has remained strong via the CPI report and when combined with an unemployment rate remaining below 4%, both sides of the Fed’s mandate suggest that cuts shouldn’t take place.
Of course, this doesn’t necessarily mean that cuts won’t happen. And as a case in point for that, just look back to a couple of years ago when inflation was becoming unmoored, yet the Fed continued to call it ‘transitory.’ And the longer they avoided it, the worse it got, until eventually the bank had to start pushing 75 bp hikes in June of 2022. And that caused pain across markets, all the way until they started to give a glimpse of hopes that cuts may soon come back again.
But really, the hawkish drive didn’t last for long. It was Q4 of that same year that hope started to return to the equation, helped along by the unveil of Chat GPT. The AI-boom that showed after helped to avert attention back to bullish demand and equities had a strong 2023 with S&P 500 Futures gaining 25% against the -19% loss from the year before.
But now we’re at the point where those cuts were expected to begin. And data hasn’t exactly worked out that way for the Fed so far; yet, as we heard at the March rate decision, it seems that the FOMC doesn’t want to move away from their expectation for three 25 bps cuts this year. This would seem to be a similar scenario to the transitory episode where the data is saying one thing while the Fed is saying another.
That awkward grinding between hope for rate cuts and positive data that doesn’t quite allow for such explains much of the backdrop behind many macro markets at the moment. And as I had explained in the Fundamentals article last week, rates are the central conduit by which data impacts markets. And the CPI report yesterday was just the most recent reminder that the U.S. economy isn’t yet soft enough to allow for the Fed to start cutting rates.
In response the 10-Year Treasury Note posted its largest move in yields since September of 2022. These were the levels that seemed to get the attention from equity market participants last year, which led to a pullback that ran from July to October. And then it was the November 1st FOMC rate decision when the bank seemed to rule out the prospect of any additional hikes, with Powell even remarking then that the conversation around when to start cuts had began. That sparked the bullish run that pushed through Q1 of this year.
U.S. 10-Year Treasury Yields
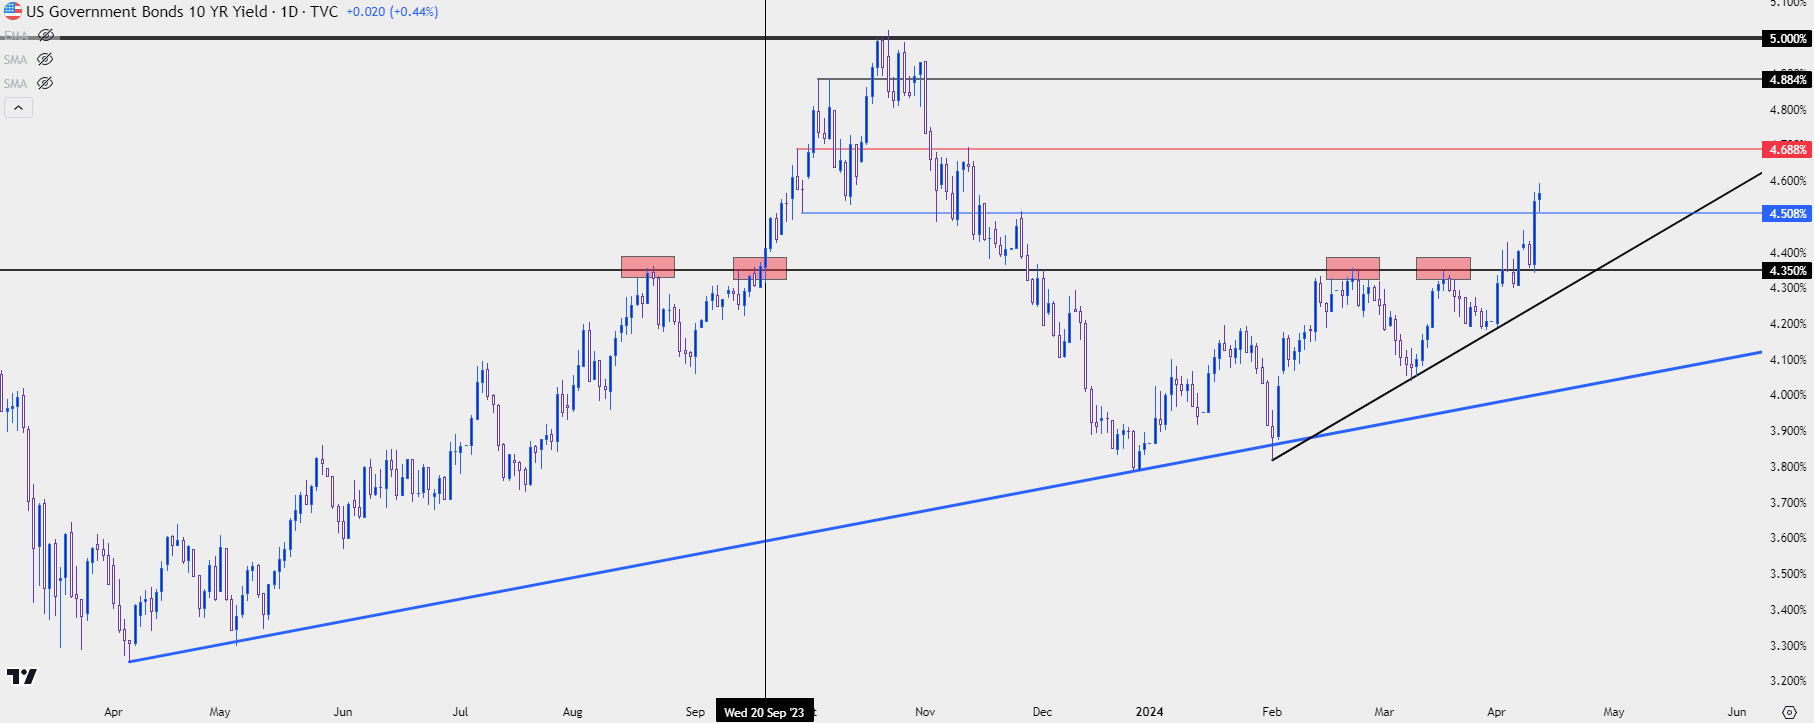
Chart prepared by James Stanley; data derived from Tradingview
The U.S. Dollar
Going along with that theme of rate cuts getting priced-down, the U.S. Dollar has bolted higher, finally pushing through the 105.00 area that had held the highs twice already in 2024 trade.
I looked into this in the Tuesday webinar, highlighting how a third test of that zone from 104.77-105.00 could see a different outcome considering that prices in DXY had already held a higher-low.
That bullish run has continued, with another push from the ECB rate decision this morning, and DXY is now testing the next spot of resistance at 105.51. This is the 23.6% Fibonacci retracement of last year’s bullish move that spanned from that July-October period noted above.
With bulls pushing a higher-high, this sets up that prior resistance as fresh support potential. And given the size of the run, a bullish bias can remain even with a deeper pullback towards the 104.38 or 104.21 levels.
U.S. Dollar Daily Price Chart
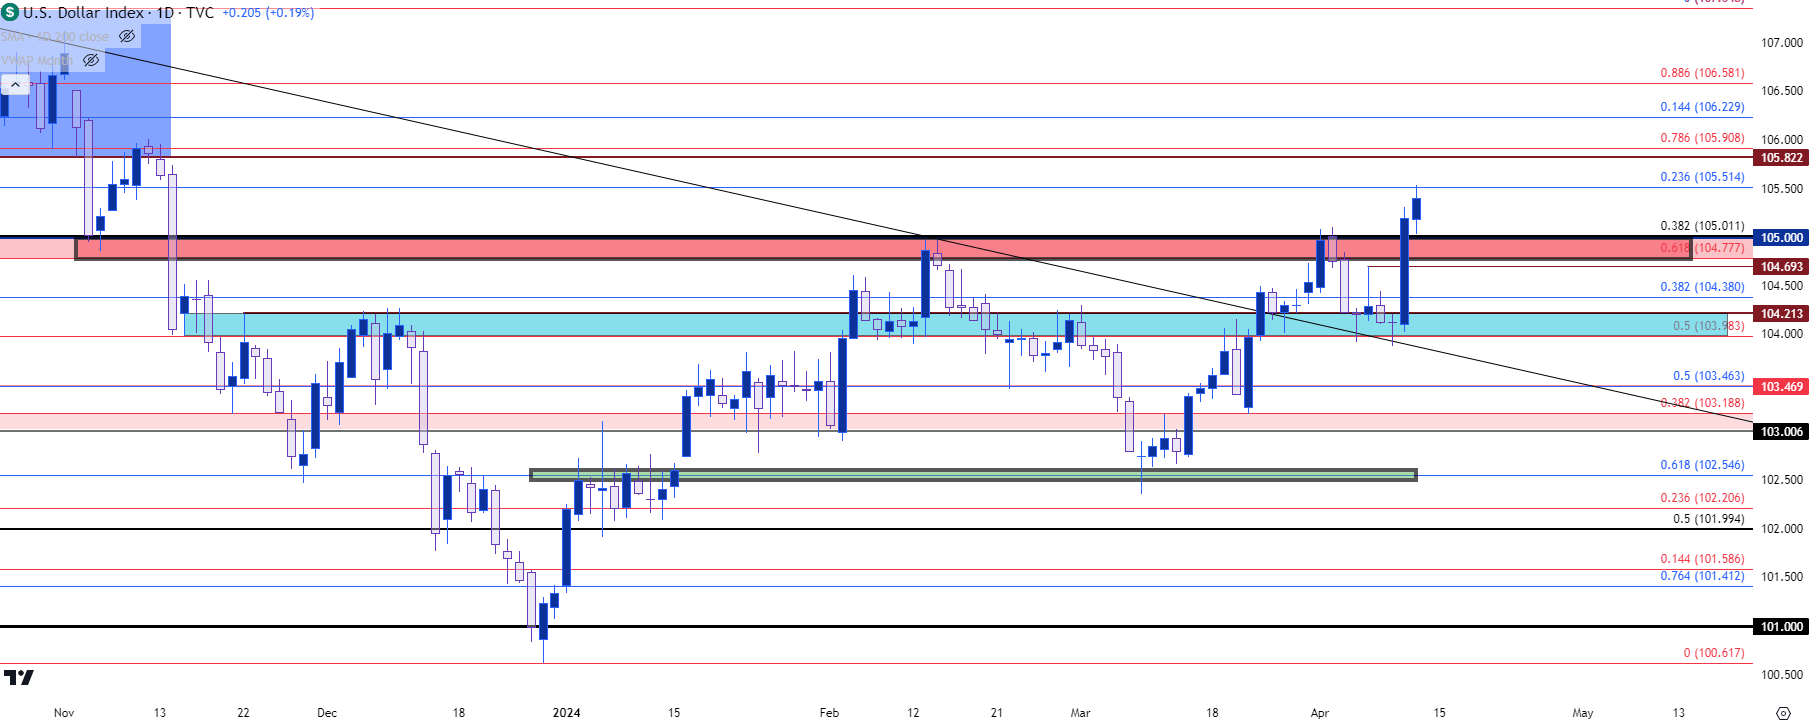 Chart prepared by James Stanley; data derived from Tradingview
U.S. Dollar Longer-Term
From the big picture, this bounce has shown at a major spot on the chart. The past three weeks have seen support from a prior trendline of resistance. The 105-handle had two holds over the past two months, and this highlights the 106.61 Fibonacci level that helped to hold the highs last year.
U.S. Dollar Weekly Chart
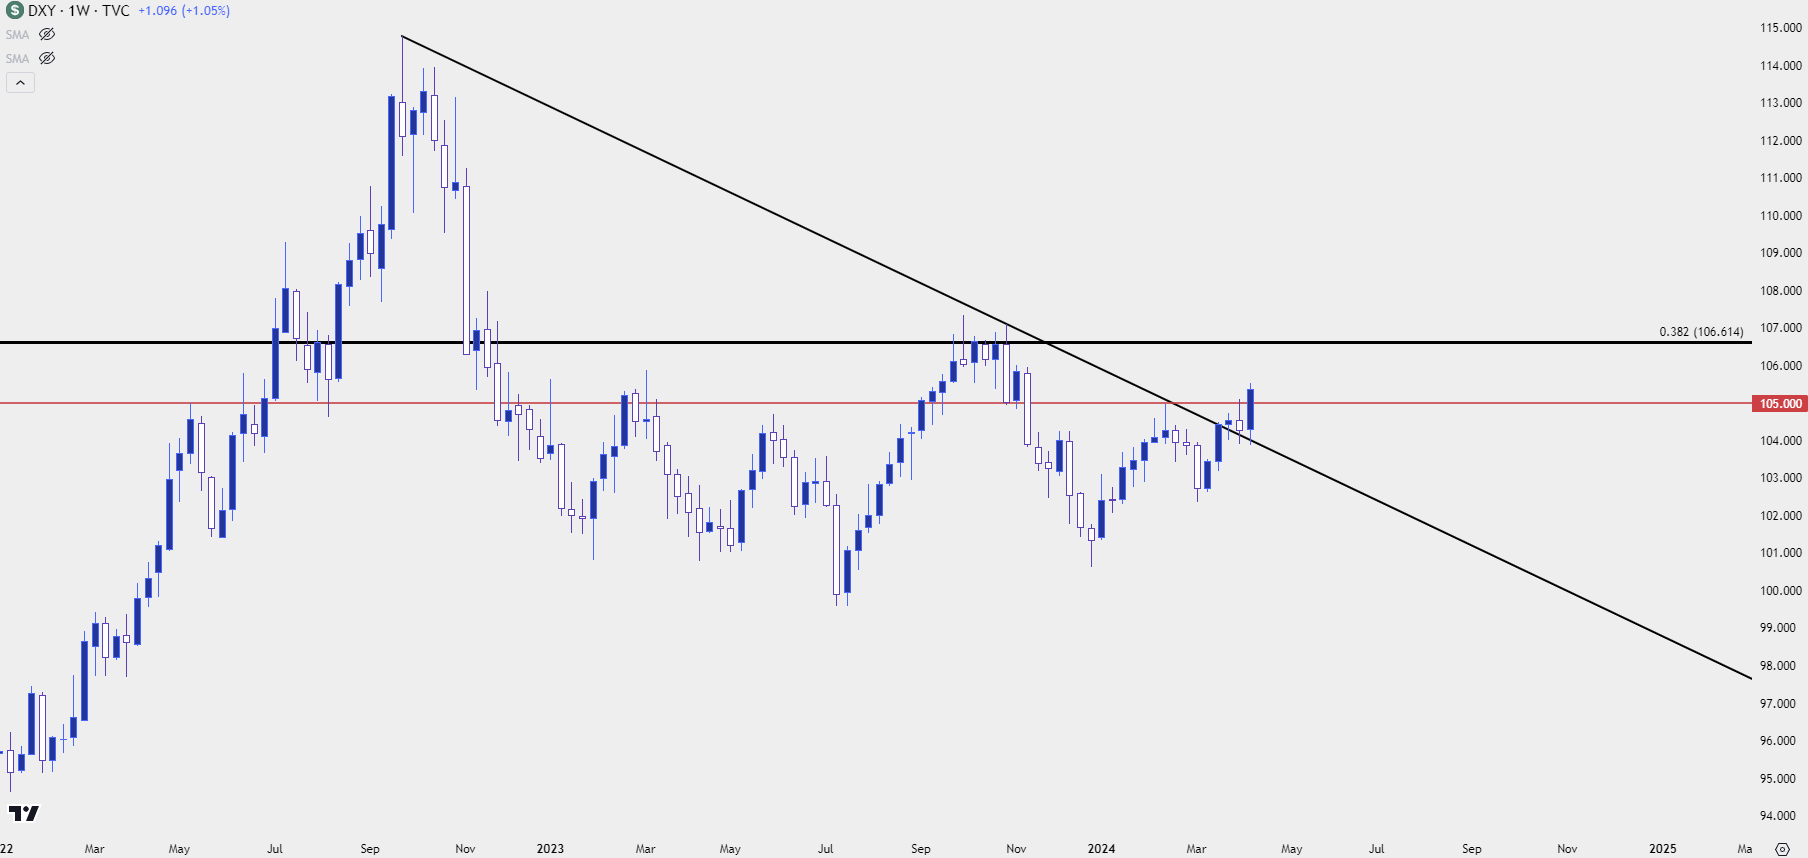 Chart prepared by James Stanley; data derived from Tradingview
Nasdaq 100
In the Q2 Forecast for Equities, I highlighted pullback potential and there’s a few reasons behind that. The fundamental backdrop is a factor, to be sure, but there’s other technical criteria that remains of interest for such. As an example, weekly RSI in S&P 500 Futures hit the 80-level, which is rare, as that’s only happened one other time in the past 24+ years with one other close call (just before the pandemic was priced-in).
There were also rising wedges that had built in stocks, which are often approached with a bearish aim. And in the Nasdaq 100, there’s also a double top formation which is similarly a bearish scenario, if it comes into play.
The neckline for the double top plots at 18k and so far this week, that support remains untested. There’s been a hold of last week’s low at 18,053 and that has since led to a bounce. But the bigger question is whether sellers continue to offer resistance and we saw that yesterday at the 18,477 level that helped to set the daily high. There’s also context for resistance below that, from the prior price swing around 18,377. And another above that level at 18,568.
Nasdaq 100 Daily Price Chart
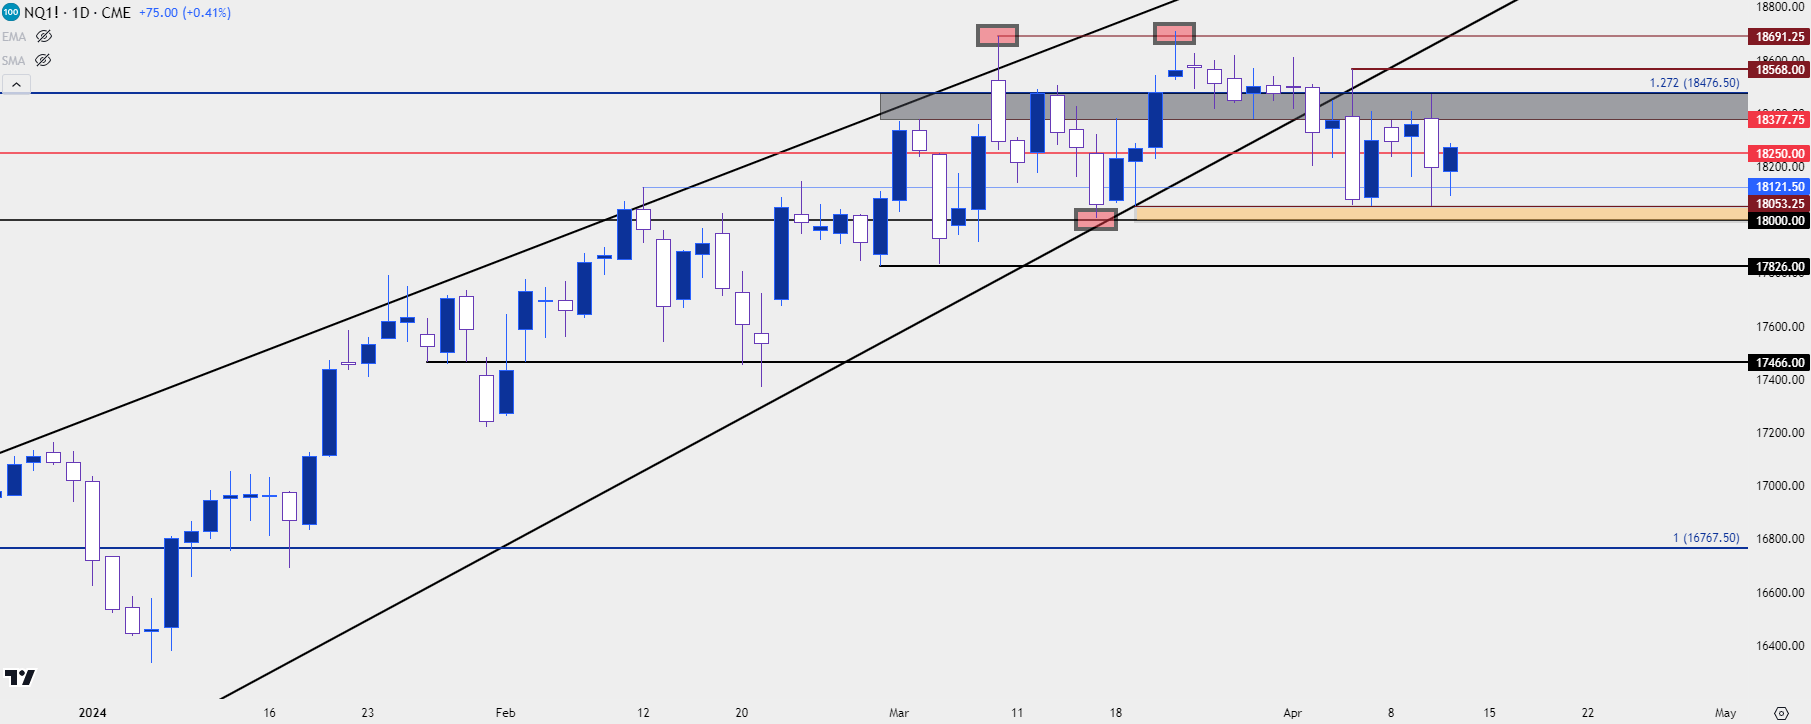 Chart prepared by James Stanley; data derived from Tradingview
S&P 500
The bullish run from last October’s lows was incredibly smooth and consistent, with price funneling higher-and-higher into the rising wedge pattern.
It was also almost a perfect 61.8% extension of the rally that started in the prior October.
S&P 500 Weekly Price Chart
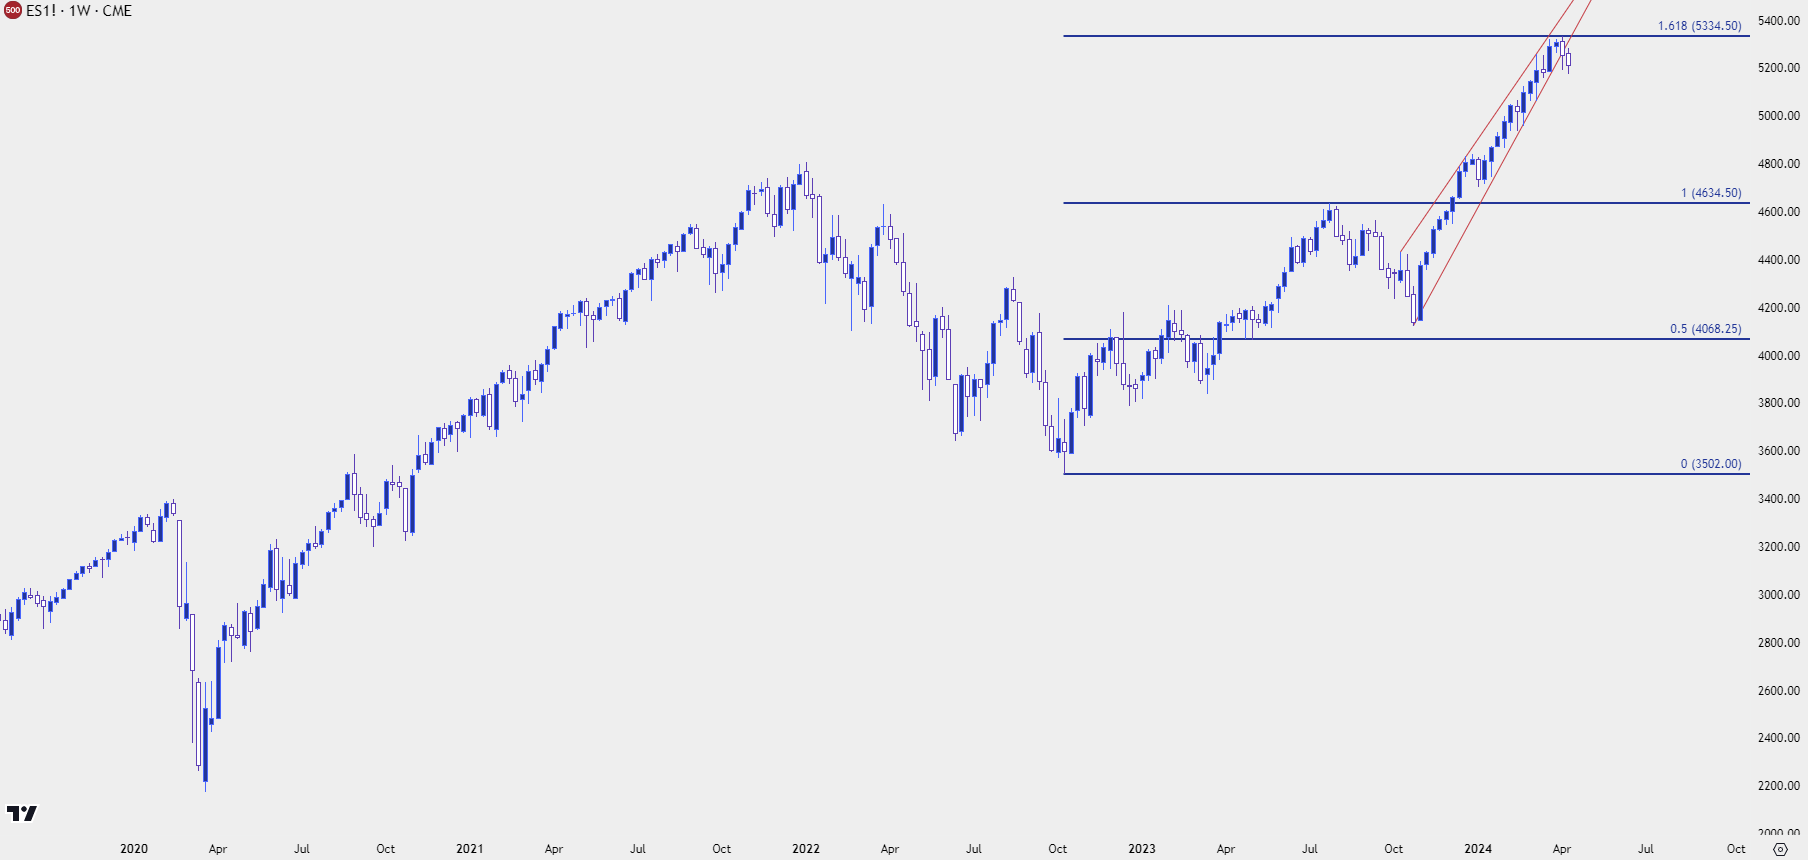 Chart prepared by James Stanley; data derived from Tradingview
S&P 500
Over the past week there’s been a couple of bearish drivers in the mix and that’s already played a role in near-term price action. Yet, at this stage, sellers haven’t been able to take control for long as price continues to hold support at a prior area of resistance, spanning from around 5157 up to the 5200 handle.
Last week’s remark from Neel Kashkari got considerable attention as he said that the Fed may not be able to cut this year given data. That led to a fast push down to 5200, but other Fed members haven’t sounded so certain with a still generally-dovish lean in many of those speeches; and I think that’s a reason that price has so far held up at this support.
If CPI beating the expectation for three consecutive months, while spending the past six months within a 0.2% band of the 4% marker, isn’t enough to shift FOMC members’ opinions, the another month of higher-than-expected inflation near 4% might not be enough to do it either. It becomes clear at that point that there’s another bias to consider. This isn’t to say that the Fed won’t change but, just like we saw with the ‘transitory’ episode, they can resist the data for only so long until either they change their stance, or the data begins to go their way. But much like we saw with the reaction to Kashkari’s comment last week, if or when that does shift, the response could be notable.
So, oddly, it seems that the Fed would be cheering on higher levels of unemployment in the U.S. as softness in the labor market would be one of those items that could allow them to cut even with elevated inflation. Otherwise, such as we saw with transitory and much like we heard from Mr. Kashkari – the Fed may not be able to cut this year. And if inflation remains strong, they may be forced to hike again. And even the prospect of such could begin to change the picture for equities very quickly.
But, at this point, price is still holding support and while there remains bearish potential, it’s merely potential until sellers start to take that next step. I’m tracking deeper support around the 5067 level and then another around 4954. The 5k level is worth of consideration as well for under-side support.
S&P 500 Daily Price Chart
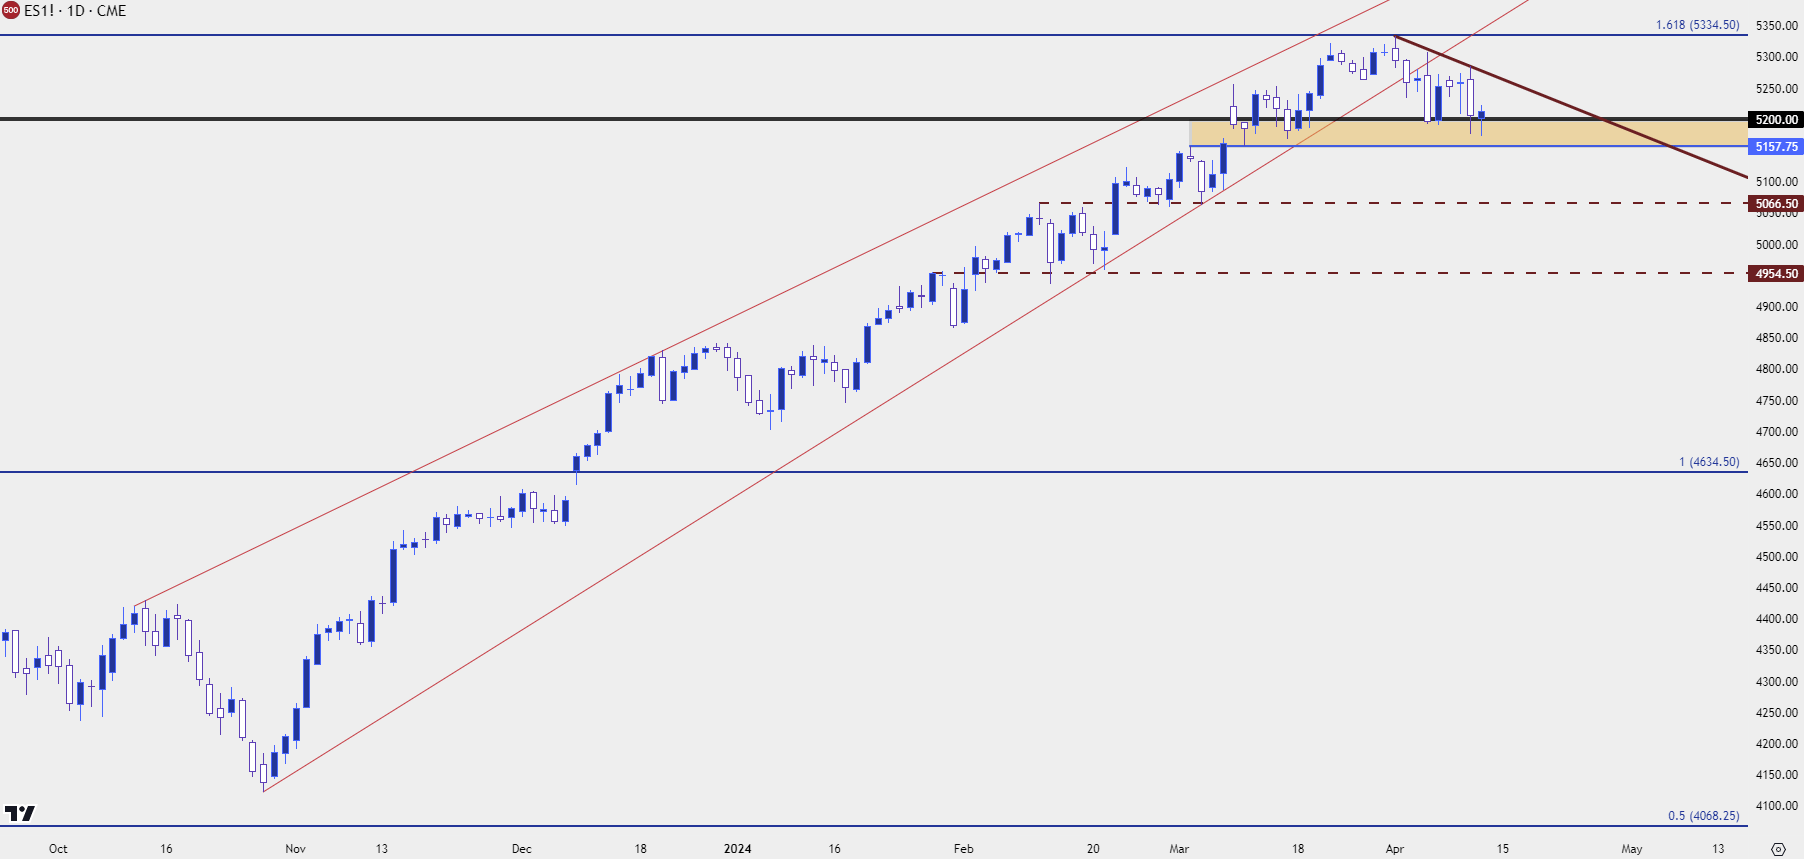 Chart prepared by James Stanley; data derived from Tradingview
--- written by James Stanley, Senior Strategist


