US Dollar talking points:
- This morning’s NFP report came with a blowout headline number of +336k against an expectation of +170k, and last month’s data was revised up to +227k from a prior read of +187k. All-in-all, that makes for a massive beat of the headline number.
- This illustrates continued strength in US labor markets which has seemed to become a hindrance to the Fed’s stance as inflation remains elevated. This brings further question to the possibility of rate cuts next year.
- Despite this seemingly open door for USD bulls, the US Dollar has pulled back on the news after an initial show of strength. This highlights how overbought the USD was coming into this morning’s report, along with related scenarios of oversold conditions in EUR/USD, Gold and SPX.
US Dollar bulls had a very obvious excuse to run with a breakout this morning after the release of Non-farm Payroll. The headline number printed to a massive beat, coming in at +336k against an expectation of +170k, and the initial move was even showing strength after the release. But bulls began to struggle as the 107 level came near in DXY and that started to allow for a pullback to show.
In a related matter, EUR/USD tested below 1.0500 again, but similar to what was seen earlier this week, the selling seemed to stall below the big figure and this led into a snapback move as prices breached above a falling wedge formation. I had talked about this setup at length on Tuesday and much of that analysis remains relevant today, with this morning’s bounce appearing to be related to an oversold backdrop that had built over the past two months.
Whether that pullback in EUR/USD turns into something more remains a valid question, and next week’s economic calendar sees the focus tilt back towards inflation with the Thursday release of CPI numbers, with both core and headline CPI expected to contract.
EUR/USD Four-Hour Chart

Chart prepared by James Stanley, EUR/USD on Tradingview
But, as we can see from this morning’s reactions, market prices don’t always display a direct and logical response to economic data. The NFP report was very hot on the headline number and while the supporting details of Average Hourly Earnings and the unemployment rate weren’t necessarily as hot, they also weren’t extremely negative. Average Hourly Earnings came in at 4.2% YoY against a 4.3% expectation and the unemployment rate was at 3.8% against a 3.7% expectation. So, slight misses on both of those data points but the unemployment rate can be further explained by a rise in the participation rate which edged up to 65.6% from last month’s 65.5% read.
In that Tuesday webinar I had highlighted just how quickly this theme of fear has priced-in since the September FOMC rate decision, and gold is a prime example of that, which went into a deeply oversold state earlier this week. This highlights a positioning quandary because fundamentals don’t always have a direct manifestation in market prices. The medium that connects the two are market participants, and this can show as a ‘good news brings higher prices’ type of theme – but what happens when everyone that wants to be long in a market already is, and there’s nobody left on the sideline to buy?
Even if the news is great – if there’s no additional demand to push higher prices, well, we can start to see prices pulling back. And then when you have falling prices even after good news, this can create more motivation from bulls holding longs to close positions, and keep in mind that there are probably some stops along the way and as those get triggered – more supply comes into the market.
This is why sentiment is so incredibly important. Fundamentals can influence market prices, but the medium that makes that happen is market participants and if they’re already heavily long in a market, well then continued price gains can become a challenge, even with ‘good’ data.
This seems to at least partially explains the backdrop in the US Dollar. The currency has gained for 11 consecutive weeks, which is rare as it’s only happened one other time in the past decade. There’s been only minor pullback along the way, and this has come along with a mirror image theme in EUR/USD, which moved from a fresh yearly high in July to an oversold reading in late-September. This morning’s reaction appears to be related to the fact that the trade has become quite crowded on the way up, and the lack of a fresh high on the back of a strong headline NFP number has created motivation for bulls to protect profits, which can lead to selling and pullbacks.
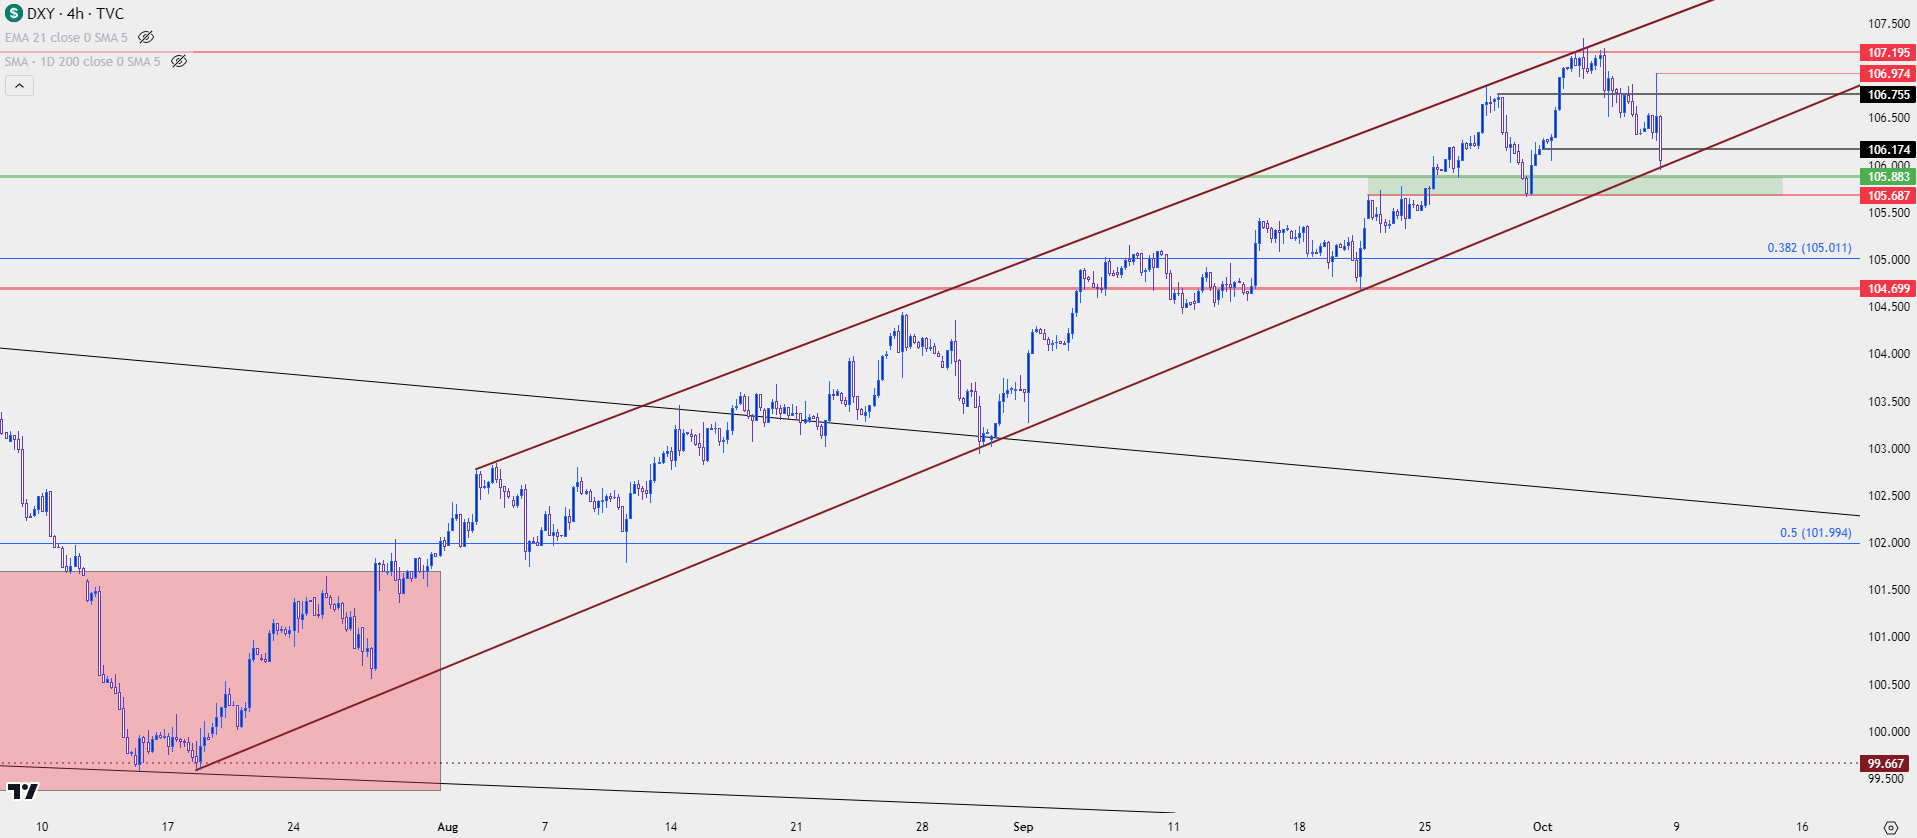
Healthy trends usually display two-way action and there was a dearth of that in the USD of late, as we’ve seen the currency gain for 11 straight weeks after bears failed to run with the breakdown test in July. The question now is where and whether bulls show back up to continue the trend. At this point, the US Dollar is testing support as taken from a bullish trendline drawn from the July low. And just below that is a key zone of support that runs from prior swings at 105.69-105.88.
US Dollar - DXY Four-Hour Price Chart (indicative only, not available on Forex.com platforms)

Chart prepared by James Stanley; data derived from Tradingview
Bigger Picture Trend
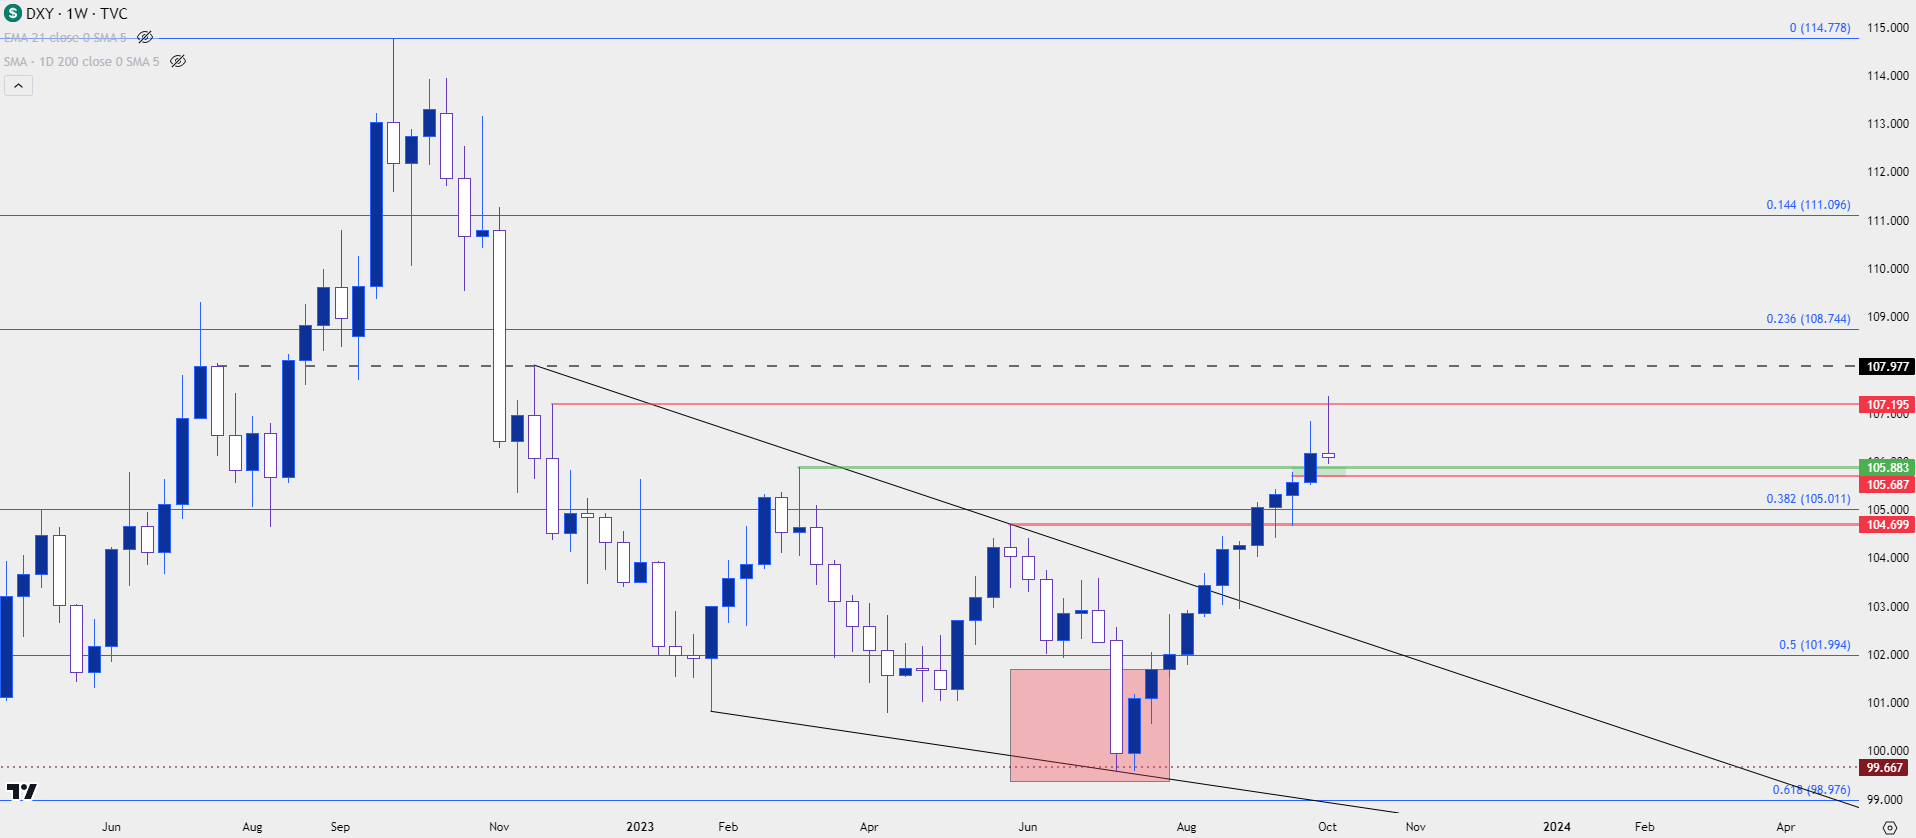
Given the reaction to this morning’s report, combined with the prospect of the first weekly loss in almost three months, the question must be asked whether a larger pullback in the US Dollar is on the horizon. The answer to that question can start to see some definition based on how bulls react to support in the early portion of next week, and depending on how that goes, there may be scope for a bullish reaction to the CPI report should the data come out above expectation.
Below, I’m taking a look at the weekly chart which has not yet completed, as of this writing. The current weekly bar is red but also somewhat indecisive, showing as a gravestone doji. If sellers do push into the close to move down towards that support at 105.69-105.88, this will start to take on more of a shooting star look, which is often approached with the potential for bearish reversals. If bulls can eek out a gain to amount to a 12th week, even with indecision in that weekly candle, this could retain pullback potential given that a show of indecision after a strong streak of gains can be seen as a possible pullback point in the trend.
US Dollar - DXY Weekly Price Chart (indicative only, not available on Forex.com platforms)

Chart prepared by James Stanley; data derived from Tradingview
USD Strategy for Next Week
The CPI report on Thursday is the big item but there are other high impact prints and items for FX traders to keep track of on the US Dollar. There’s a plethora of Fed-speak items to work through, and over the past week the comments from Mary Daly really seemed to get the market’s attention. For next week, I’m tracking high-impact drivers for each day of the week, shown on the table below. Please note, this is not an exhaustive list as other USD drivers may appear, but this is what I'm focused on going into next week.
High-Impact USD Drivers Scheduled for the Week of October 9th, 2023

Table prepared by James Stanley
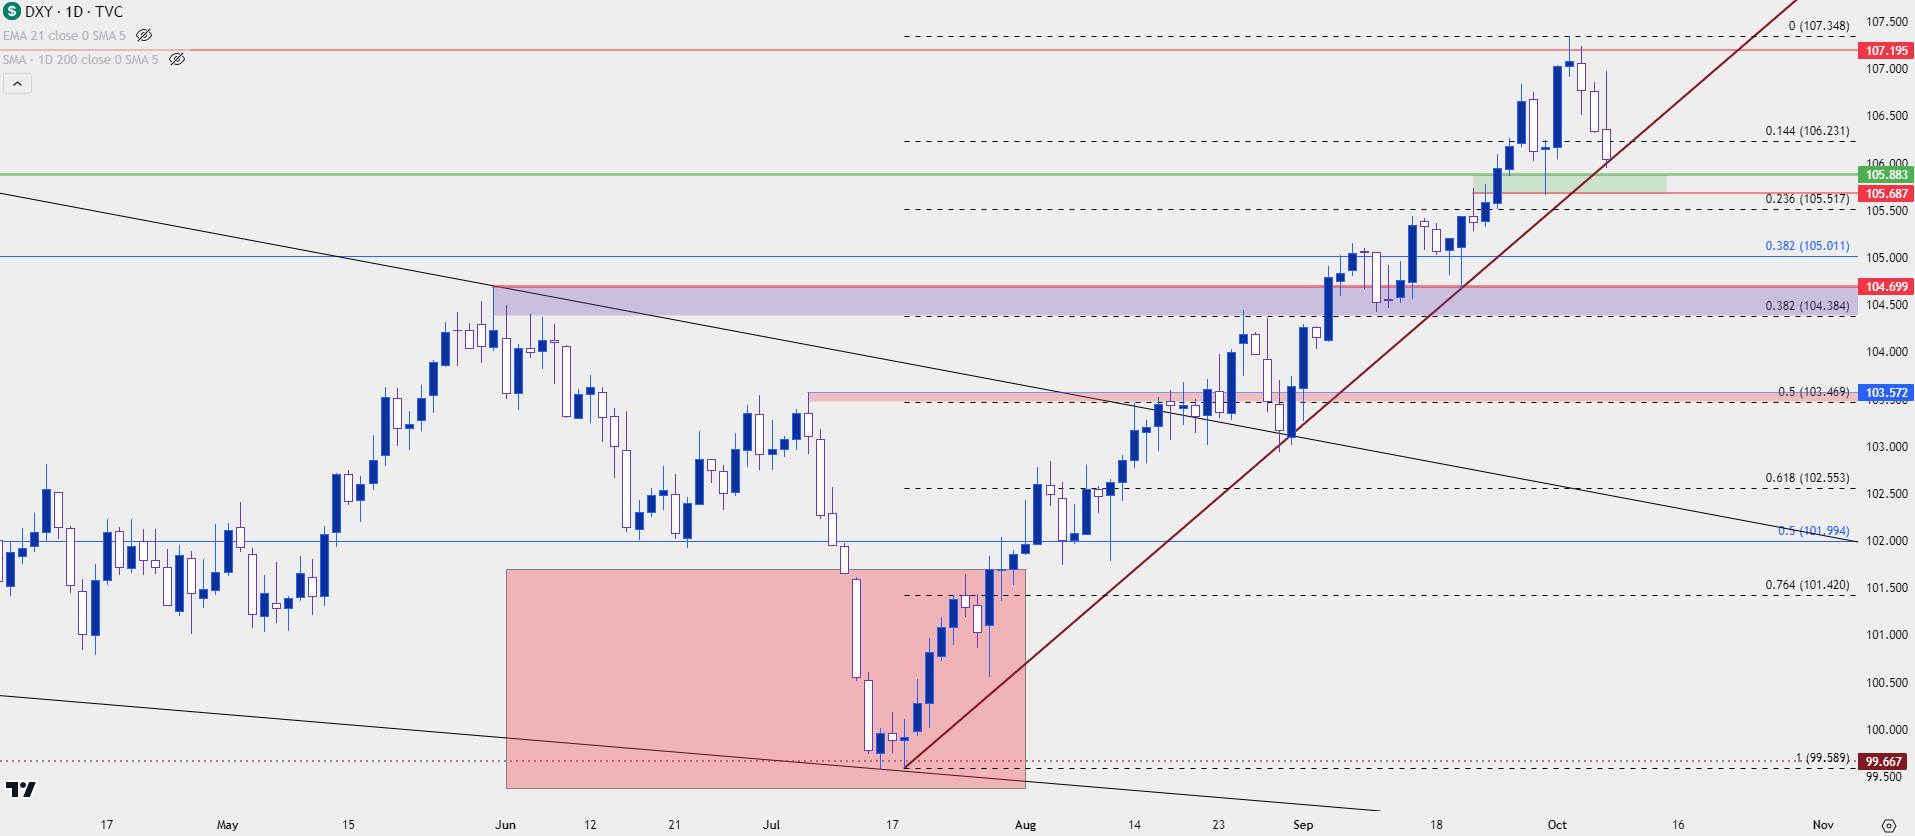
In the US Dollar, the big question is whether and where bulls might return and given how stretched the trend has become over the past few months, we could see an extended pullback while still retaining a bigger picture bullish trend. There’s a nearby spot of prior resistance just underneath the trendline, and this runs from 105.69-105.88. Below that, the 23.6% retracement of the recent bullish move is at 105.52. Below that, the 105 level is of note as this is confluent, with both the 38.2 Fibonacci retracement of the 2021-202 move as well as being a major psychological level.
There’s another key spot below that running from 104.38-104.70. The former price is the 38.2% retracement of the recent breakout while the latter price was the swing-low from Fed day on top of being a prior spot of support.
If bears can test below that zone, the prospect of reversal will begin to look more likely, with focus then shifting to 103.50, which is home of both a prior swing high and the 50% mark of the breakout.
If bulls can regain control, 107.20 remains as key resistance, and a breach above that exposes another key level at the 108 handle.
US Dollar - DXY Daily Price Chart (indicative only, not available on Forex.com platforms)

Chart prepared by James Stanley; data derived from Tradingview
--- written by James Stanley, Senior Strategist


