US Dollar Index Technical Outlook: USD Short-term Trade Levels
- US Dollar plunges into April downtrend support- threatens larger recovery
- USD rebound approaching initial downtrend resistance- threat for price inflection in the days ahead
- Resistance 103.49/67, 104.07, 104.61/80 (key)- Support 102.87/99, 102.05/20 (key), 101.41
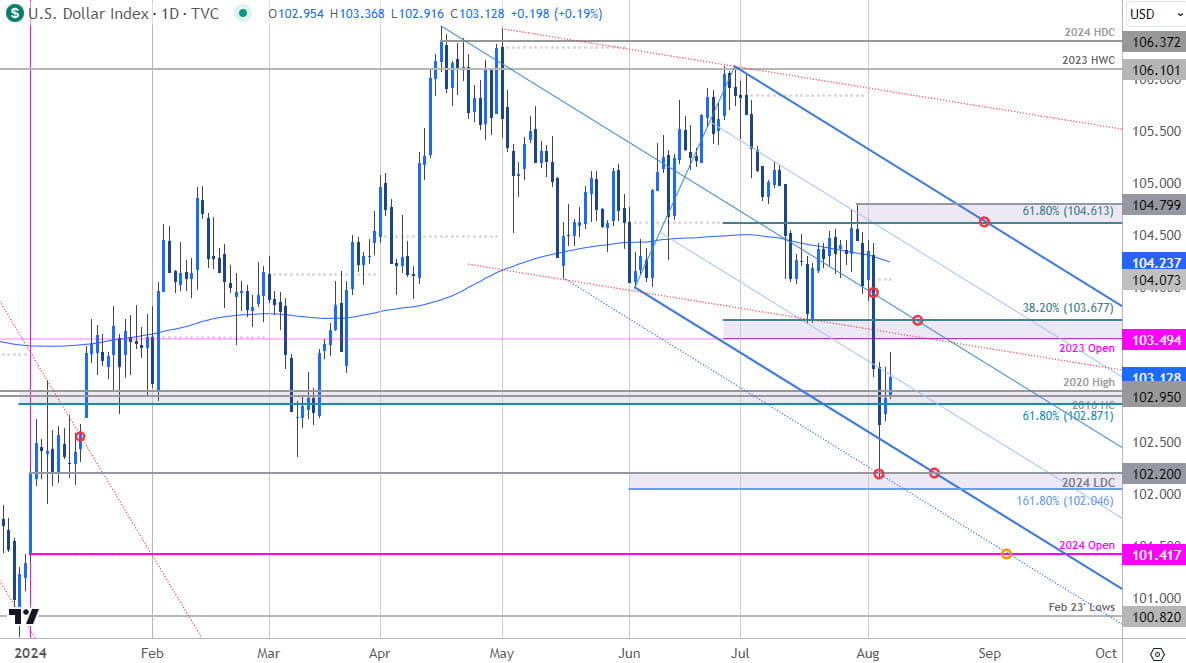
The US Dollar Index plunged more than 3.7% off the June highs with DXY rebounding this week off multi-month downtrend support. USD has already recovered nearly 1.2% off the lows and the immediate focus is on a possible test of downtrend resistance for guidance here. Battles lines drawn on the DXY short-term technical charts.
Review my latest Weekly Strategy Webinar for an in-depth breakdown of this US Dollar technical setup and more. Join live on Monday’s at 8:30am EST.
US Dollar Index Price Chart – USD Daily

Chart Prepared by Michael Boutros, Sr. Technical Strategist; DXY on TradingView
Technical Outlook: In last month’s USD Short-term Outlook, we noted that DXY was, “approaching confluent support and the focus is on possible downside exhaustion / price inflection into 103.49/60. From a trading standpoint, a good zone to reduce portions of short-exposure / lower protective stops- rallies should be limited to 105 IF price is heading lower on this stretch with a close below this pivot zone exposing more significant support near the March lows.”
The Dollar rallied more than 1.1% off those lows in the following days with DXY registering an intraday high at 104.80 into the close of July before reversing sharply lower. The break below support accelerated a decline of more than 2.5% with the index rebounding off near-support on Monday at the 2024 low-day close (LDC) near 102.20. Note that price failed to mark a daily close below the lower parallel and the threat remains for a test of downtrend resistance back near the July lows.
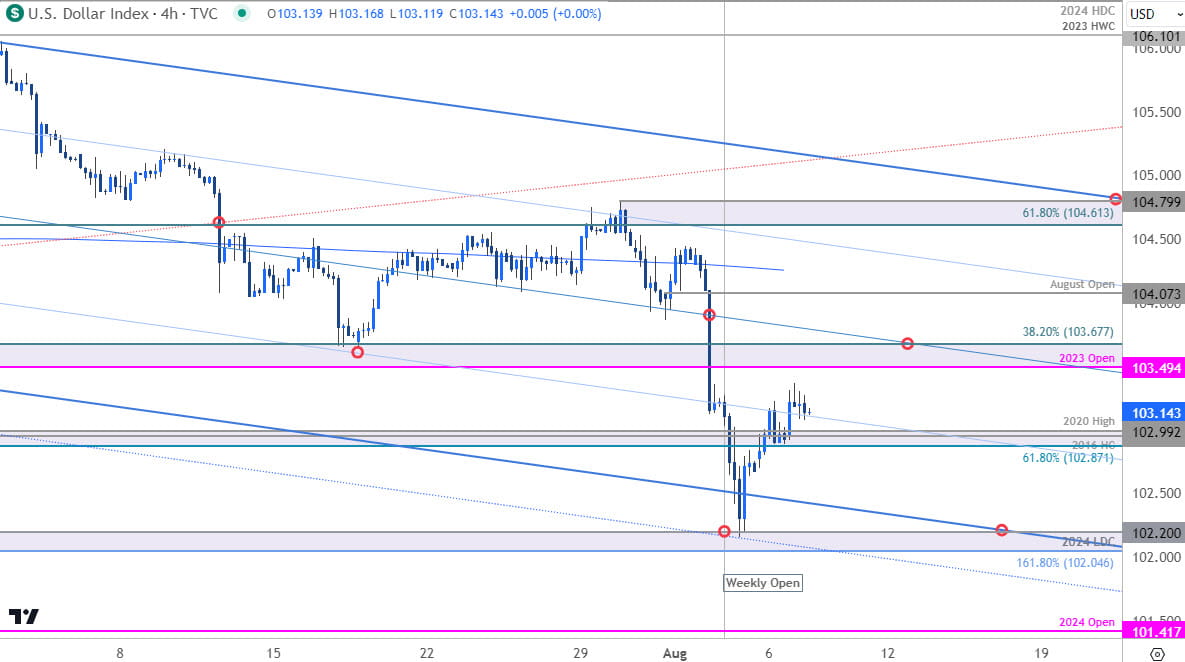
US Dollar Index Price Chart – USD 240min

Chart Prepared by Michael Boutros, Sr. Technical Strategist; DXY on TradingView
Notes: A closer look at USD price action shows DXY continuing to trade within the confines of the descending pitchfork we’ve been tracking off the April/June highs - a sliding parallel (dotted blue) extending off the May low further highlighting key support at the 1.618% extension of the Aril decline / 2024 low-week close at 102.05/20. The Dollar has already rallied nearly 1.2% off these lows and the bears remain vulnerable near-term while above this threshold.
Initial resistance is eyed at the 2023 yearly open / 38.2% retracement of late-June decline at 103.49/67 and is backed by the objective August-open a 104.07 (note the 200DMA just higher). Broader bearish invalidation is now set to the 61.8% Fibonacci retracement / late-July high at 104.61/80- a breach / close above this threshold would be needed to suggest a larger trend reversal is underway.
Initial support rests at 102.87/99- a region defined by the 61.8% retracement of the December rally, the 2016 high-close (HC) and the 2020 high. Ultimately, a break below 102 would be needed to mark downtrend resumption towards the objective yearly open at 101.41- look for a larger reaction there IF reached.
Bottom line: The US Dollar has responded to confluent downtrend support and the focus is on this near-term recovery. From a trading standpoint, the focus is on possible topside exhaustion / price inflection into 103.49/67 – ultimately, rallies would need to be limited to the 200DMA IF price is heading lower on this stretch with a break below 102 needed to mark resumption. That said, the potential for a larger turn remains and a close above the median-line would suggest a more significant low was registered this week.
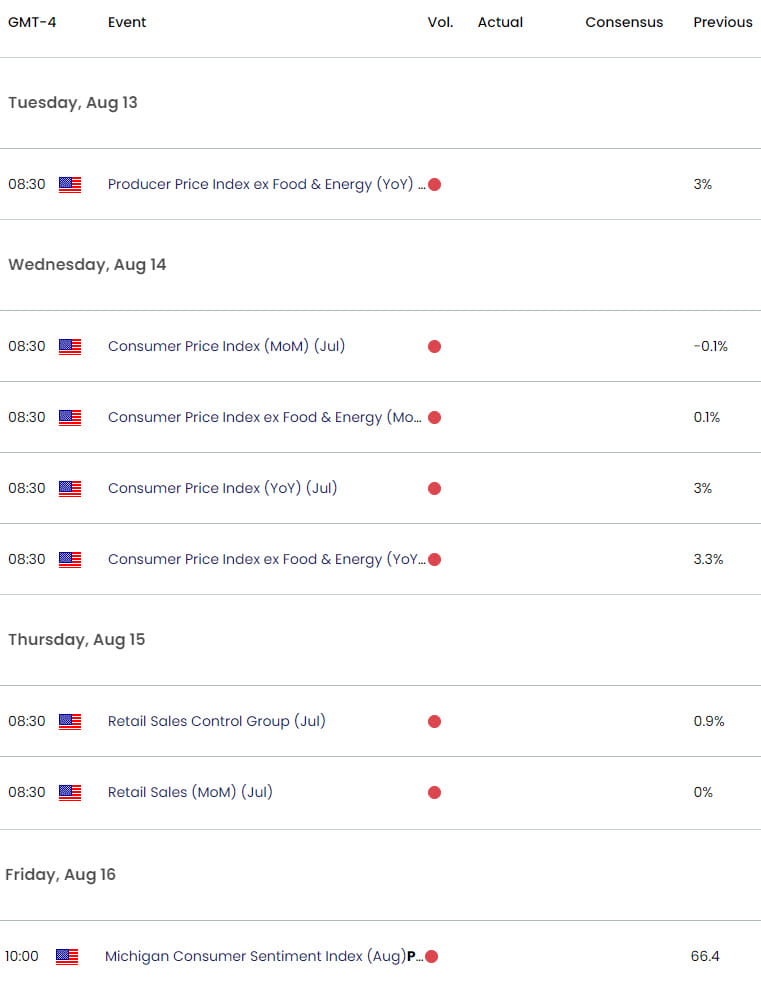
Keep in mind we get the release of key US inflation data next week with July Consumer Price Index (CPI) on tap Wednesday. Stay nimble into the release and watch the weekly closes here for guidance. Review my latest US Dollar Weekly Forecast for a look at the longer-term DXY technical trade levels.
Key US Economic Data Releases

Economic Calendar - latest economic developments and upcoming event risk.
Active Short-term Technical Charts
- Australian Dollar Short-term Outlook: AUD/USD Defends 2024 Low
- Euro Short-term Technical Outlook: EUR/USD at Make-or-Break Resistance
- British Pound Short-term Outlook: BoE Rate Cut Drives GBP/USD into Support
- Gold Short-term Technical Outlook: XAU/USD Bulls Get Tested
- Canadian Dollar Short-term Outlook: USD/CAD Rally Rips to Resistance
Written by Michael Boutros, Sr Technical Strategist with FOREX.com
Follow Michael on X @MBForex


