US Dollar Index Technical Outlook: USD Short-term Trade Levels
- US Dollar rallies more than 1.3% off September low / confluent support
- USD monthly / weekly opening-range breakouts imminent- Fed on tap next week
- Resistance 101.73, 102.20, ,102.80/99(key)- Support 101.18, 100.61/82(key), 99.95
The US Dollar Index rebounded off technical support into the close of August with the September opening-range now set just above. While the broader outlook remains weighted to the downside, the broader decline may be vulnerable near-term and we’re looking for a breakout to offer guidance heading into next week’s Fed rate decision. Battles lines drawn on the DXY short-term technical charts.
Review my latest Weekly Strategy Webinar for an in-depth breakdown of this US Dollar technical setup and more. Join live on Monday’s at 8:30am EST.
US Dollar Index Price Chart – USD Daily

Chart Prepared by Michael Boutros, Sr. Technical Strategist; DXY on TradingView
Technical Outlook: In last month’s USD Short-term Outlook, we noted that DXY had broken, “below a major support pivot last week and the onus is on the bears to hold this position- watch for a break of the weekly opening-range for guidance here.” Those lows held with a breakout just days later fueling a rally of more than 1.3% into the monthly cross.
A quick test of the lows / key support again last week has been defended with the September opening-range taking shape just above – looking for the breakout to offer guidance here with the broader April downtrend vulnerable while above the December low / February 2023 lows at 100.61/82.
US Dollar Index Price Chart – USD 240min

Chart Prepared by Michael Boutros, Sr. Technical Strategist; DXY on TradingView
Notes: A closer look at USD price action shows the index trading within an embedded ascending pitchfork formation extending off the recent lows. Note that the weekly opening-range is now set just above the weekly open at 101.18. Ultimately, a break / daily close below 100.61 is needed to mark downtrend resumption with subsequent support objective eyed at the 2023 low-day close (LDC) and 99.95 and the 2019 high at 99.66.
Monthly-open resistance is eyed at 101.73 with a breach of the weekly opening-range highs needed to fuel the next leg higher towards the January LDC at 102.20 and critical resistance at 102.80/99 – a region defined by the 38.2% Fibonacci retracement of the April decline, the 2016 high-close (HC) and the 2020 swing high. (both regions of interest for possible topside exhaustion / price inflection IF reached).
Bottom line: The US Dollar Index has rebounded off confluent downtrend support and threatens a larger bear-market correction in the days ahead. The immediate focus is on a breakout of the weekly / monthly opening-ranges for guidance. From a trading standpoint, pullbacks should be limited to t the weekly open IF price is heading higher on this stretch with a close above the median-line needed to fuel the next leg in price.
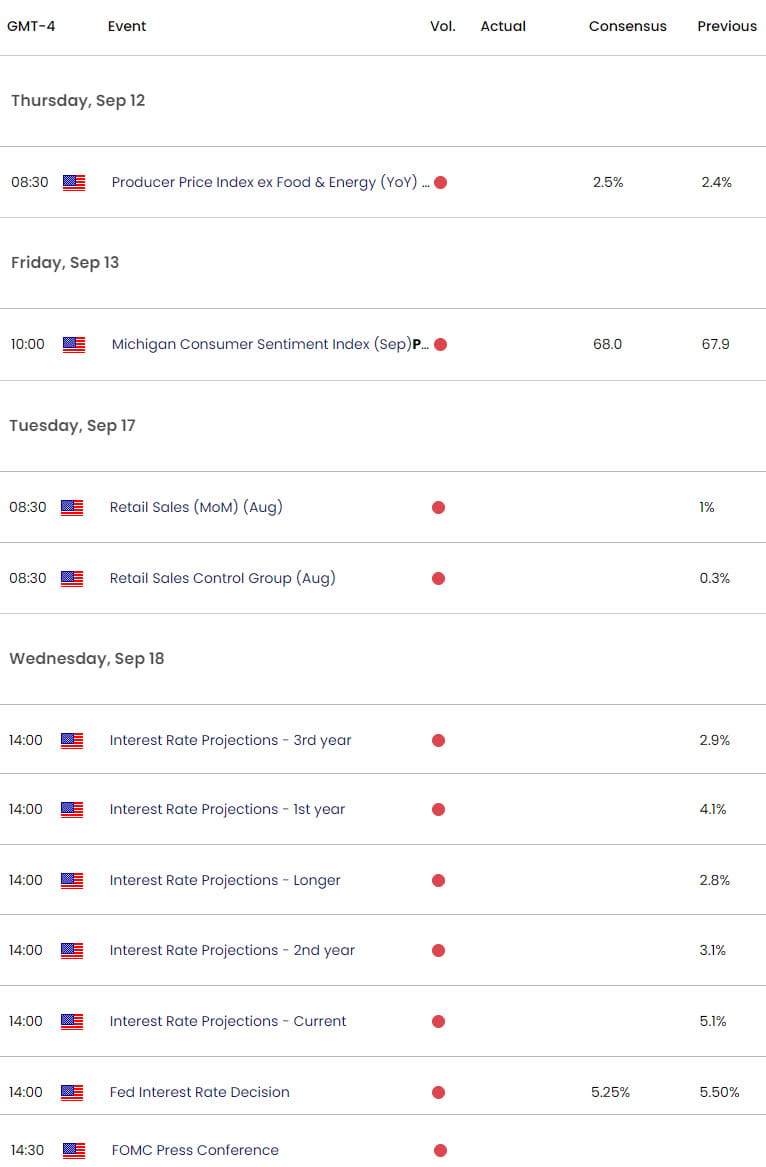
Keep in mind the highly anticipated FOMC interest rate decision is on tap next week with market participants widely expecting a 25bps cut from Powell & Co. Stay nimble into the release and watch the weekly close here for guidance. Review my latest US Dollar Weekly Forecast for a look at the longer-term DXY technical trade levels.
Key US Economic Data Releases

Economic Calendar - latest economic developments and upcoming event risk.
Active Short-term Technical Charts
- Canadian Dollar Short-term Outlook: USD/CAD Rebound Eyes First Hurdle
- British Pound Short-term Outlook: GBP/USD Poised for Breakout
- Gold Short-term Technical Outlook: XAU/USD Slips into Support
- Australian Dollar Short-term Outlook: AUD/USD into Resistance
- Euro Short-term Technical Outlook: EUR/USD Threatens Correction
Written by Michael Boutros, Sr Technical Strategist with FOREX.com
Follow Michael on X @MBForex


