US Dollar Index Technical Outlook: DXY Short-term Trade Levels
- US Dollar Index nine-week rally testing major resistance zone into yearly highs
- USD bulls vulnerable into Fed rate decision– broader outlook remains constructive
- DXY Resistance 105.38/63 (key), 105.88, 106.57- Support 104.53, 104.23, 103.47/49
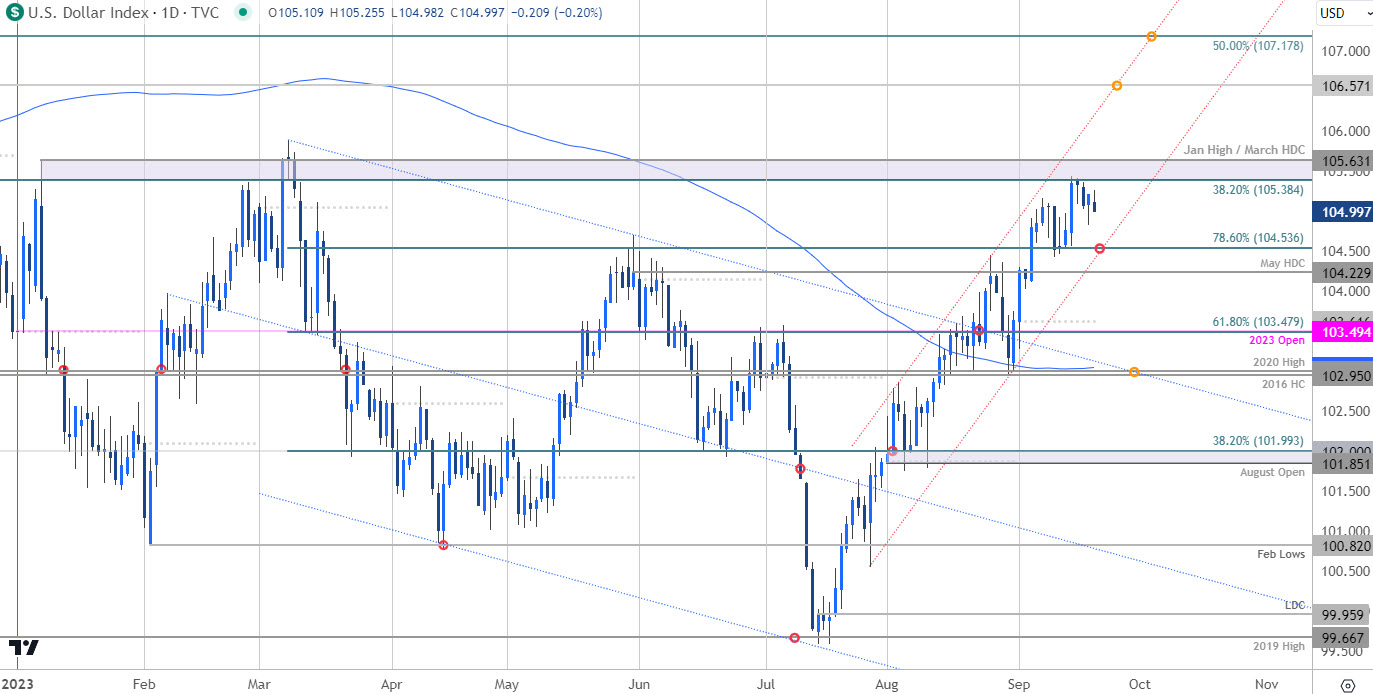
The US Dollar Index surged nearly 5.9% off the yearly lows with a stunning nine-week rally taking DXY into technical resistance at the 2023 opening-range highs. The stage is set heading into today’s highly anticipated FOMC interest rate decision as a multi-month uptrend hangs in the balance. These are the updated targets and invalidation levels that matter on the USD short-term technical charts into the Fed.
Review my latest Weekly Strategy Webinar for an in-depth breakdown of this US Dollar technical setup and more. Join live on Monday’s at 8:30am EST.
US Dollar Index Price Chart – DXY Daily

Chart Prepared by Michael Boutros, Sr. Technical Strategist; DXY on TradingView
Technical Outlook: In last month’s US Dollar Short-term Outlook, we noted that a dive-day rally had taken USD into, “confluent resistance at the yearly downtrend. From a trading standpoint, a good zone to reduce portions of long-exposure / raise protective stops – losses should be limited to July channel support IF price is heading higher on this stretch with a close above the July highs needed to mark resumption of the medium-term uptrend.” It was a messy breakout into the close of the month, but the index held support with the rally now extending into key resistance at the 2023 opening-range highs- FOMC on tap.
The resistance zone in focus is 105.38/63- a region defined by the 38.2% Fibonacci retracement of the 2022 decline, the January high and the March high-day close. Note that USD has been marking continued momentum divergence into these highs and suggests the immediate advance may be vulnerable here- watch today’s close.
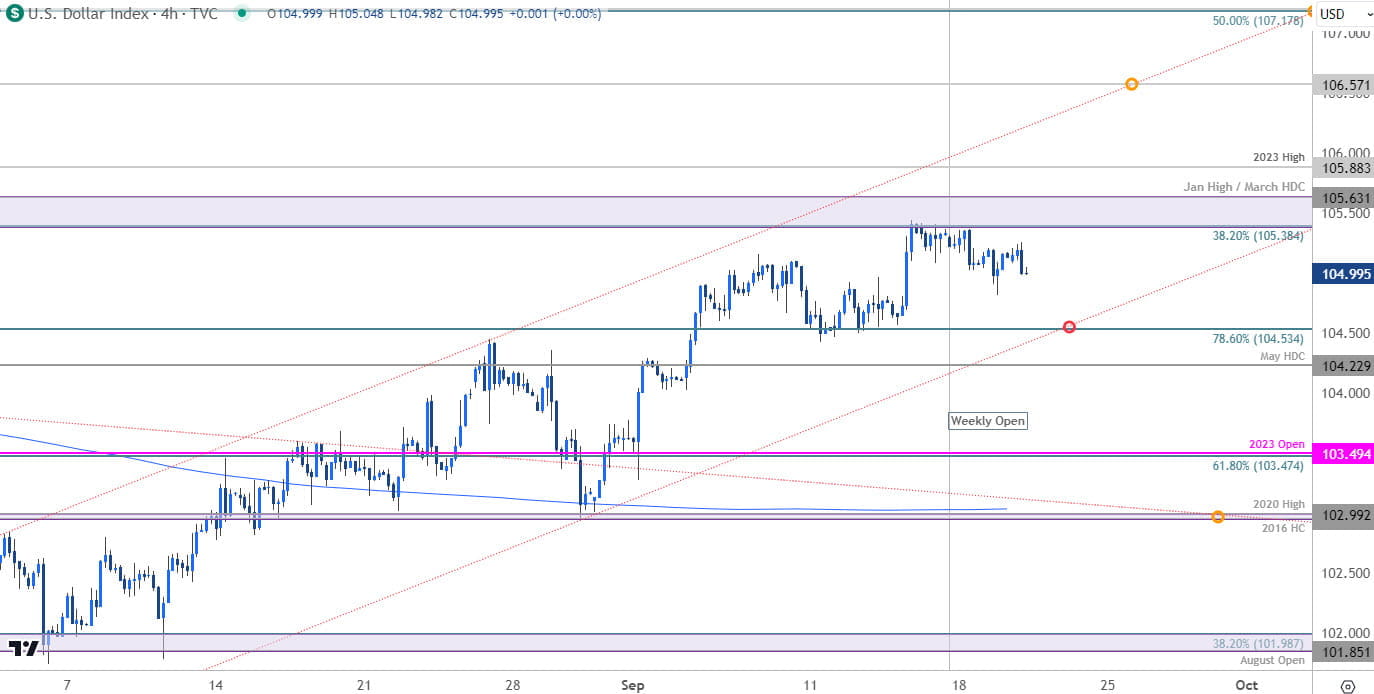
US Dollar Index Price Chart – DXY 240min

Chart Prepared b/y Michael Boutros, Sr. Technical Strategist; DXY on TradingView
Notes: A closer look at USD price action shows DXY carving the weekly opening-range just below the 105.38/63 resistance zone. Initial support is eyed at the lower parallel / 78.6% retracement of the yearly range at 104.53 and is backed closely by the May high-day close at 104.23- a break / daily close below this threshold would threaten a larger correction towards subsequent support objectives at 103.47/49 and broader bullish invalidation at 102.90/99.
Ultimately, topside breach / close above the March / yearly high at 105.88 is needed to mark resumption of the July rally with subsequent resistance objectives eyed at 106.57 and 107.17/20- look for a larger reaction there IF reached.
Bottom line: The US Dollar rally is trading into resistance at the yearly high on building momentum divergence with the FOMC interest rate decision on tap. From a trading standpoint, the threat remains for a deeper pullback within the broader July advance – losses should be limited to 104.22 IF price is heading higher on this stretch. Ultimately, a setback here may offer more favorable entries with a close above 105.88 needed to clear the way for the next leg higher in price. Review my latest US Dollar Weekly Technical Forecast for a longer-term look at the DXY trade levels.
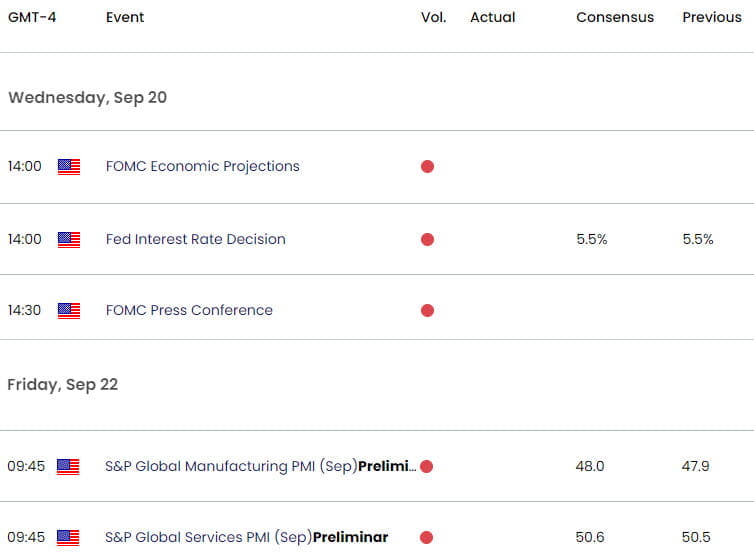
Key US Economic Data Releases

Economic Calendar - latest economic developments and upcoming event risk.
Active Short-term Technical Charts
- British Pound Short-Term Outlook: GBP/USD Probing Support
- Euro Short-term Outlook: EUR/USD Bears Halted Ahead of ECB, FOMC
- Canadian Dollar Short-term Outlook: USD/CAD Correction Underway
- S&P 500 Short-term Price Outlook: Gap Trap
- Crude Oil Short-term Outlook: Oil Spill Searches for Support
- Gold Price Short-term Outlook: XAU/USD Searches Support Sub-1900
--- Written by Michael Boutros, Sr Technical Strategist with FOREX.com
Follow Michael on Twitter @MBForex


