US Dollar Index technical outlook: DXY short-term trade levels
- US Dollar Index rebounds off downtrend support- threatens test of trend resistance
- USD bulls vulnerable into FOMC rate decision- ECB, NFPs on tap into weekly close
- DXY resistance 102.45/59, 102.95/99, 103.49– support 101.58/67, 101, 100.82
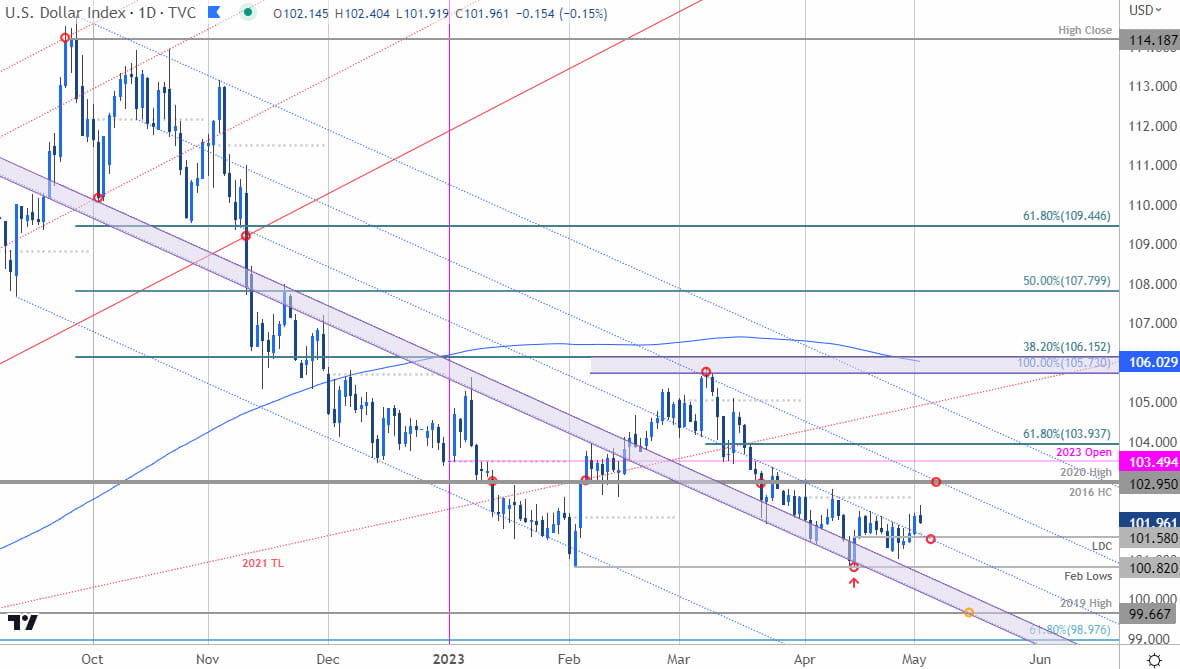
The US Dollar Index attempting to breakout of a multi-week downtrend after rebounding off downtrend support near the yearly lows. The levels are clear and its sink-or-swim for the bulls as we head into major event risk this week. These are the updated targets and invalidation levels that matter on the DXY short-term technical charts ahead of the Fed.
Discuss this USD setup and more in the Weekly Strategy Webinars on Monday’s at 8:30am EST.
US Dollar Index Price Chart – DXY Daily

Chart Prepared by Michael Boutros, Sr. Technical Strategist; DXY on TradingView
Technical Outlook: In my last US Dollar short-term outlook, we noted that a break of the April opening-range had taken “the DXY into the yearly lows at 100.82- a close below this threshold is needed to keep the immediate decline viable.” The index registered a low at 100.79 the following day before posting an outside-day reversal off fresh yearly lows. The subsequent rally stalled into slope resistance for the past nine-sessions before breaking out yesterday- is a more significant low in place?
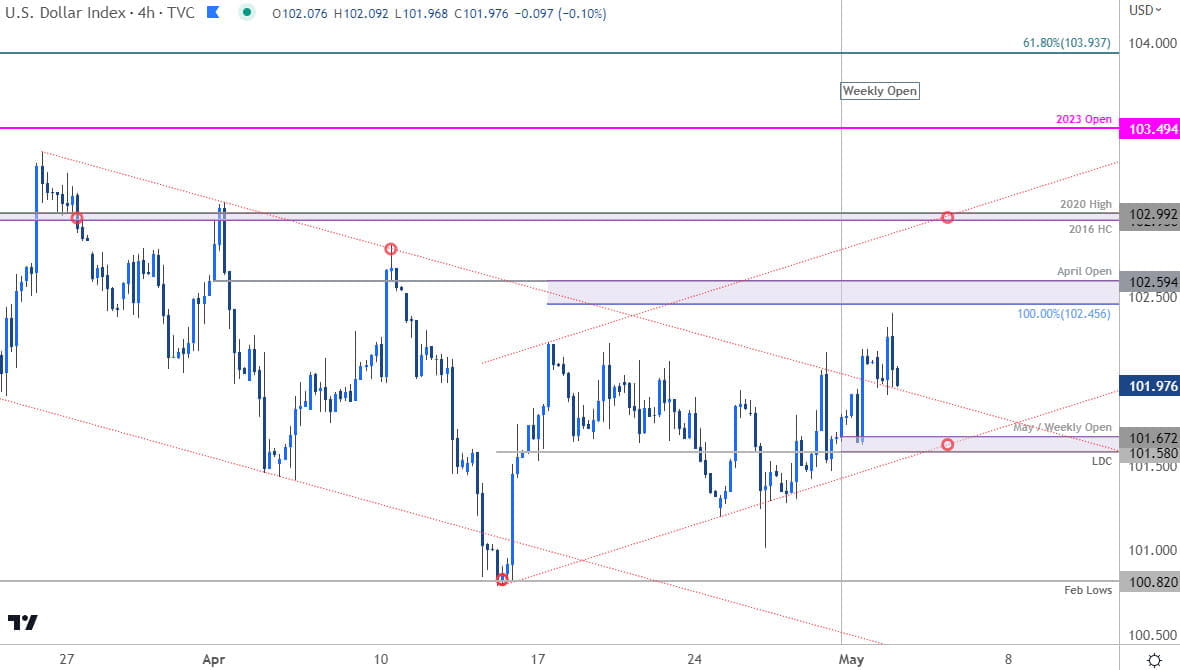
US Dollar Index Price Chart – DXY 240min

Chart Prepared b/y Michael Boutros, Sr. Technical Strategist; DXY on TradingView
Notes: A closer look at USD price action shows DXY breaking out of a multi-week downtrend extending off the late-March / April highs. Initial resistance is eyed with the 100% extension / April open at 102.45/59 backed by 102.95/99 – a region defined by the 2016 high-close and the objective 2020 swing high. A breach / daily close above this threshold would be needed suggest a more significant low was registered last month / a larger reversal is underway.
Look for initial support along former resistance around ~101.90s. Key near-term support rests with the objective low-day close / May-open at 101.58/67. A break / close below this threshold would threaten resumption of the March downtrend towards the 101-handle and the February lows at 100.82- look for a larger reaction there IF reached.
Bottom line: A rebound off downtrend support is threatening a larger recovery towards downtrend resistance. From at trading standpoint, losses should be limited to 101.58 IF price is indeed heading higher on this stretch with a close above 103 needed to clear the way for a larger recovery. Ultimately, losses beyond 100.82 would suggest a breakout of the yearly opening-range and losses could accelerate rather quickly if broken. Stay nimble heading into the FOMC rate decision tomorrow with the ECB and US non-farm payrolls still on tap- watch the weekly close. Review my latest US Dollar weekly technical forecast for a longer-term look at the DXY trade levels.
Key Economic Data Releases

Active Short-term Technical Charts
- Gold short-term price outlook: XAU/USD vulnerable to larger setback
- Australian Dollar short-term outlook: AUD/USD bears emerge
- Japanese Yen short-term outlook: USD/JPY bulls blocked by 135
- Canadian Dollar short-term outlook: USD/CAD bulls emerge at support
- British Pound short-term outlook: GBP/USD threatens correction
- Euro short-term outlook: EUR/USD trend correction on the horizon
--- Written by Michael Boutros, Sr Technical Strategist with FOREX.com


