US Dollar Index Technical Outlook: USD Short-term Trade Levels
- US Dollar Index set to snap six-day sell-off- responds to confluent support
- USD bulls run post-CPI – monthly opening-range break to offer guidance
- DXY Resistance 106.50/65, 107.07/17, 108- Support 105.51/63, 105, 104.38
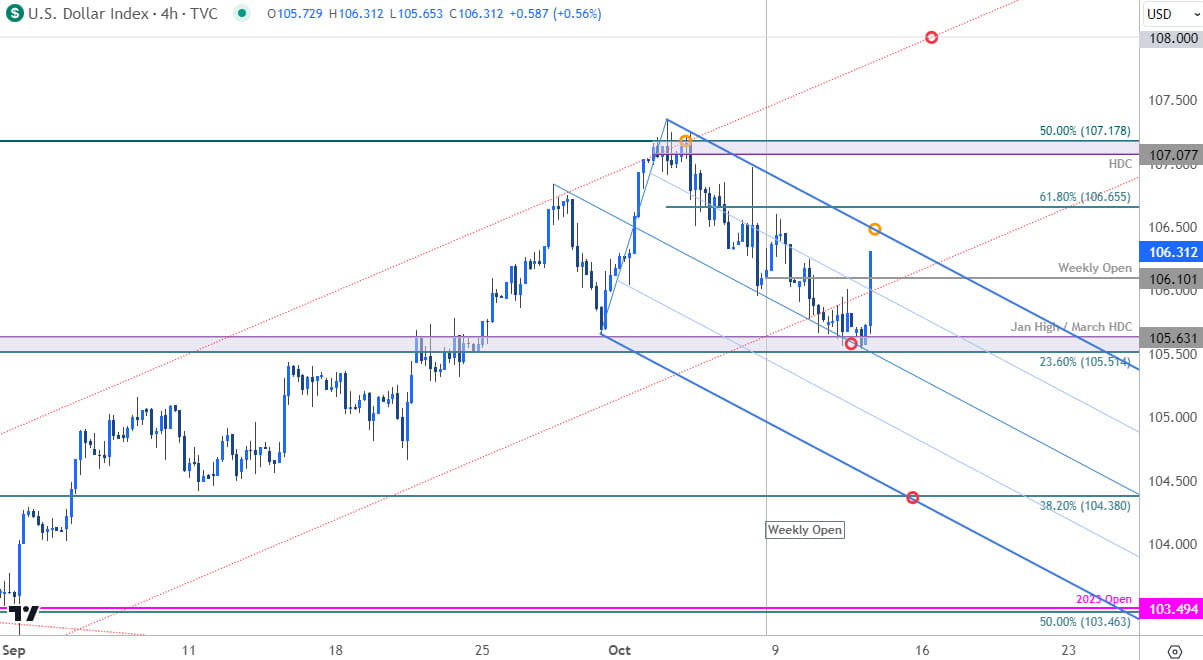
The US Dollar Index is poised to snap a six-day losing streak with DXY attempting to mark an outside-day reversal off support. Is the correction off the highs complete? We’re on the lookout for a breakout of the weekly / monthly opening-ranges here for guidance with today’s post-CPI rally now approaching initial resistance. These are the updated targets and invalidation levels that matter on the USD short-term technical charts.
Review my latest Weekly Strategy Webinar for an in-depth breakdown of this US Dollar technical setup and more. Join live on Monday’s at 8:30am EST.
US Dollar Index Price Chart – USD Daily

Chart Prepared by Michael Boutros, Sr. Technical Strategist; DXY on TradingView
Technical Outlook: In last month’s US Dollar Short-term Outlook, we noted that that DXY was trading into resistance at the yearly highs with a, “topside breach / close above the March / yearly high at 105.88 is needed to mark resumption of the July rally with subsequent resistance objectives eyed at 106.57 and 107.17/20- look for a larger reaction there IF reached.” The index briefly registered an intraday high at 107.34 into the close September before reversing sharply lower with a six-day sell-off responding to confluent support today- the October opening-range is set.
US Dollar Index Price Chart – USD 240min

Chart Prepared b/y Michael Boutros, Sr. Technical Strategist; DXY on TradingView
Notes: A closer look at USD price action shows DXY rebounding off support post-CPI at 105.51/63- a region defined by the 23.6% retracement of the yearly range, the January high and the March high-day close. Note that a close at these current levels would constitute an outside-day reversal off support and highlights the threat of near-term exhaustion.
Initial resistance is eyed with the proposed downslope (blue), near 106.50 backed closely by the 61.8% Fibonacci retracement of the recent decline at 106.65. Ultimately, a breach / close above the high-day close / 50% retracement at 107.07/17 is needed to mark resumption of the July uptrend towards the 108-handle and the 61.8% retracement at 108.97.
A break below the monthly range low would threaten a larger correction within the broader uptrend with such as scenario exposing the 105-handle and the 38.2% retracement of the yearly range at 104.38- look for a larger reaction there IF reached.
Bottom line: The US Dollar is attempting to mark a reversal off lateral support on heels of today’s CPI release with the monthly opening-range now defined by 105.51-107.17- look to the breakout of guidance here. From a trading standpoint, the immediate focus is on a breakout to of weekly opening-range (105.51-106.60) with broader outlook still constructive while above today’s low. Review my latest US Dollar Weekly Technical Forecast for a longer-term look at the DXY trade levels.
Key US Economic Data Releases

Economic Calendar - latest economic developments and upcoming event risk.
Active Short-term Technical Charts
- British Pound Short-Term Outlook: GBP/USD Breakout Build
- Euro Short-term Outlook: EUR/USD Threatens July Downtrend
- Canadian Dollar Short-term Outlook: USD/CAD Rally Fizzles
- Crude Oil Short-term Outlook: Oil Rally Reignites
- Gold Short-term Outlook: XAU/USD Post-FOMC Freefall Searches Support
--- Written by Michael Boutros, Sr Technical Strategist with FOREX.com
Follow Michael on Twitter @MBForex


