US Dollar Talking Points:
- The past week has finally shown some element of stall in what’s become a massive bullish trend in the US Dollar.
- We’re nearing a pocket of volatility on the economic calendar as tomorrow brings the Fed’s preferred inflation gauge of Core PCE and Friday brings Non-farm Payrolls. Next week is loaded, as well, with the Presidential Election on Tuesday and the FOMC rate decision on Wednesday.
- I looked at the USD from several angles in yesterday’s webinar, and you’re welcome to join the next one. Click here for registration information.
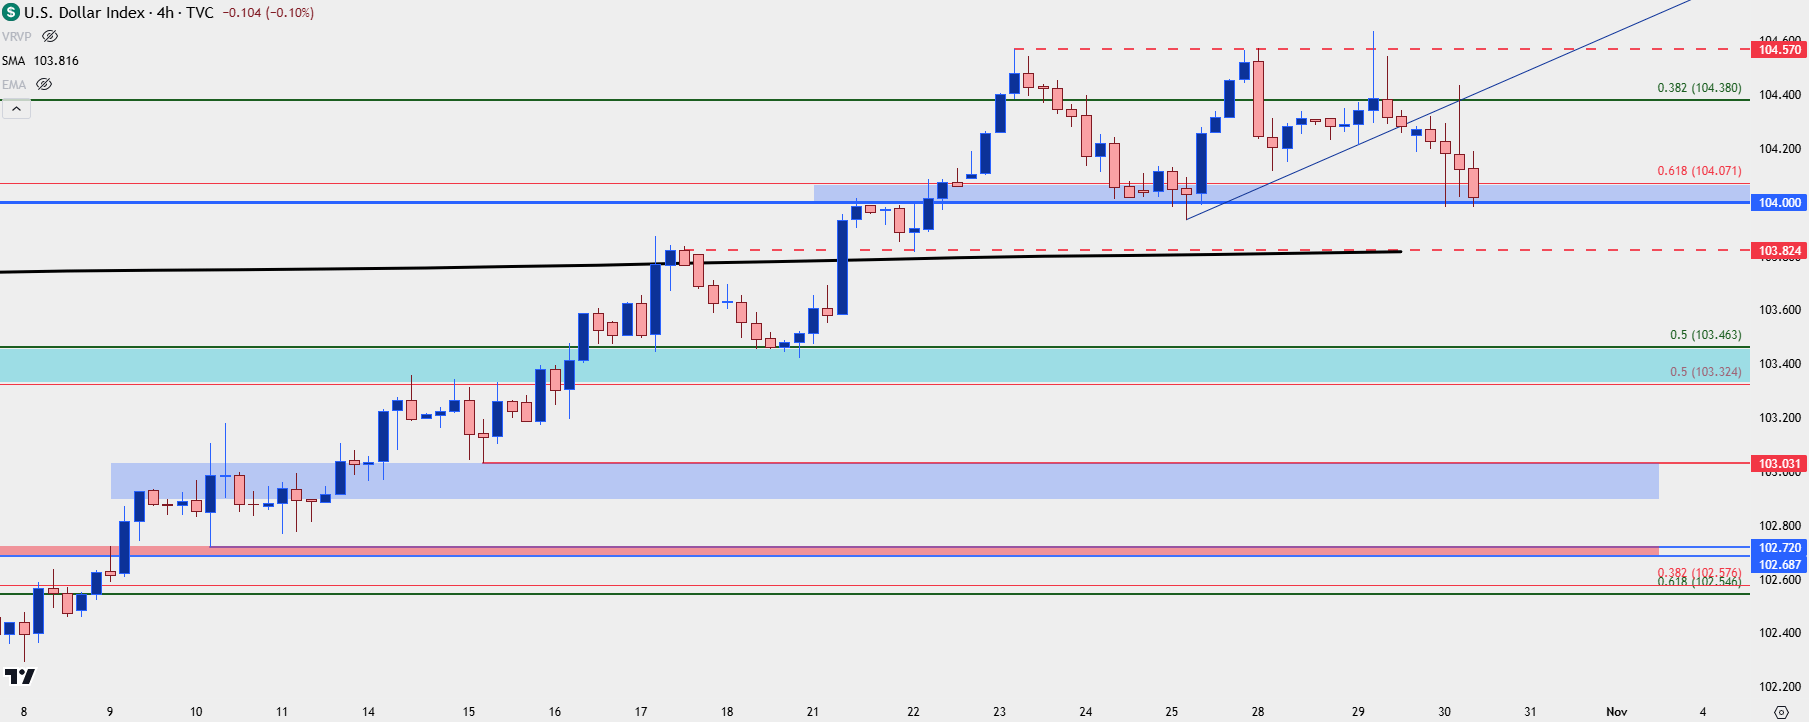
The US Dollar has finally found some resistance that can hold, even if only for a little bit. This happens alongside EUR/USD finally finding some support at a key level that, so far, has remained well-defended. I looked at this from several angles in yesterday’s webinar and today we have a continued hold at the same 104.57 level, going along with a continued bounce in EUR/USD.
The big question now is for how long this pullback might run. We’ve already seen an attempted bounce earlier today from support at prior resistance of 104-104.07. That bounce couldn’t make much ground above the Fibonacci level of 104.38, leading to a retreat to 104.00.
At this point, the next spot of support potential is a little-lower, around the 103.82 prior swing-high that’s now confluent with the 200-day moving average.
US Dollar Four-Hour Price Chart
 Chart prepared by James Stanley; data derived from Tradingview
Data, Rates and Positioning
I say this in practically every webinar, but fundamentals aren’t a perfect push-point for price. The reason for that comes from the fact that prices move based on supply and demand and while supply and demand can often drive from fundamental data, it’s not a perfect relationship. Perhaps more important is positioning in a market. Because if everyone willing and able and wanting to be long already is, well it doesn’t matter how great the data is – there’s simply nobody left to buy. And with no demand, there’s no push for higher prices. And then we can run into the simple deduction that price has failed to rally on seemingly positive data, thereby unsettling longs and causing some element of supply to hit the market. And then as prices go down, so do bulls’ hopes - and in comes more supply.
The old saying goes ‘if a market fails to go up on good news, then look out below.’ That’s why: Sentiment.
Sentiment matters. Positioning matters. And in some cases, it can matter much more than just how great the data prints. This is why we saw the bearish trend in the USD stalling in September, going along with the bullish move in EUR/USD stalling at 1.1200 over the same period of time. The market was heavy to one side, and resistance held in EUR/USD and support in USD until the tide could eventually turn.
I say all of this because the pocket of volatility sitting on the calendar over the next week is intense, and we can run into scenarios that show unintuitive movements in price relative to the data.
As a case in point this morning’s US data, in the form of ADP and GDP, wasn’t all that bad and some could even call it positive. Which, normally, would nudge rate bets around the US and along with it, higher prices in the USD.
That hasn’t happened though. Instead, we’ve seen a continued pullback in what had become an overbought move. If you’d like to hear more about this premise, I spoke of it for an extended period in yesterday’s webinar. But, perhaps more pertinent to the aim of this article is forward-looking strategy.
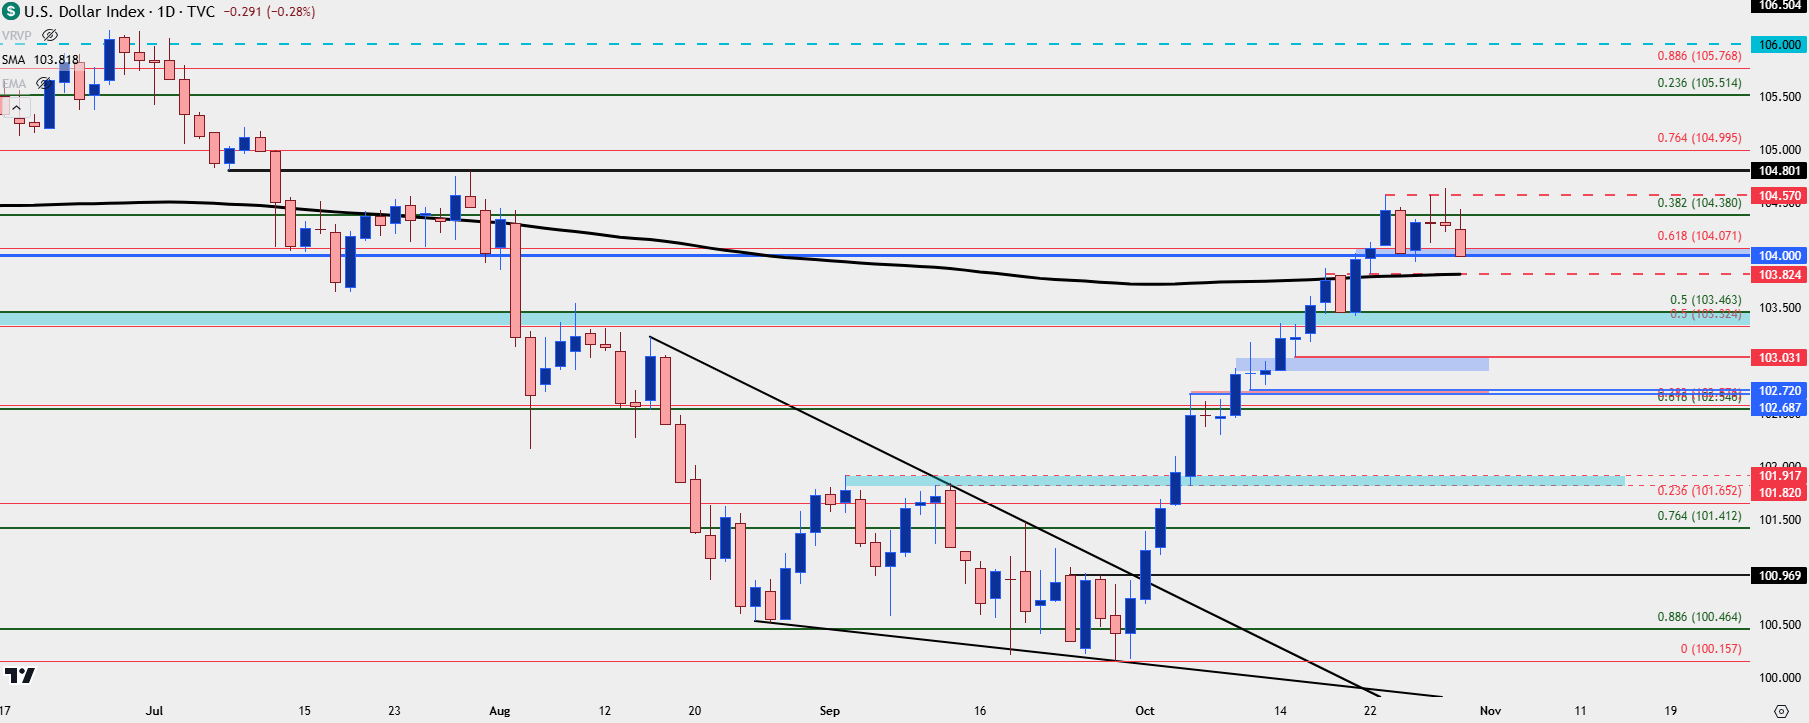
At this point the US Dollar retains a strong bullish trend and we’ve seen what appears to be some profit taking ahead of that batch of data, starting with tomorrow morning’s Core PCE release. The first support that I looked at yesterday and earlier this week at 104-104.07 has already given a mild bounce, but prices pulled right back to it. This leads me to believe a deeper pullback is possible, and that points to the confluent area around 103.82. But, there’s another notable zone below that, from a couple of Fibonacci levels plotted at 103.32-103.46.
Both areas would represent large tests for bulls, and if there is enough buying interest on the sidelines that could continue that trend, I want to see defense at one of those areas, preferably the 103.82 level that’s now confluent with the 200-day moving average.
Above recent resistance at 104.50, I’m looking for continuation moves to test a prior price action swing at 104.80 after which the psychological level of 105.00 comes into play. That’s a big spot, and that’s where I’d expect the trend to stall for a bit if it comes into the picture quickly.
US Dollar Daily Price Chart
 Chart prepared by James Stanley; data derived from Tradingview
--- written by James Stanley, Senior Strategist


